
The Nasdaq Is Split, Again

On Monday, we saw that despite new highs in many of the major U.S. equity indexes, the old school NYSE Advance/Decline Line hadn't made a fresh high for over two months.
It's worse on the Nasdaq.
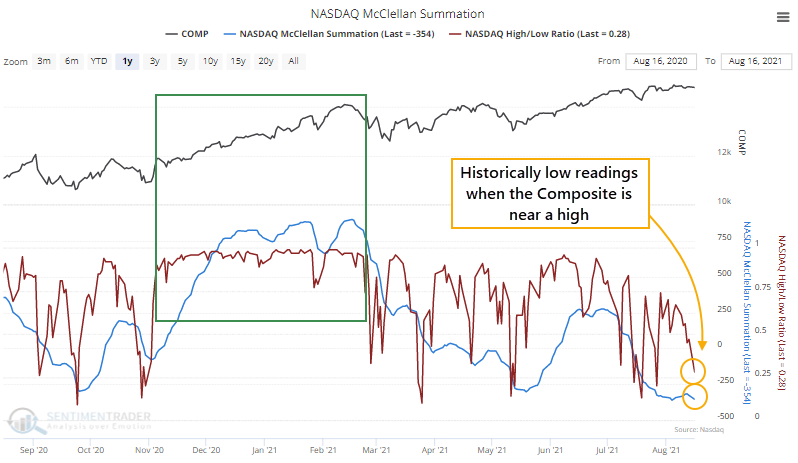
On Monday, the Nasdaq Composite closed within 1% of a 52-week high, and yet two long-term measures of breadth on that exchange fell to very low levels. The McClellan Summation Index closed below -350, and the New High / New Low Ratio was below 30%.
Those are the worst figures in history, dating back to 1986, for a day when the Composite was so near a high. It's in stark contrast to the huge positive momentum thrust from November through February.
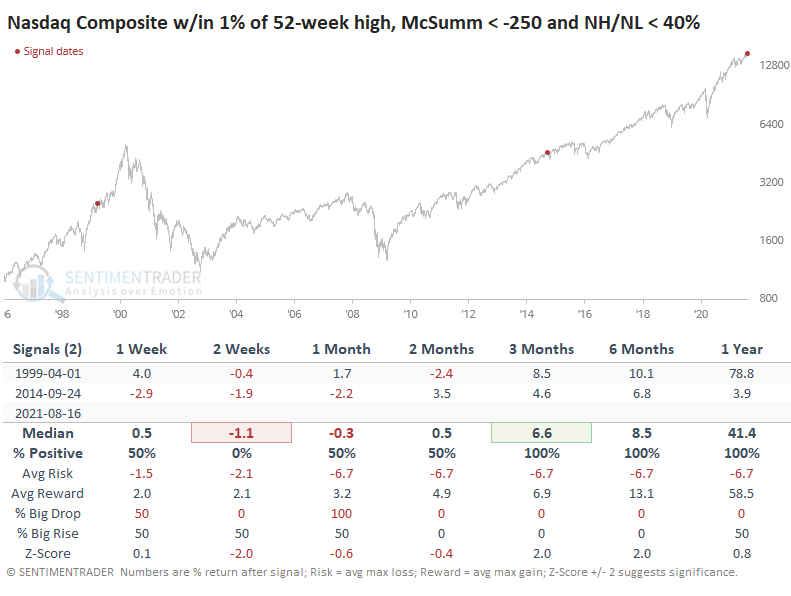
There are only two dates that come close to the current divergences in those indicators. Both times, the Nasdaq took a short-term tumble, with a poor risk/reward ratio, but both times the Nasdaq also recovered in the months ahead.
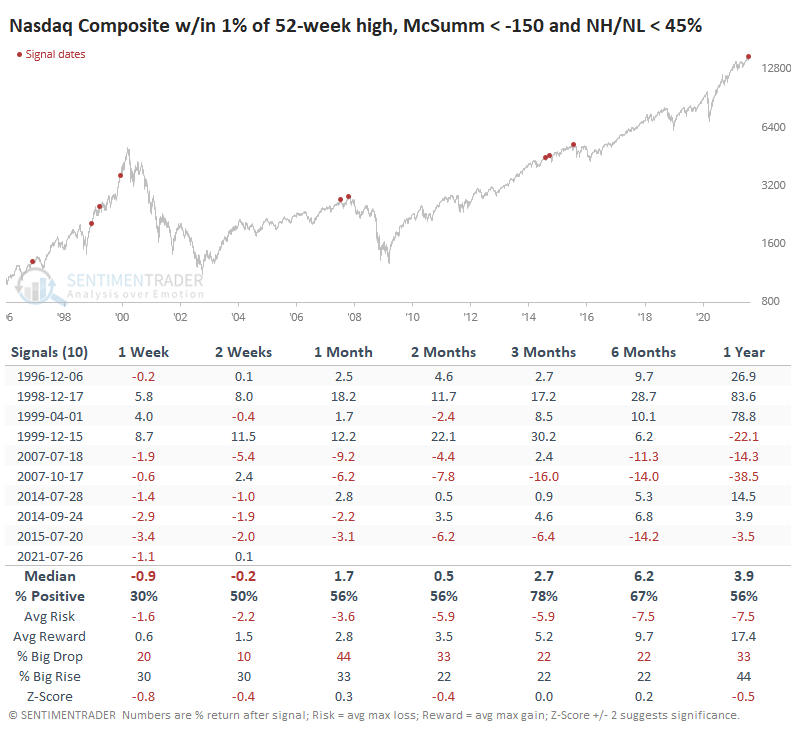
Looking at lesser extremes, there was still a tendency to see a short-term shakeout. Every signal since 2007 has led to short-term losses in the Composite.
The fact that there are so many 52-week highs and 52-week lows simultaneously means that the HiLo Logic Index has spiked. The 10-day average moved above 2.5, which the Backtest Engine shows has been a terrible sign during the past 20 years.
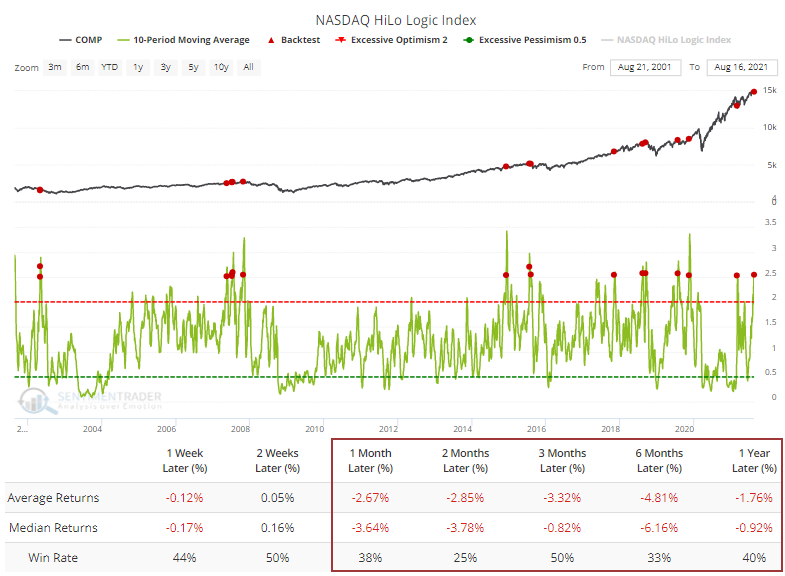
Only 4 of the 16 dates showed a positive return over the next two months. Bulls could argue that two of those dates were the most recent ones, which somewhat reduces the bearish argument.
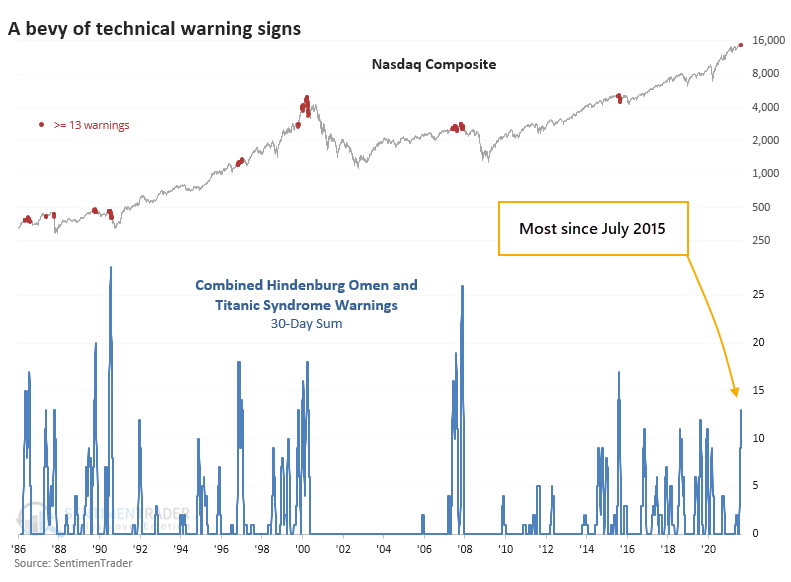
This internal tumult has been triggering some technical warning signs, such as the Hindenburg Omen and Titanic Syndrome for the Nasdaq exchange.
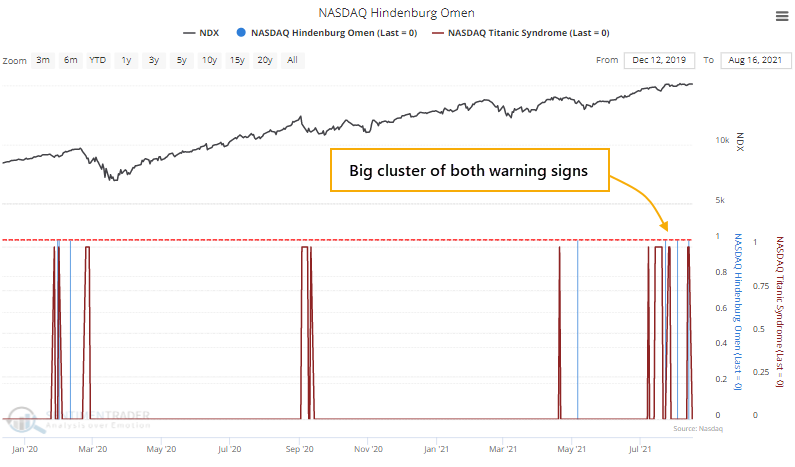
Over the past 30 sessions, a combined 13 signals have been triggered, the most in six years.
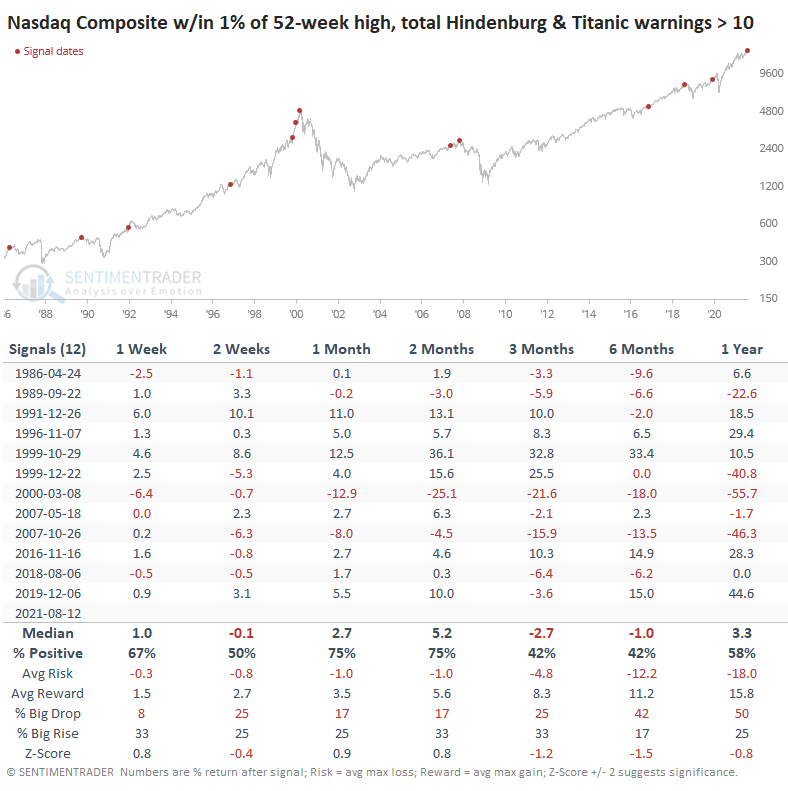
When there has been such a cluster of signals with the Composite within spitting distance of a new high, trouble was brewing most of the time. The Nasdaq escaped any damage in 1996, 1999 (for a while), and 2016 but otherwise witnessed high volatility and negative returns.
This year has been one for the record books on several different fronts. It's frustrating that one of those fronts is the number of methods that have failed to precede the kind of price action that they normally do. Sentiment extremes, breadth divergences, price patterns, seasonality - all have gone by the wayside as the creeper trend prevails.
This happened in 2013-14, which led to a choppy 2015. And it happened in 2017, which led to a rocky 2018. After the speculative blow-off in late January - early February of this year, we've been on the lookout for major deterioration under the surface of the indexes. There have been periodic bouts of that since then, and the indexes have almost immediately recovered. We'll have to see if this is yet another episode.