Headlines
|
|
Weekly Wrap for Feb 5 - More mania as internals decline:
More signs of a speculative mania, and also more signs that there is weaker participation on this latest jump to new highs in the indexes.
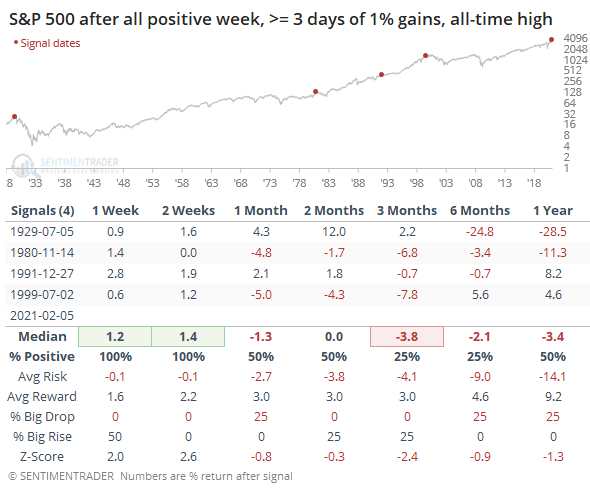
Just because: We've been asked quite a few times if there's ever been a week as positive as this one. Every day in the S&P 500 showed a gain, there were at least 3 days with 1% gains, and it closed at an all-time high. Rare company, indeed.
The latest Commitments of Traders report was released, covering positions through Tuesday: The 3-Year Min/Max Screen shows that "smart money" commercial hedgers...did pretty much nothing. This was one of the quietest reports we can recall, with no new extremes, and only minor reversals in prior extremes. There was nothing of note in the report.
Bottom Line:
See the Outlook & Allocations page for more details on these summaries STOCKS: Weak sell
We're in an extremely speculative environment that is enough to become defensive, especially with recent cracks showing in what had been pristine breadth conditions. The spike in fear from last week has already mostly dissipated and likely not enough to offset the negatives over a medium-term time frame. BONDS: Weak buy
Various parts of the market have been hit in recent weeks, with mild oversold conditions. Treasuries have been hit hard and will likely start to register some extremes soon. GOLD: Weak buy
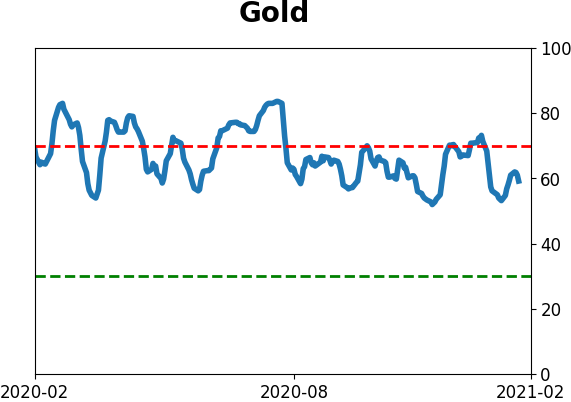
A dollar trying to rebound from a severe short position has weighed on gold and miners. The types of signals they've given in recent weeks, within the context of their recent surge, have usually resulted in higher prices over a medium- to long-term time frame.
|
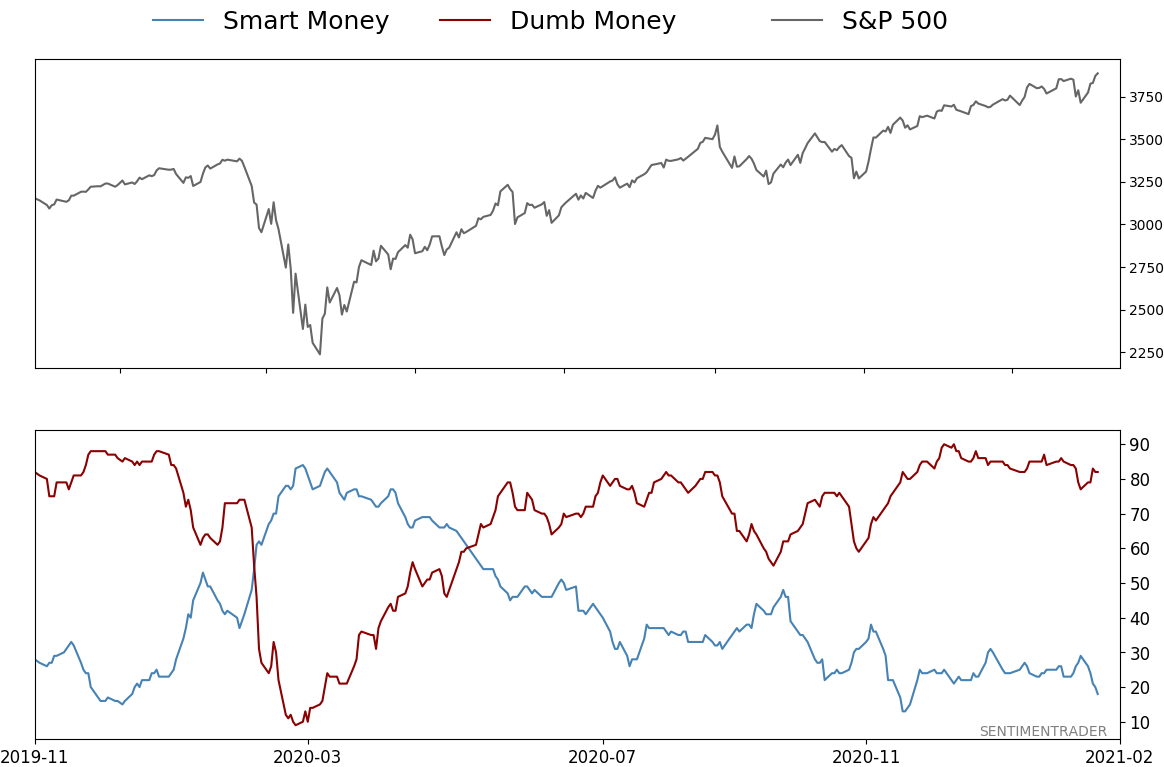
Smart / Dumb Money Confidence
|
Smart Money Confidence: 18%
Dumb Money Confidence: 82%
|
|
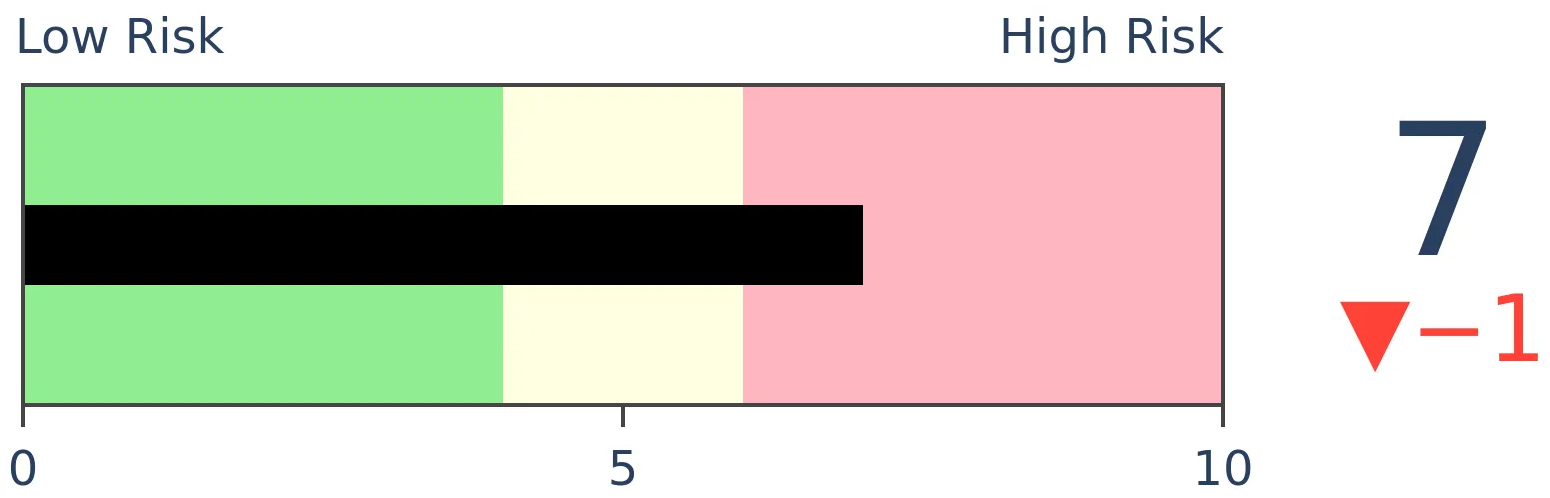
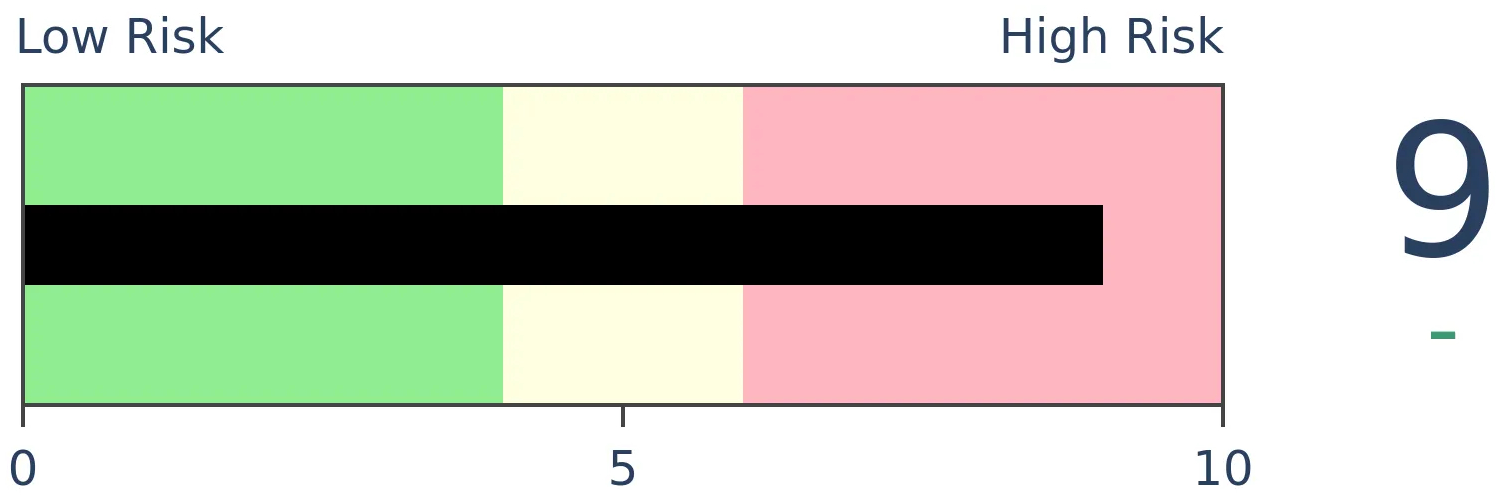
Risk Levels
Stocks Short-Term
|
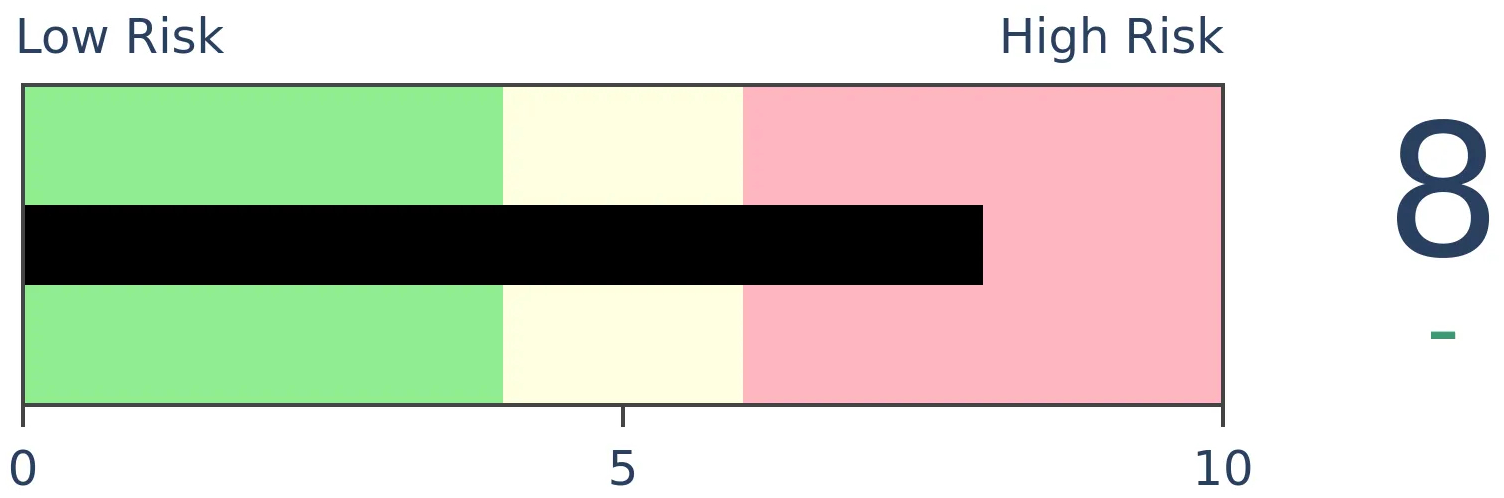
Stocks Medium-Term
|
|
Bonds
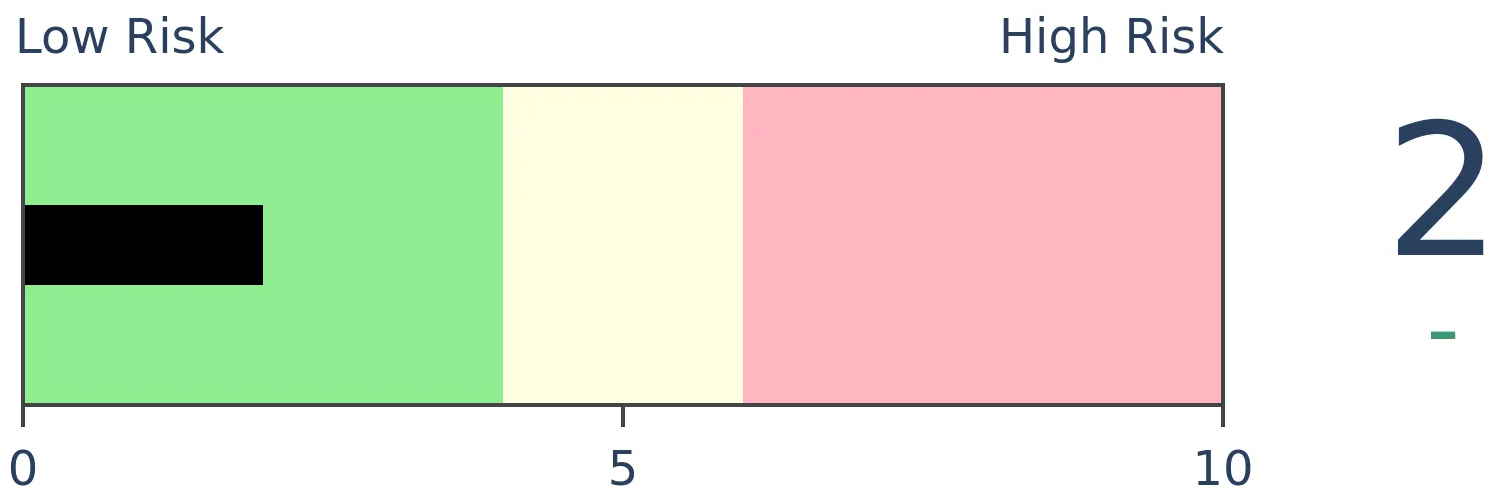
|
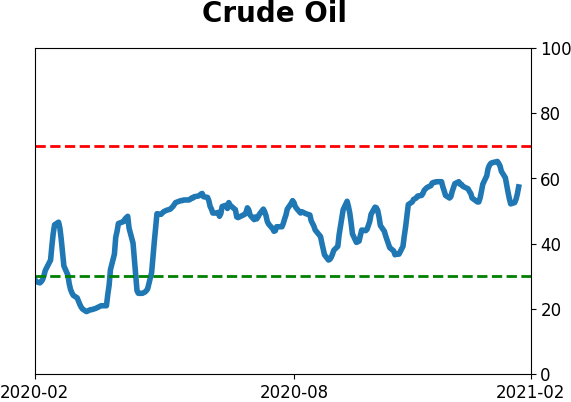
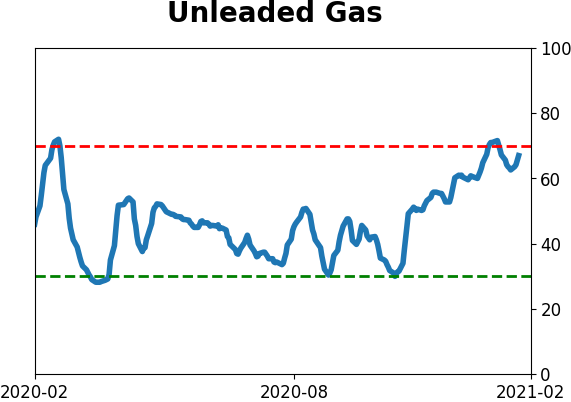
Crude Oil

|
|
Gold

|
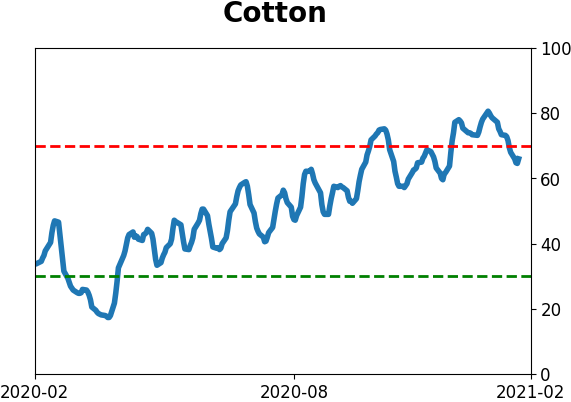
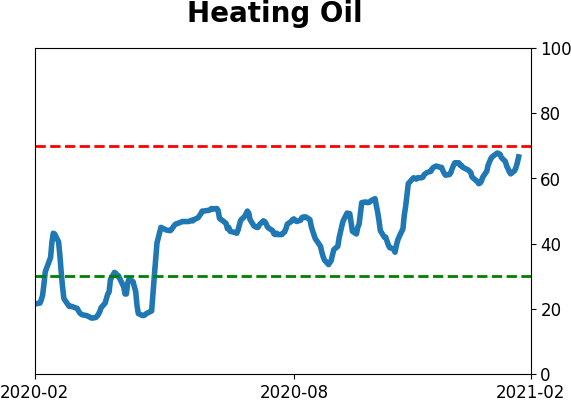
Agriculture
|
|
Research
BOTTOM LINE
More signs of a speculative mania, and also more signs that there is weaker participation on this latest jump to new highs in the indexes.
FORECAST / TIMEFRAME
None
|
The goal of the Weekly Wrap is to summarize our recent research. Some of it includes premium content (underlined links), but we're highlighting the key focus of the research for all. Sometimes there is a lot to digest, with this summary meant to highlight the highest conviction ideas we discussed. Tags will show any related symbols and time frames related to the research.
| STOCKS |
 |
|
|
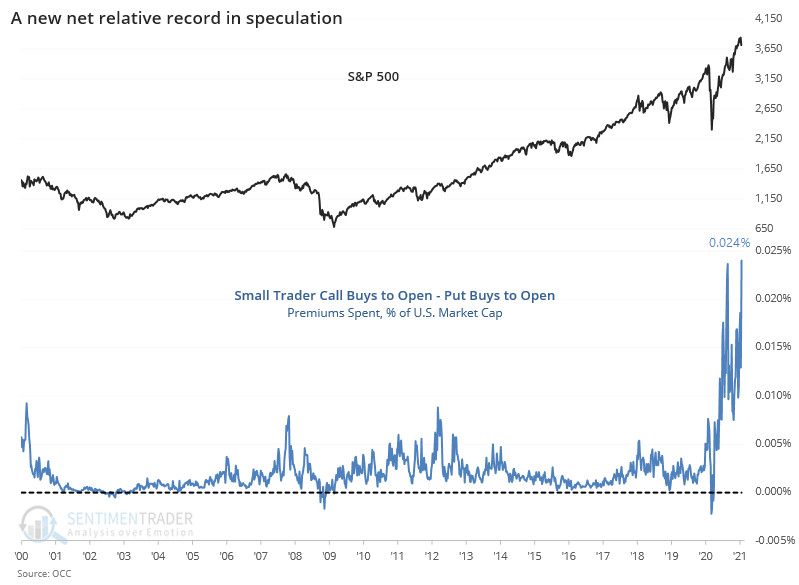
We entered the week in the midst of a mania, at least in the options market.
We're once again witnessing record speculative activity among the smallest of traders. The most comprehensive and objective way we can express this is the net premiums spent on calls minus premiums spent on puts relative to the total market cap of U.S. stocks. It's a tiny fraction, but that's ignoring all the knock-on effects that call buying has on the underlying market. And once again, this is at a record high.
Someone has to take the other side of these long call options by selling them, and they hedge their exposure by buying the underlying stock. Their sensitivity to this exposure is estimated by Gamma Exposure. As a percentage of the market cap of all U.S. stocks, it has now been elevated for 50 days and is nearing a record.
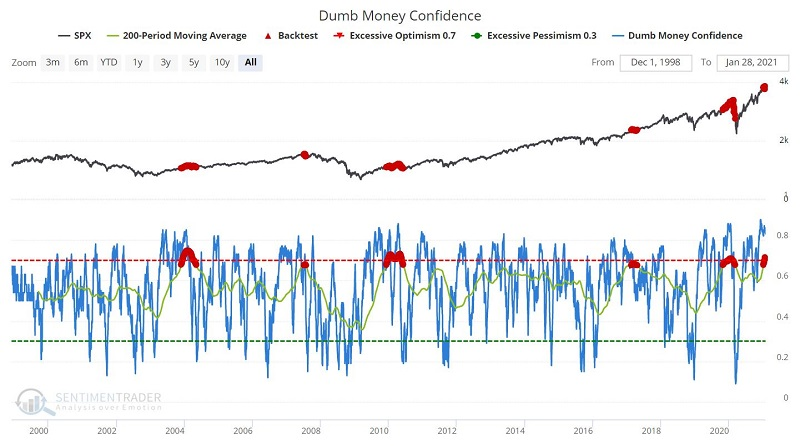
Jay pointed out that sentiment has been extreme enough, for long enough, that the 200-day average of Dumb Money Confidence is nearing the highest level ever.
The chart below displays the S&P 500 Index with Dumb Money Confidence and its own 200-day moving average. Highlighted in red are those occasions when the 200-day moving average itself exceeded 0.67. It is presently flashing a warning sign.
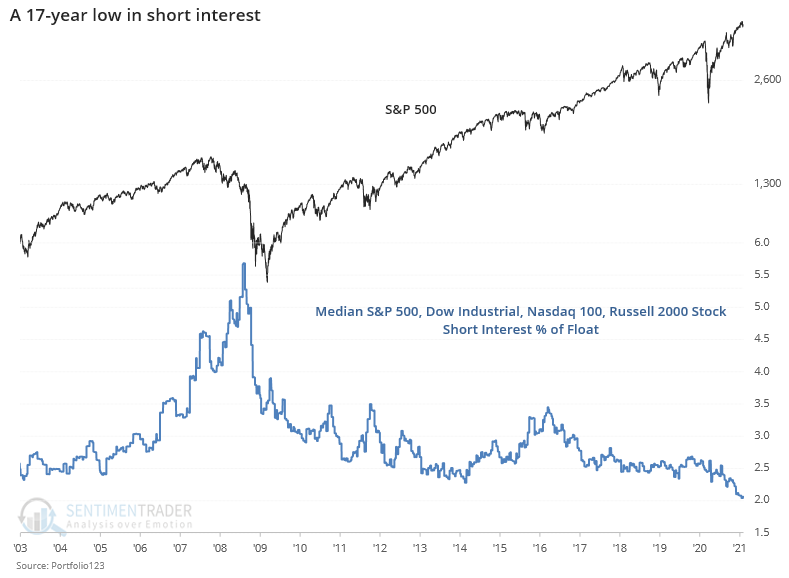
The big topic over the past week has been short interest. By the sounds of mainstream media, there's a massive build-up of shares that greedy hedge funds have borrowed and sold, hoping to buy them back later at a lower price. Yet the median stock in the S&P 500 has only 1.6% of its float sold short, the lowest amount since 2001.
The average stock across the S&P, Dow Industrials, Nasdaq 100, and Russell 2000 has just over 2% of its float sold short, a 17-year low.
As companies emerge from the chaos of last spring, many of them are still losing money. More than 7% of firms within the S&P 500 are showing negative operating earnings over the past 12 months, the highest percentage in over a decade. Among companies in the Russell 2000, nearly 35% of them have not turned a profit, even as the index itself skyrocketed to one of its best rallies since its inception.
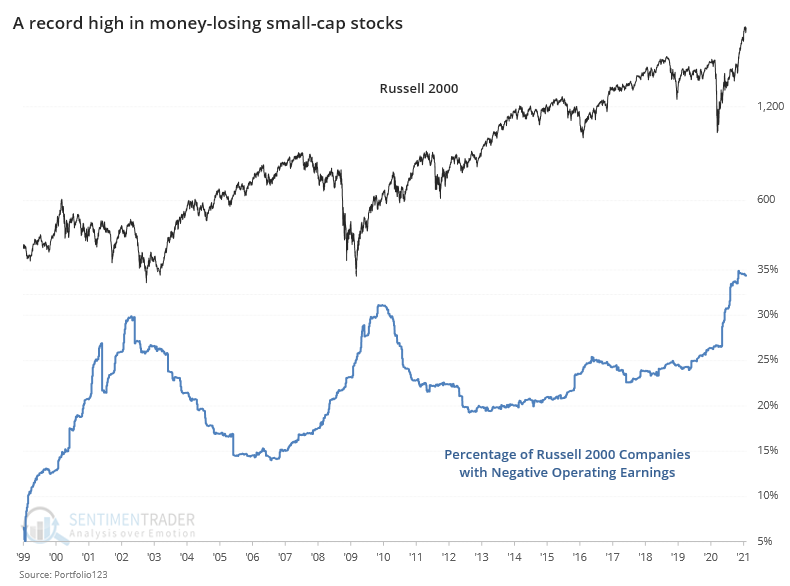
So, we have a situation with the most money-losing companies in a decade, with a market accepting of the lowest-quality issues ever, and a decades-low number of skeptical investors.
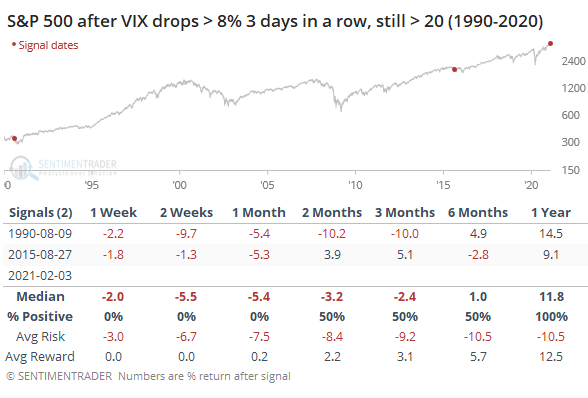
It's interesting that implied volatility is plunging after the surge last week. The VIX dropped more than 8.5% now on back-to-back days, even though it's still hanging above 25. Theoretically, this is supposed to be positive, but hasn't proven out that way in the past.
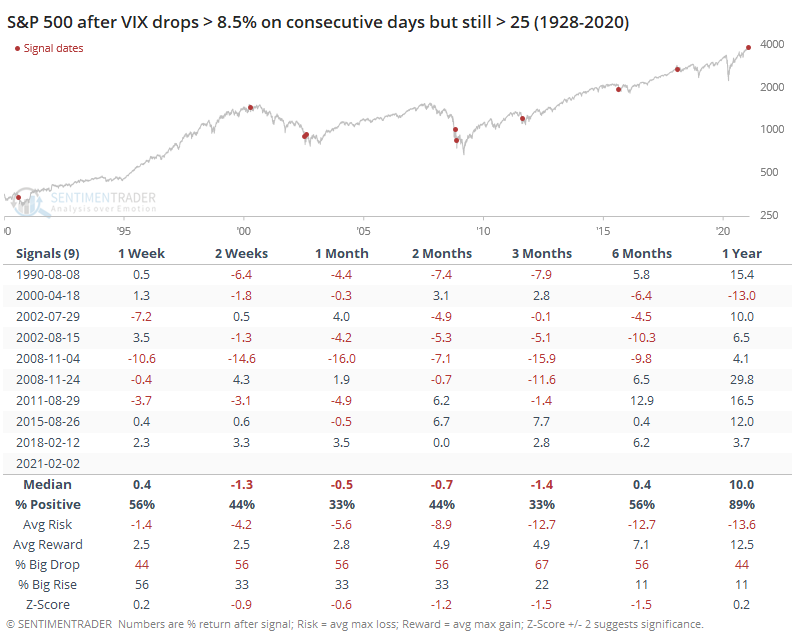
Then it did it again on Thursday.
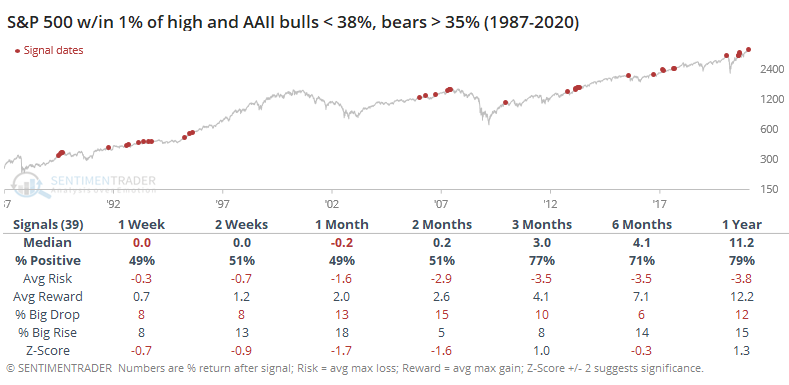
The latest AAII survey showed still-low optimism despite stocks roaring back to new highs. That's not necessarily a good thing, either.
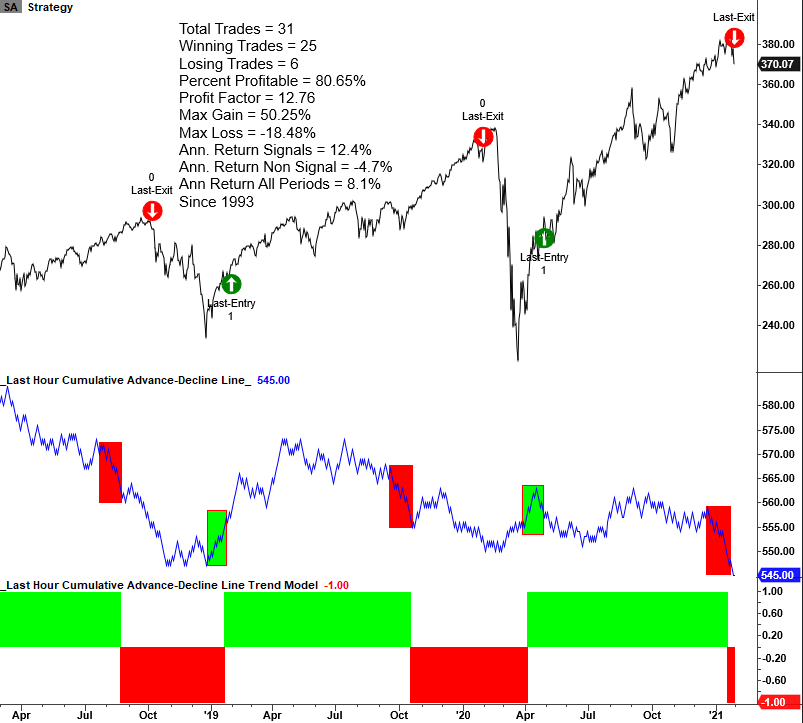
Selling pressure in the last hour of trading has been very negative of late. Dean created a trend following model for the last hour of trading. The model uses a cumulative advance-decline line based upon whether the last hour of trading was up or down.
A new sell signal triggered last Friday. The last hour of trading most days this week hasn't been impressive, either.
Still, the internal environment is still mostly healthy. Despite some oddities and concerns leading up to this week, most of the measures we look at aren't yet signaling the kind of deterioration seen at other major peaks. It doesn't have to happen, it just usually does following an extreme in sentiment as we've seen.
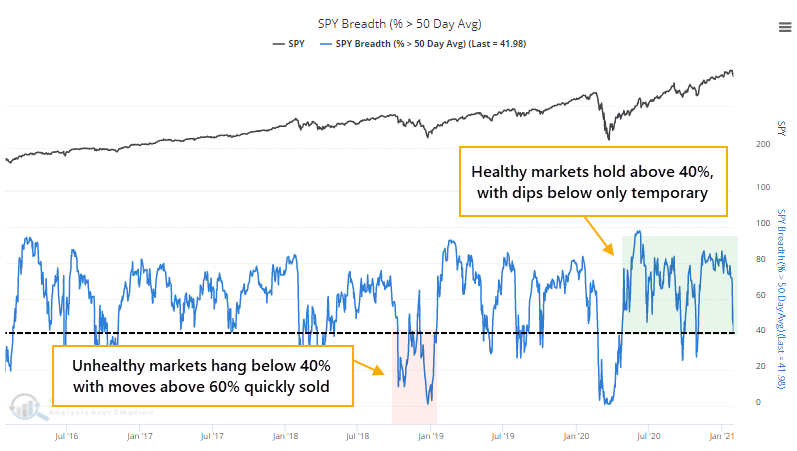
The S&P 500 suffered a key reversal last week and lost its 50-day moving average. But more than 40% of stocks still managed to hold above their own averages. During unhealthy environments, we consistently see fewer than 40% of stocks above their averages, and moves above 60% tend to bring sellers in quickly. So far, this still looks healthy.
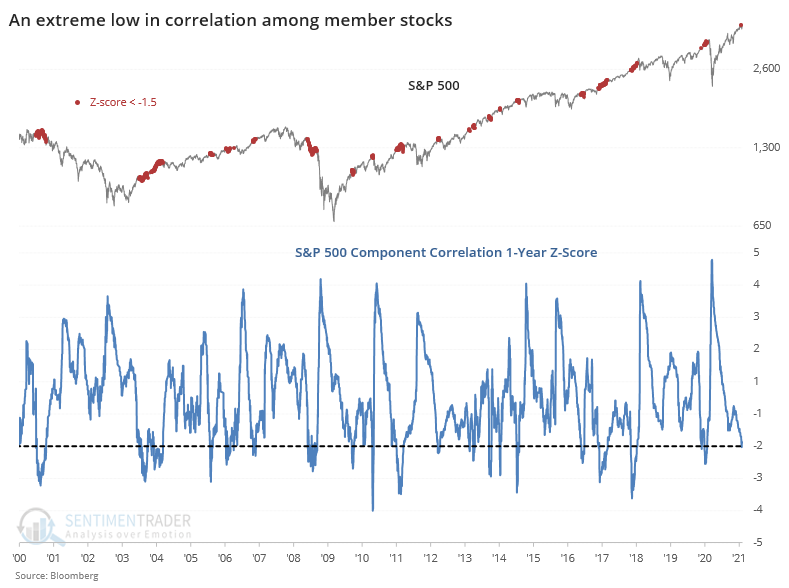
The mostly good market has allowed investors to focus on the individual merits of their stocks, so the correlation among them has plunged to an extremely low level. This has preceded weak 3-6 month returns, especially in some of the higher-risk factors.
Dean and I have been semi-obsessively checking for signs of internal deterioration for over a month. Following a speculative extreme like we've seen since November, internal divergences are usually an excellent heads-up that the excesses are on the cusp of being unwound.
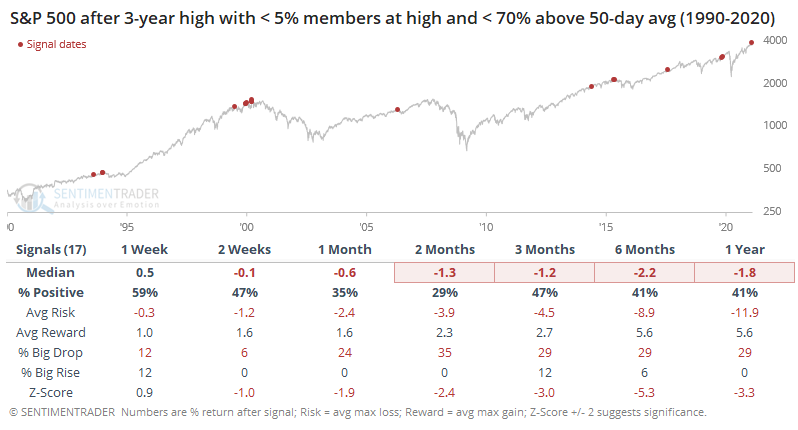
It's not to the point where it's pound-the-table obvious, but there are certainly more signs now than before. The S&P 500 moved to a record high, but fewer than 5% of its member stocks also hit a high on Thursday. And fewer than 70% of them have even made it above their 50-day moving averages.
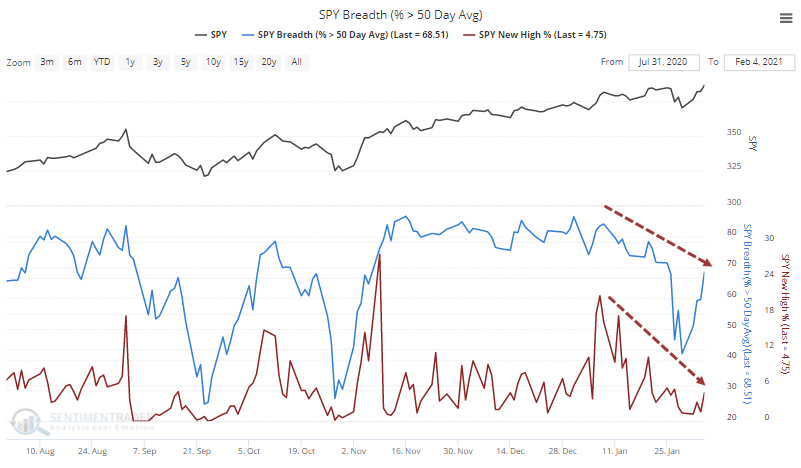
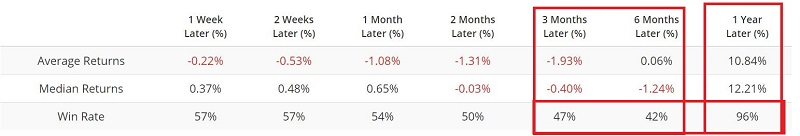
This kind of move has been decidedly negative for forward returns.
Jay discussed in-depth a way to capitalize on the idea that upside in stocks might be capped in the coming month(s), in case all these sentiment extremes finally do start to matter, and the environment deteriorates.
The strategy is known as a "bear put spread", which involves buying one put option at a higher strike price and selling another put option at a lower strike price. If we want to be able to make money on even a small decline in the price of the underlying security, we will use the following guidelines:
- Option expiration with at least 30 days left until expiration (so that we can hold the trade for a month)
- Buy a put with a delta close to -60
- Sell a put with a delta close to -30
Delta is the option Greek that tells us roughly the stock equivalent position. In other words, buying a put option with a delta of -60 gives you roughly the same expected profit and loss of shorting 60 shares of the underlying security.
Buying a -60 delta gives us an "in-the-money" position (a put option is considered "in-the-money" if the strike price is above the current price of the underlying security) that can begin to make money quickly if the underlying security declines in price.
Selling a -30 delta does two things for us:
- The premium received for selling the put helps pay for the -60-delta put that we bought
- Allows time decay to work in our favor if the underlying security drops below the strike price of the option we bought (rather than work against us if we only bought a put).
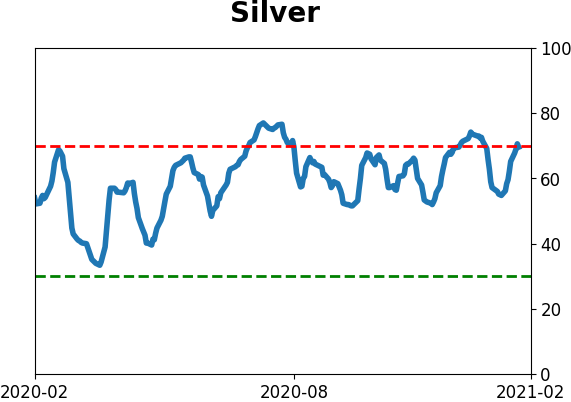
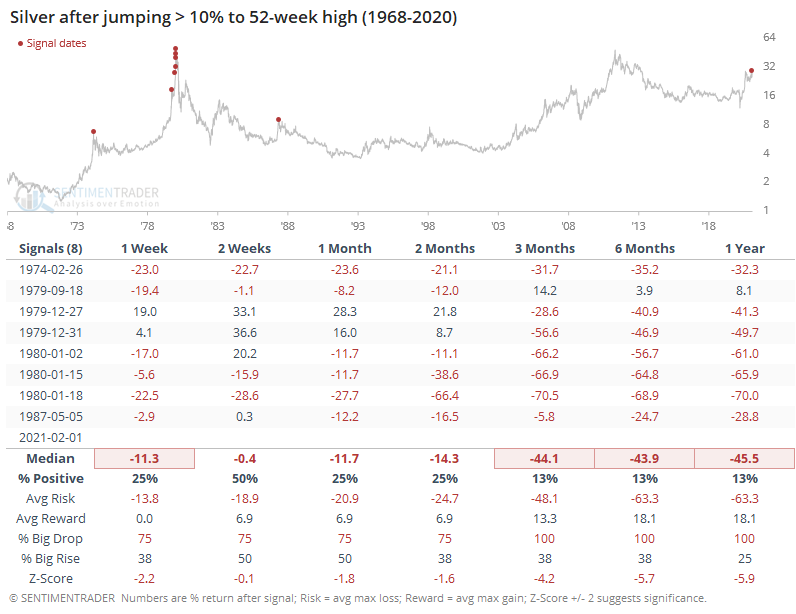
Whatever the guesses are that retail traders can push a physical commodity market into disequilibrium, they helped to at least squeeze silver higher by one of its largest amounts ever in a single day, measured from previous close to intraday high.
These have not ended well for the metal.
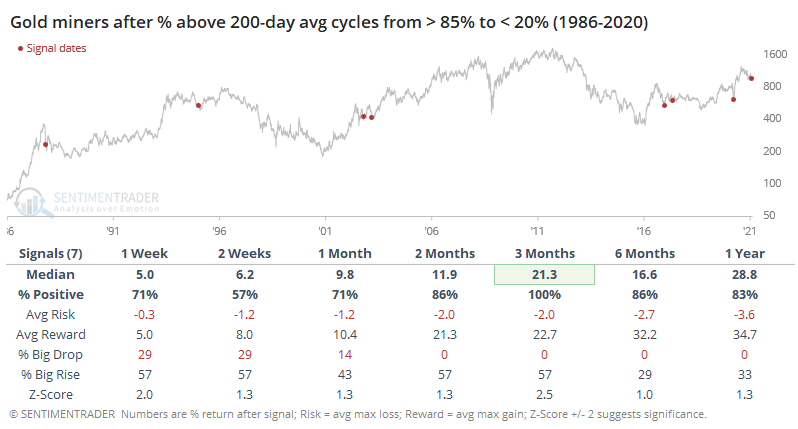
The long-term uptrend in gold may be teetering on the edge, which has a debatable tendency to lead to more weakness should the 50-day finally cross below the 200-day. When it comes to miners, they've gotten hit hard enough that on an average day over the past 2 weeks, only 20% of them were holding above their 200-day moving averages.
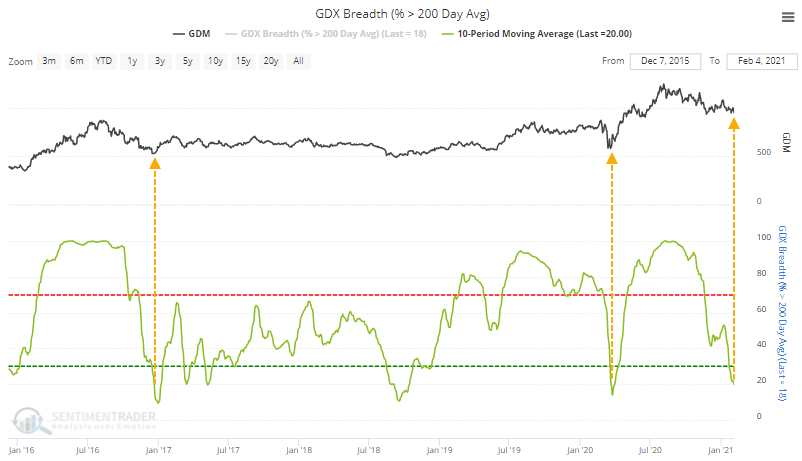
This comes on the heels of a period when more than 85% of them were above their long-term average. Going back as far as we can, this kind of behavior has resulted in rebounds over the next 3 months.
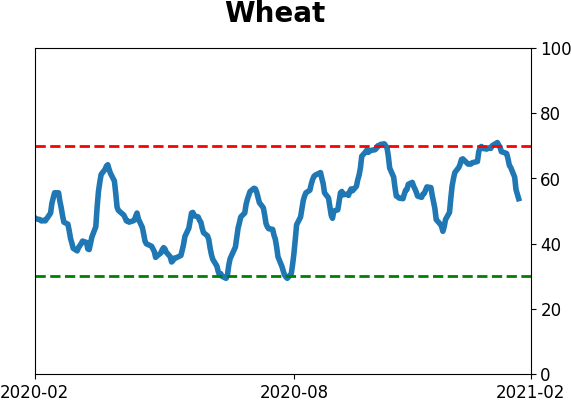
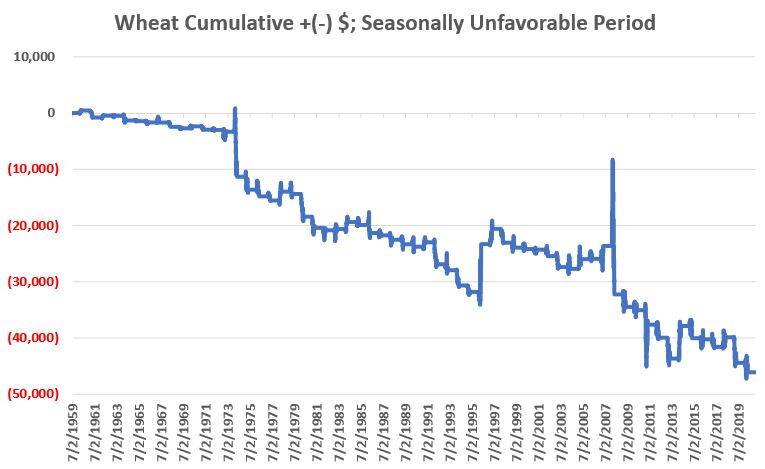
Jay noted that wheat is entering a difficult part of the calendar.
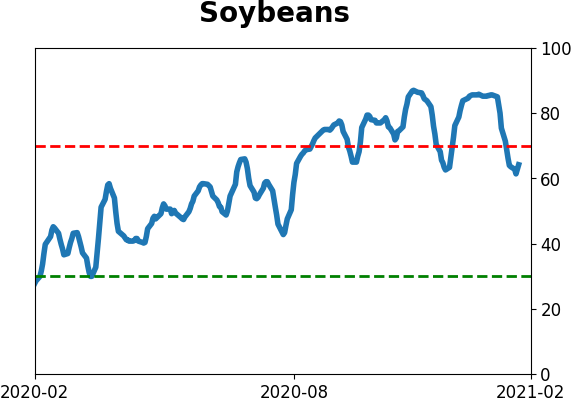
In a piece last week, he noted that February, March, and April are historically a seasonally favorable period for soybeans. For wheat, it is a different story. Because wheat has an entirely different planting cycle than soybeans and corn, it tends to have its own unique seasonal tendencies.
The following chart shows the accumulated profit or loss generated over the years. Again, we can see a couple of rip-roaring counter (seasonal) trend rallies. But the long-term trend is unmistakable.
Active Studies
| Time Frame | Bullish | Bearish | | Short-Term | 0 | 0 | | Medium-Term | 2 | 6 | | Long-Term | 15 | 3 |
|
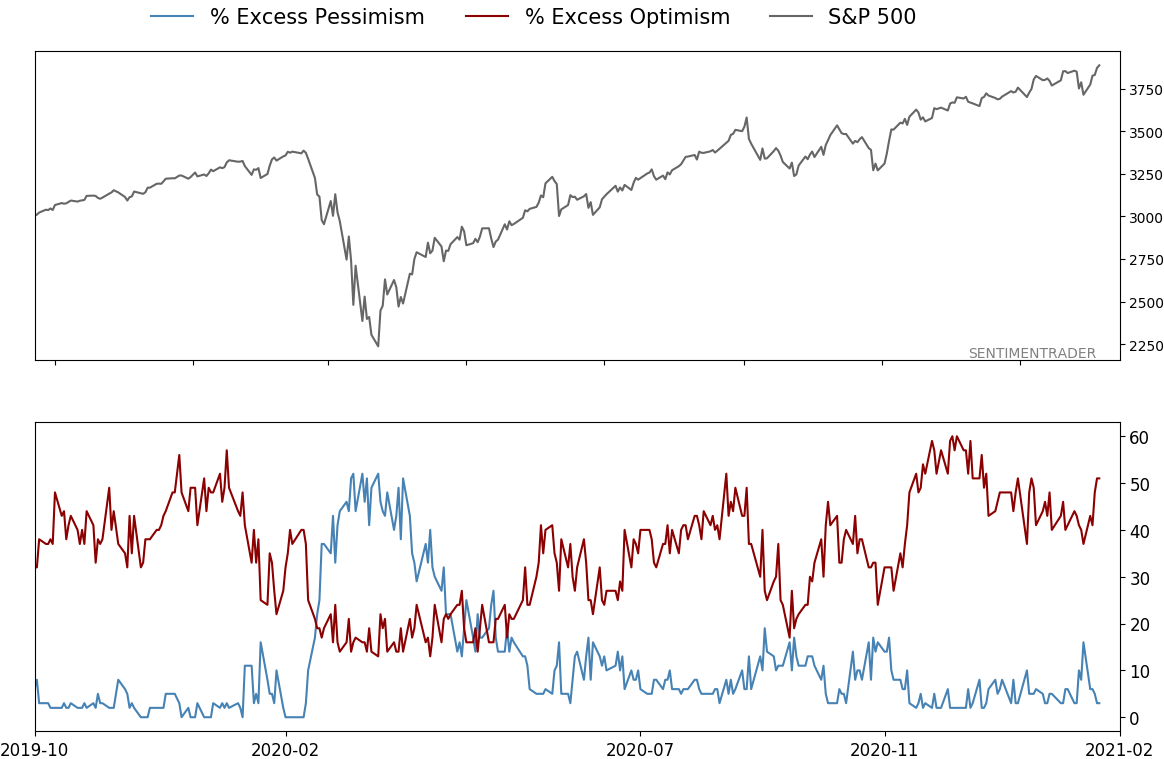
Indicators at Extremes
% Showing Pessimism: 3%
Bullish for Stocks
VIX
|
|
Portfolio
| Position | Description | Weight % | Added / Reduced | Date | | Stocks | 8.7% RSP | 8.7 | Reduced 28.8% | 2021-01-26 | | Bonds | 9.5% ANGL, 9.1% SCHP, 9.0% BND | 27.6 | Reduced 0.2% | 2021-01-26 | | Commodities | GCC | 2.3 | Reduced 2.1%
| 2020-09-04 | | Precious Metals | GDX | 8.9 | Added 4.8% | 2020-12-01 | | Special Situations | 10.3% XLE, 8.9% PSCE | 19.2 | Added 19.2% | 2021-01-26 | | Cash | | 33.4 | | |
|
Updates (Changes made today are underlined)
With a market that has seen the kinds of broad participation and big breath thrusts like we did in the fall, it's hard to become too negative. Those kinds of conditions have consistently preceded higher returns over the next 6-12 months. It's the interim that's more of an issue. Even conditions like that haven't prevented some shorter-term pullbacks. And when we combine an environment where speculation is rampant and recent days have seen an increase in cracks under the surface of the indexes, it's enough to become more defensive over a short- to medium-term time frame. We still don't have much confirmation from the price action in the indexes, so those who are more conservative would likely wait before increasing cash levels. In a bid to more closely align the portfolio with what most of our members consider "stocks", we have moved any sector-specific investments to the "special situations" category instead of "stocks." This way, the "stocks" category is essentially the most benchmarked index in the world, the S&P 500. RETURN YTD: 4.2% 2020: 8.1%, 2019: 12.6%, 2018: 0.6%, 2017: 3.8%, 2016: 17.1%, 2015: 9.2%, 2014: 14.5%, 2013: 2.2%, 2012: 10.8%, 2011: 16.5%, 2010: 15.3%, 2009: 23.9%, 2008: 16.2%, 2007: 7.8%
|
|
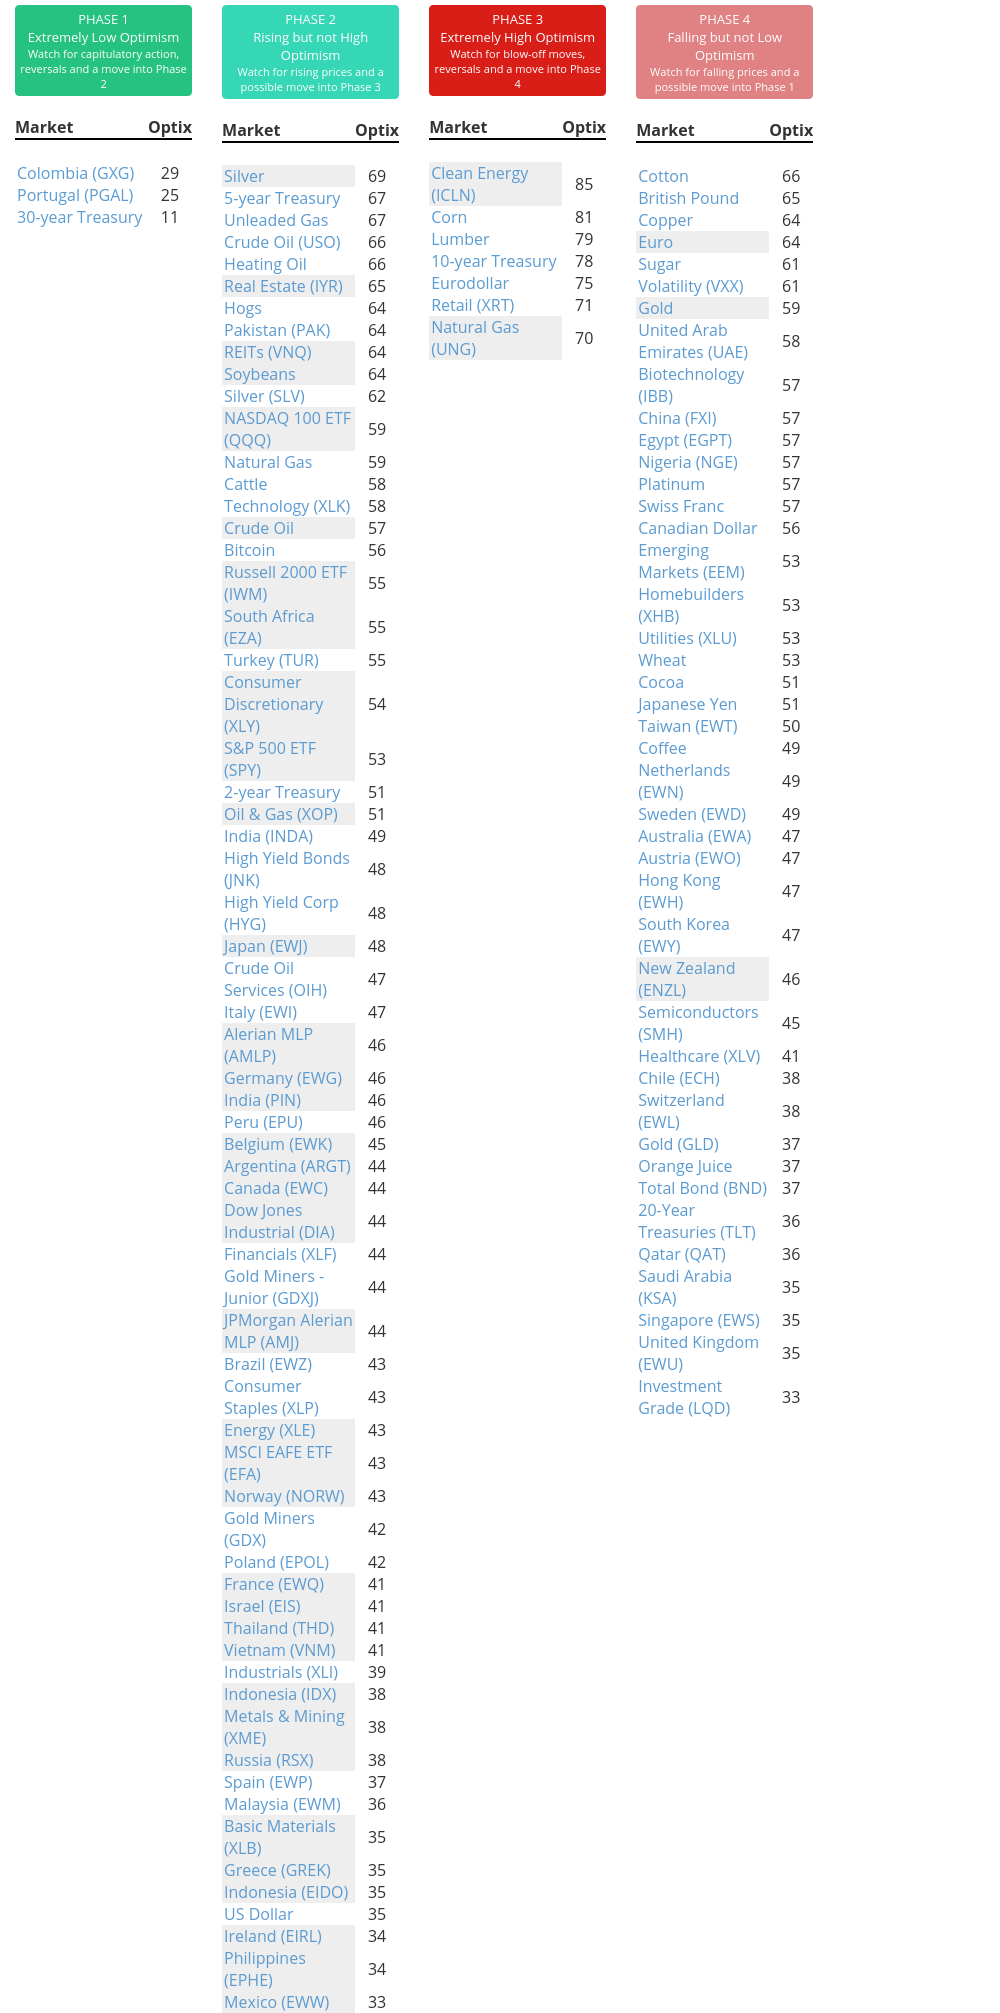
Phase Table
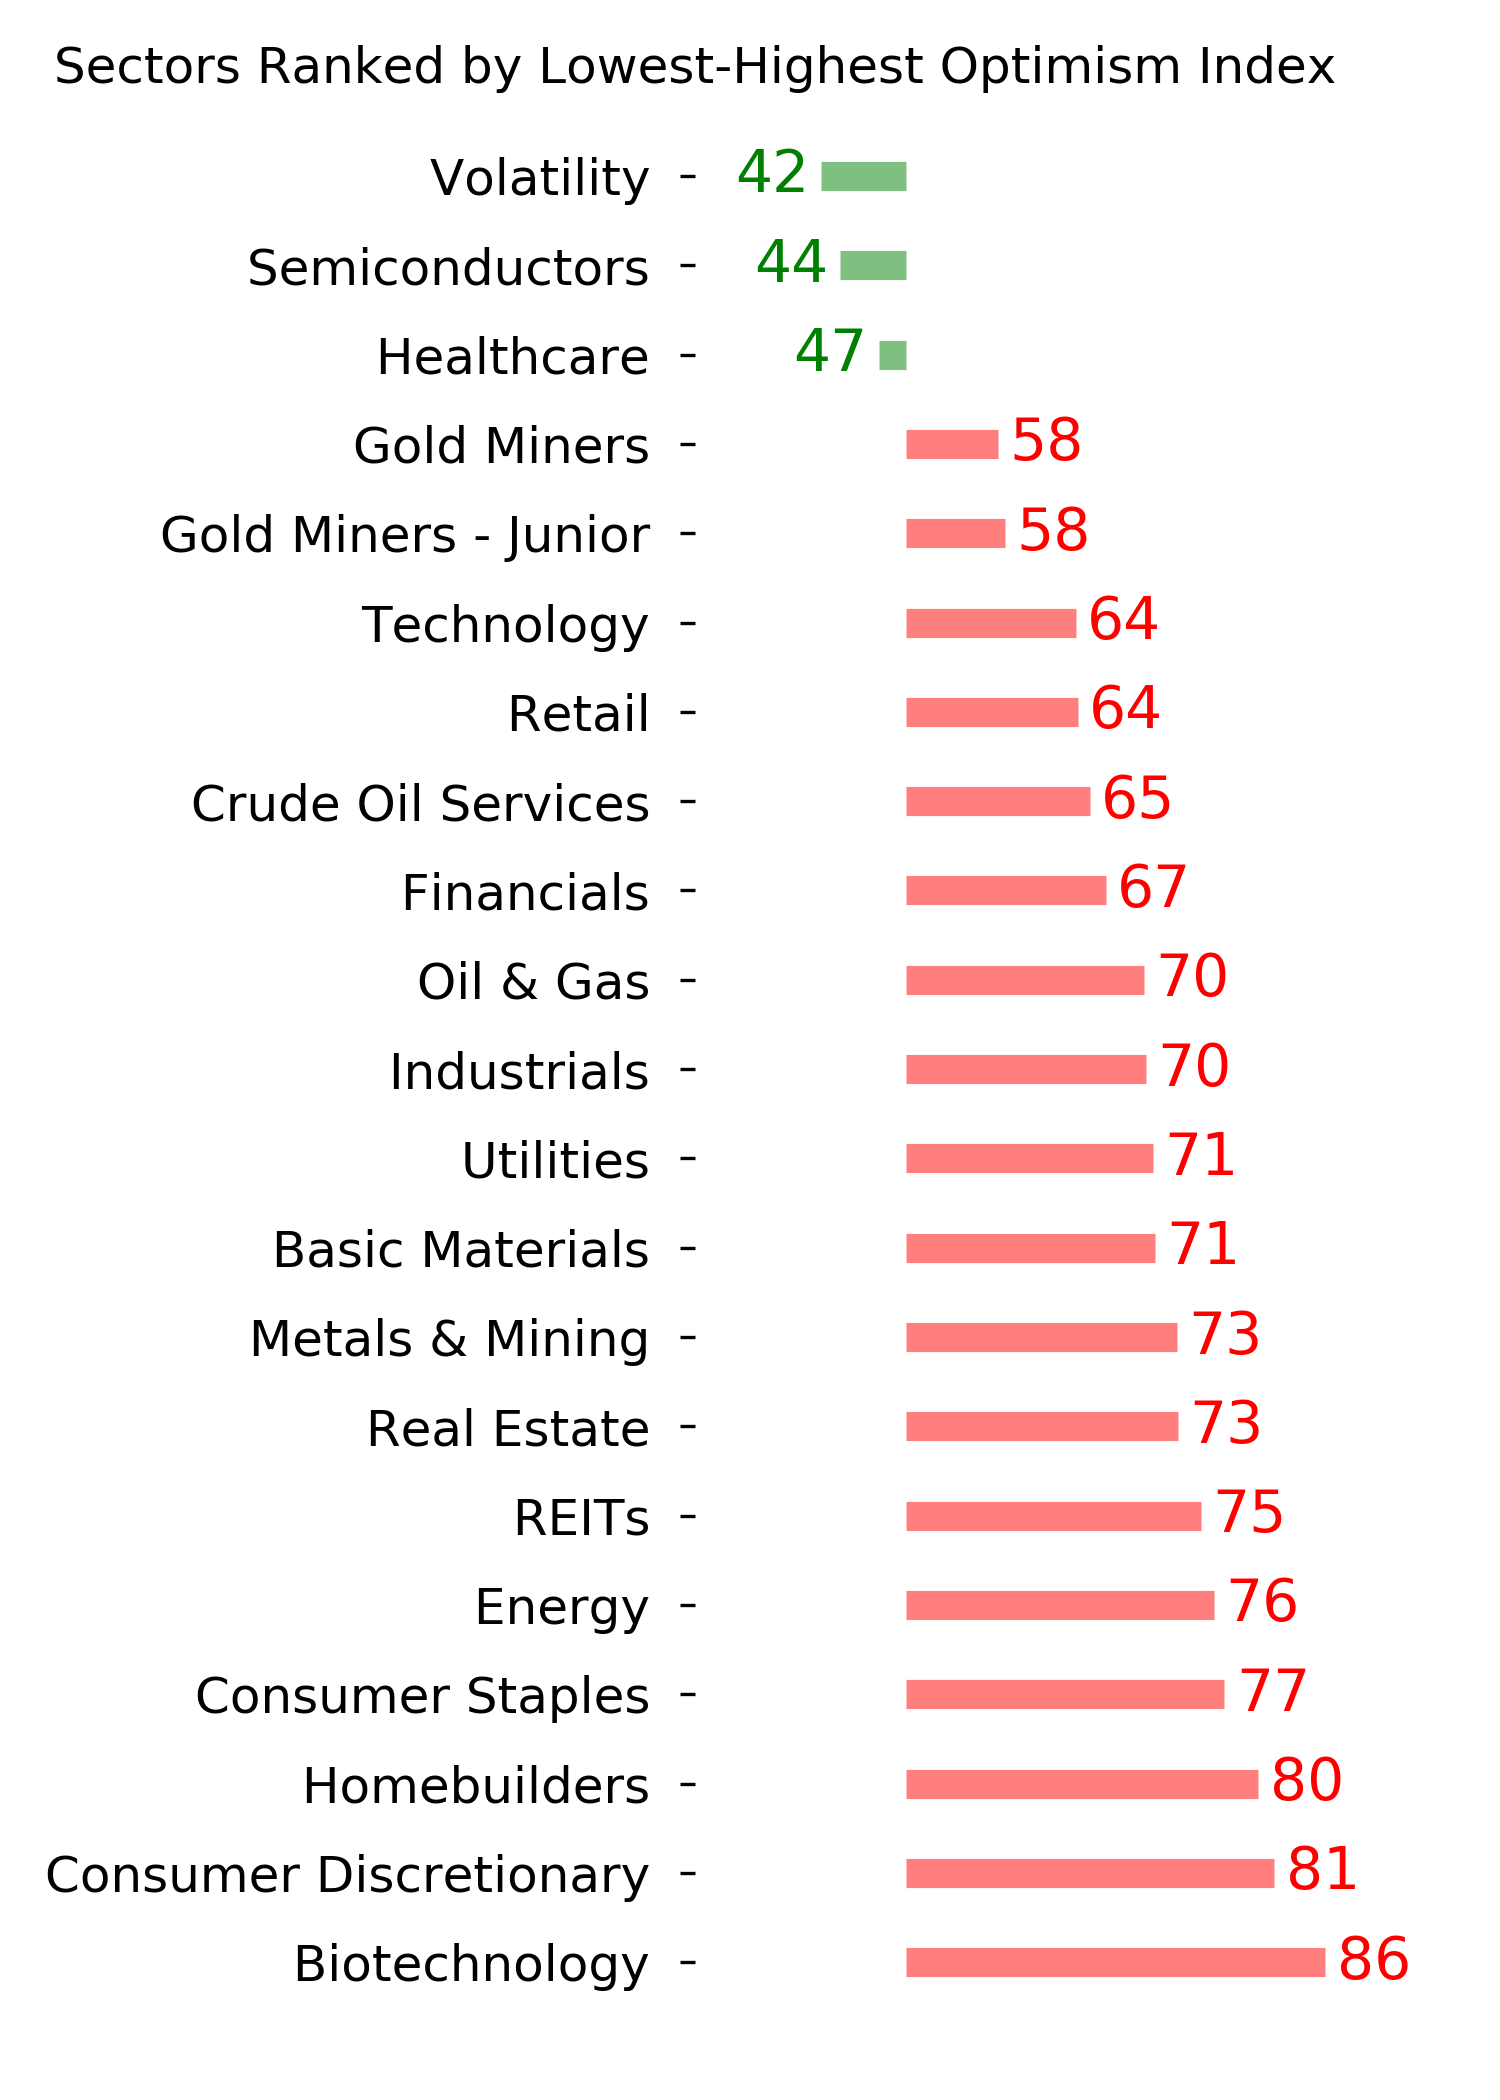
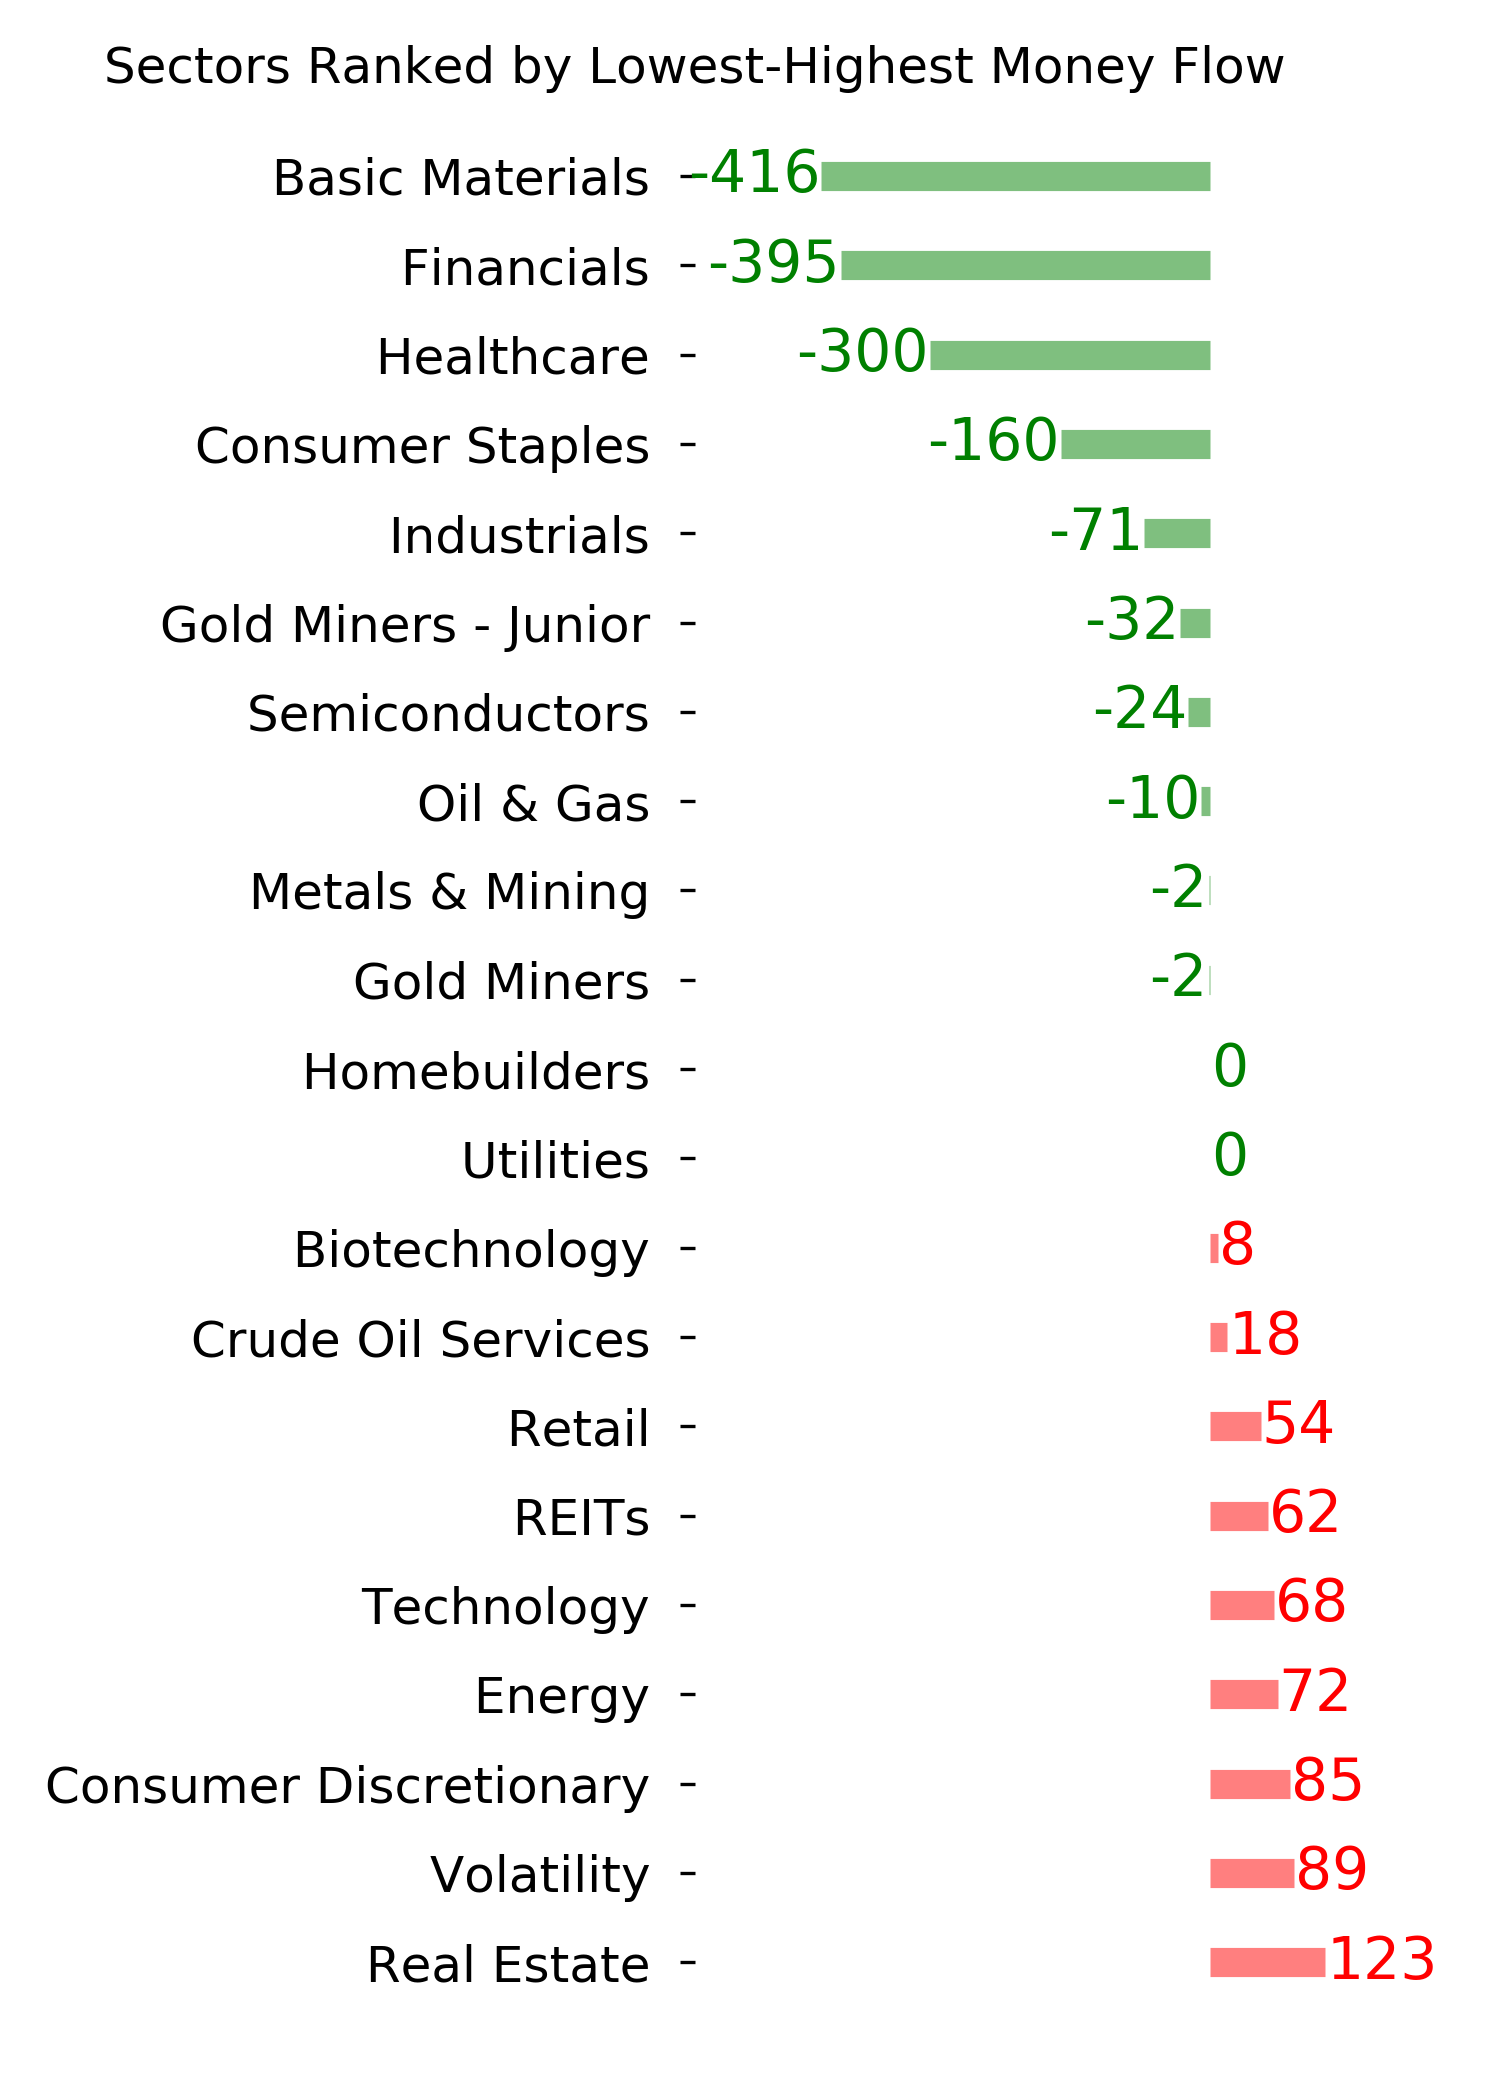
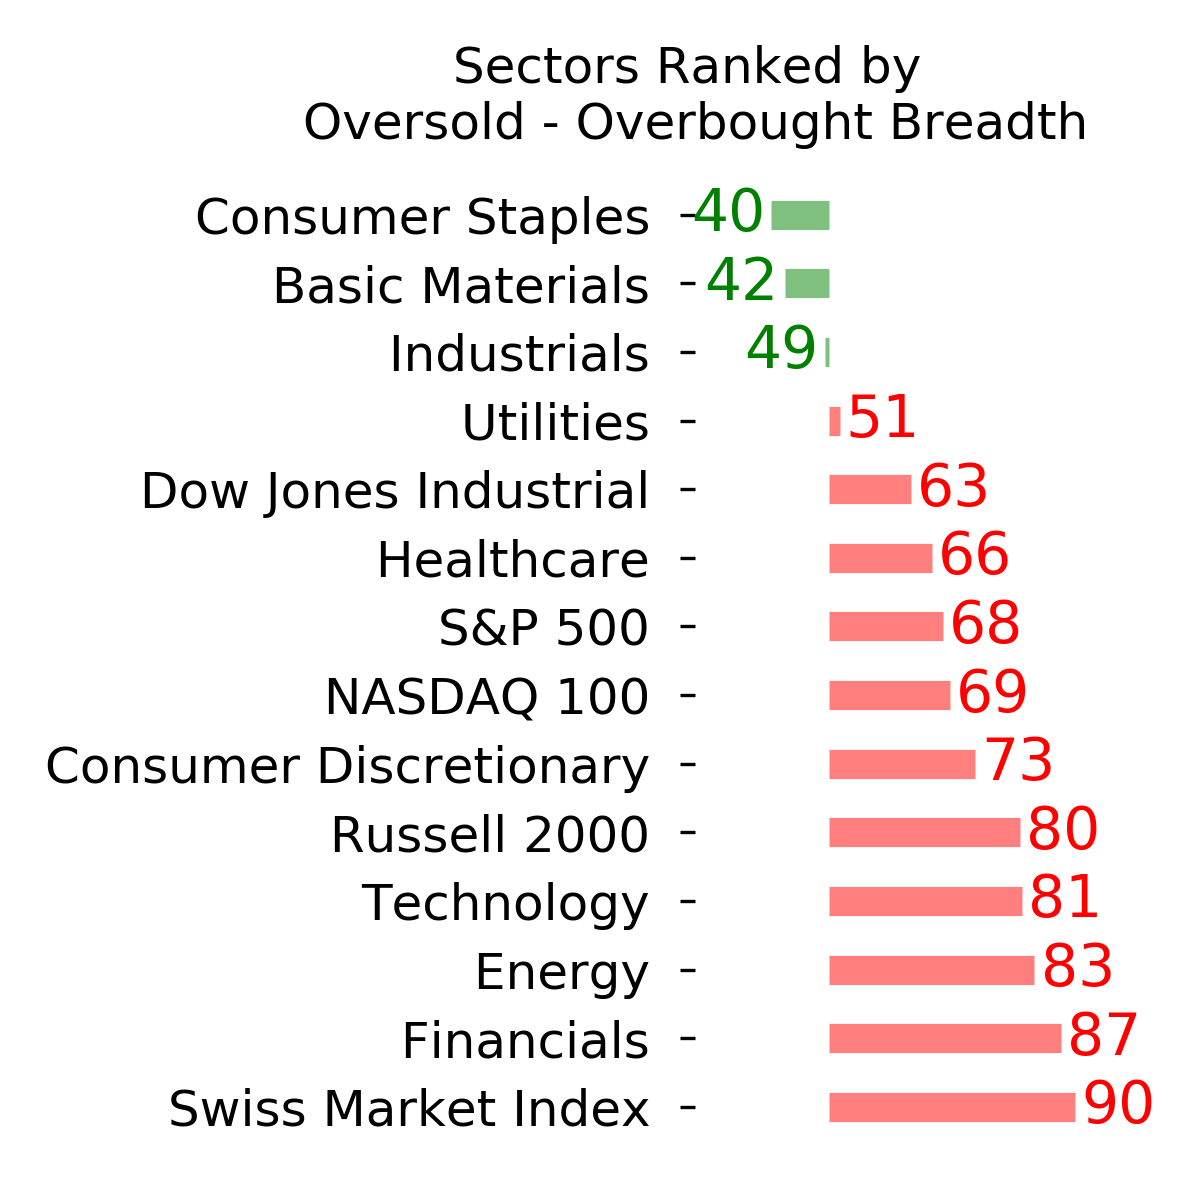
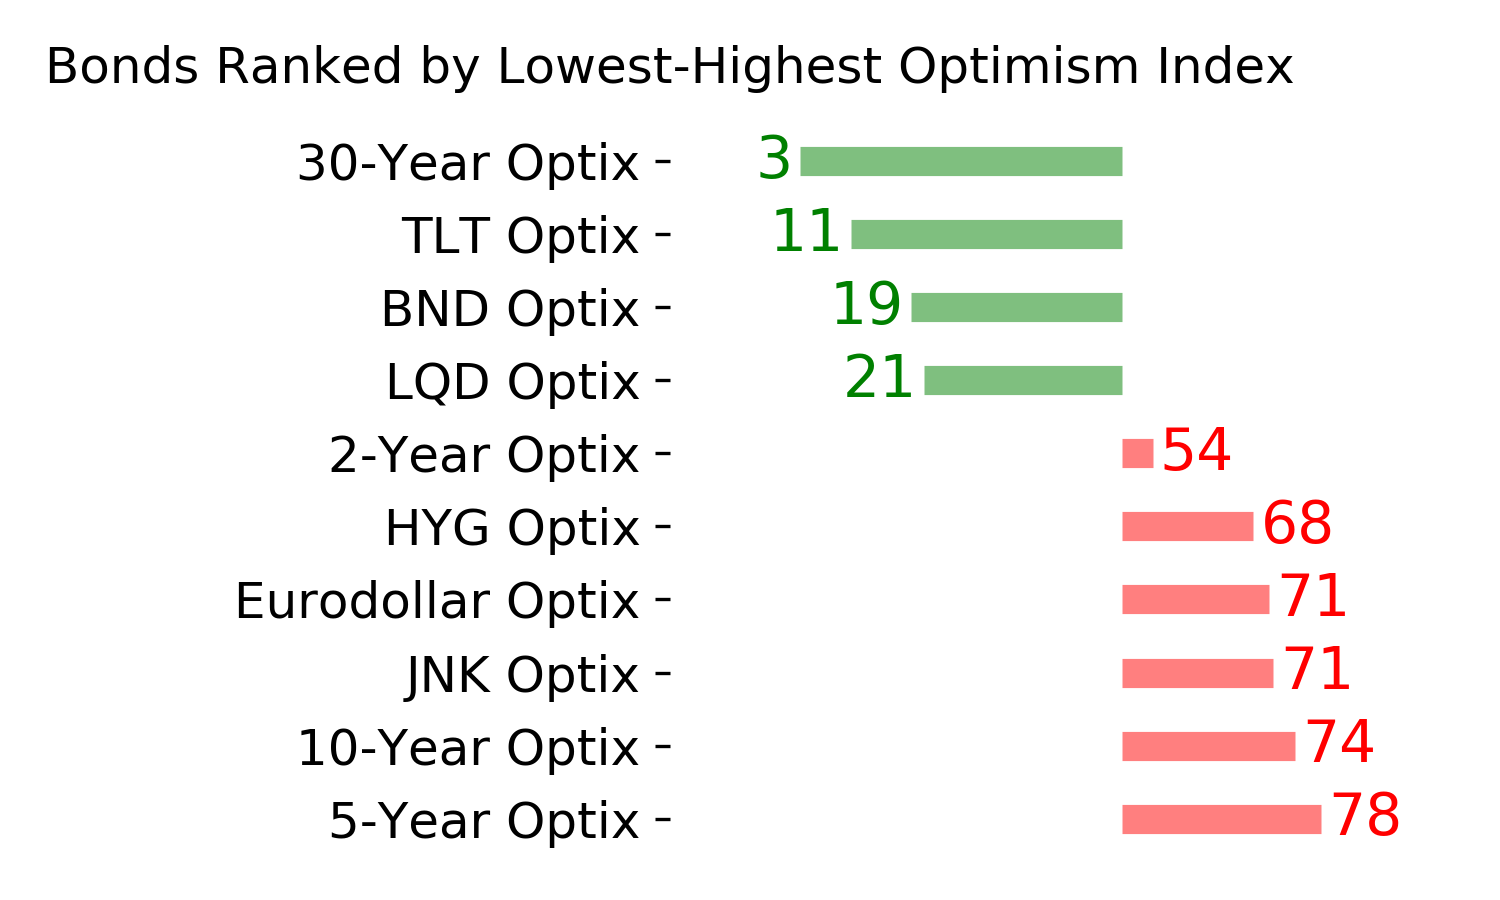
Ranks
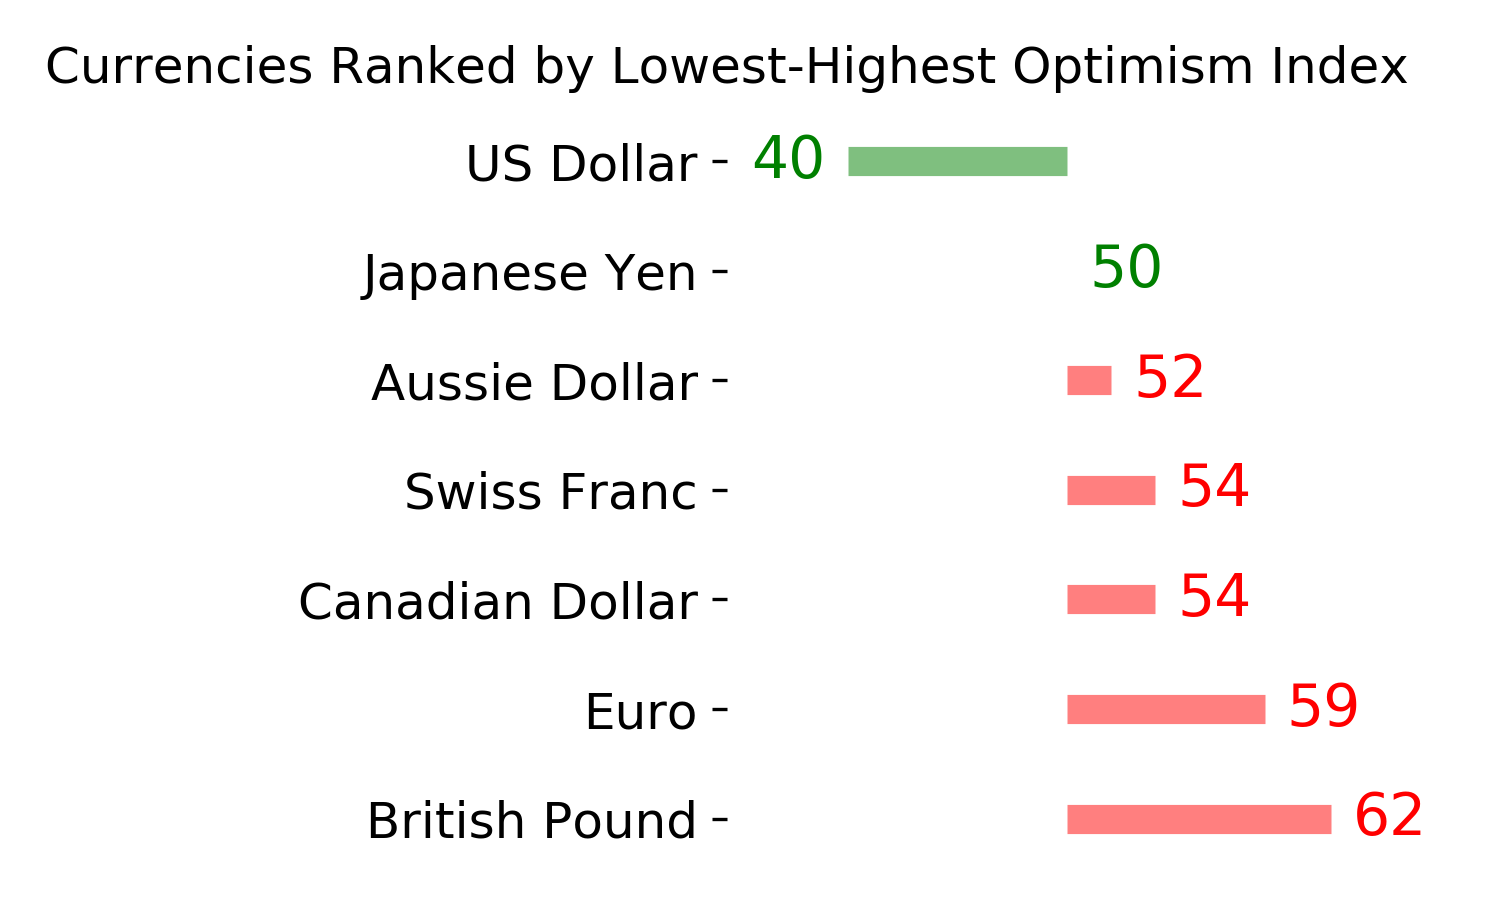
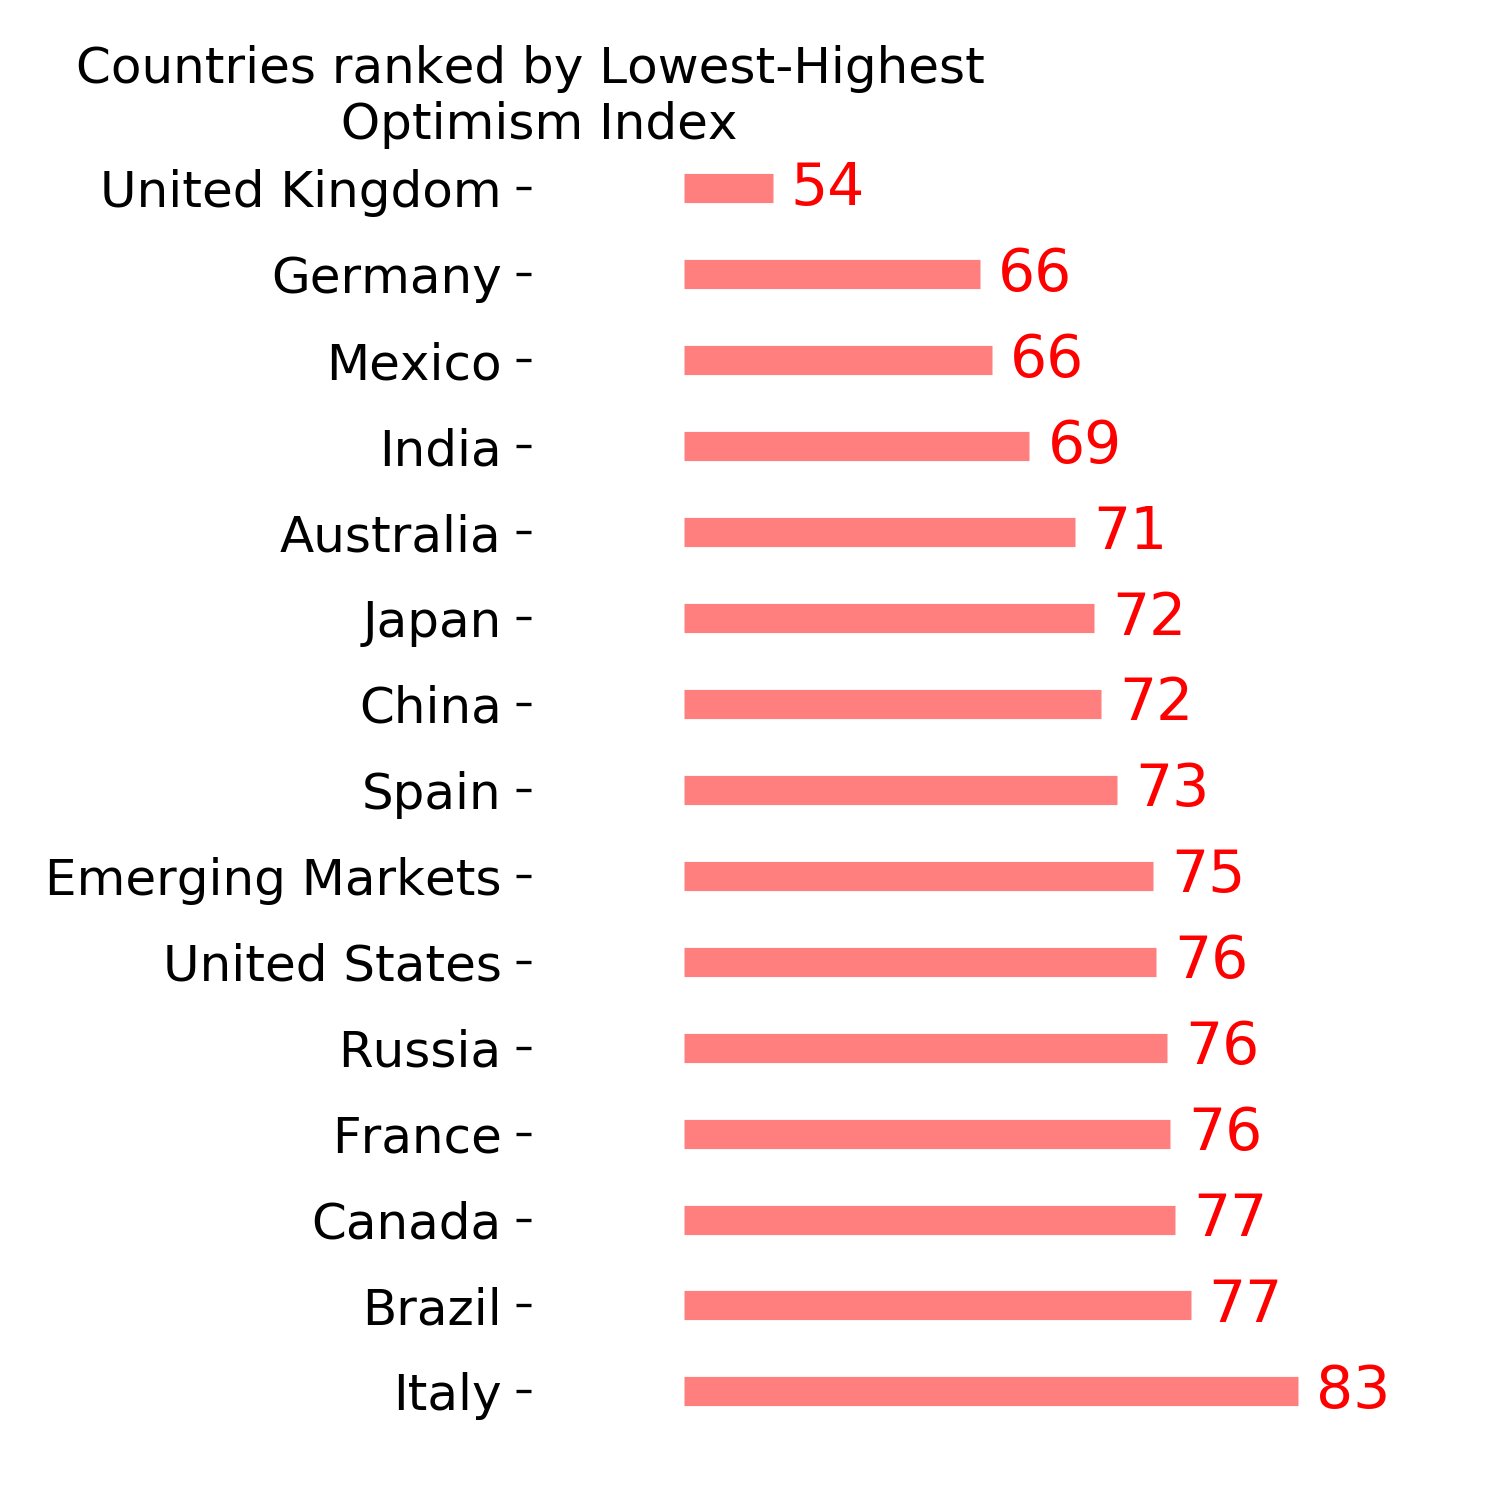
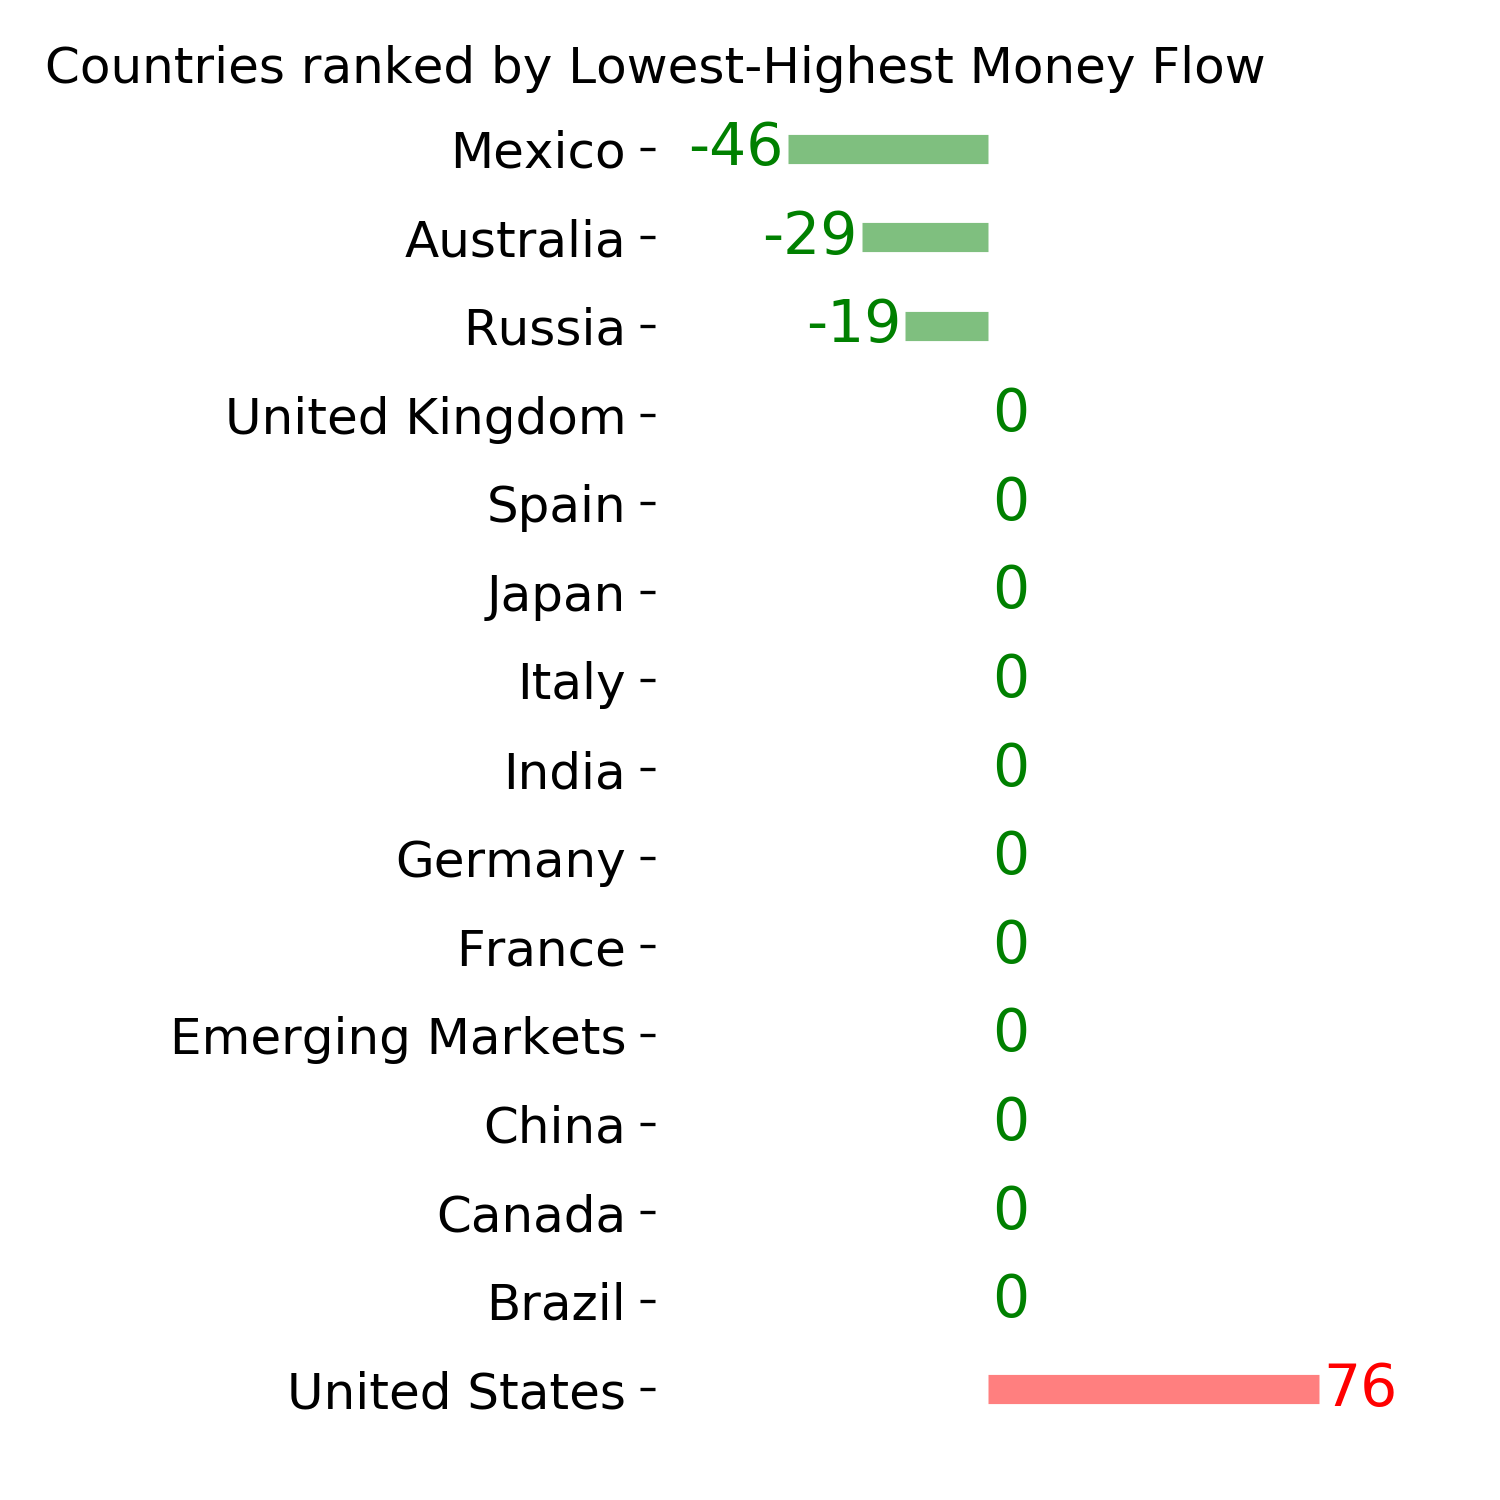
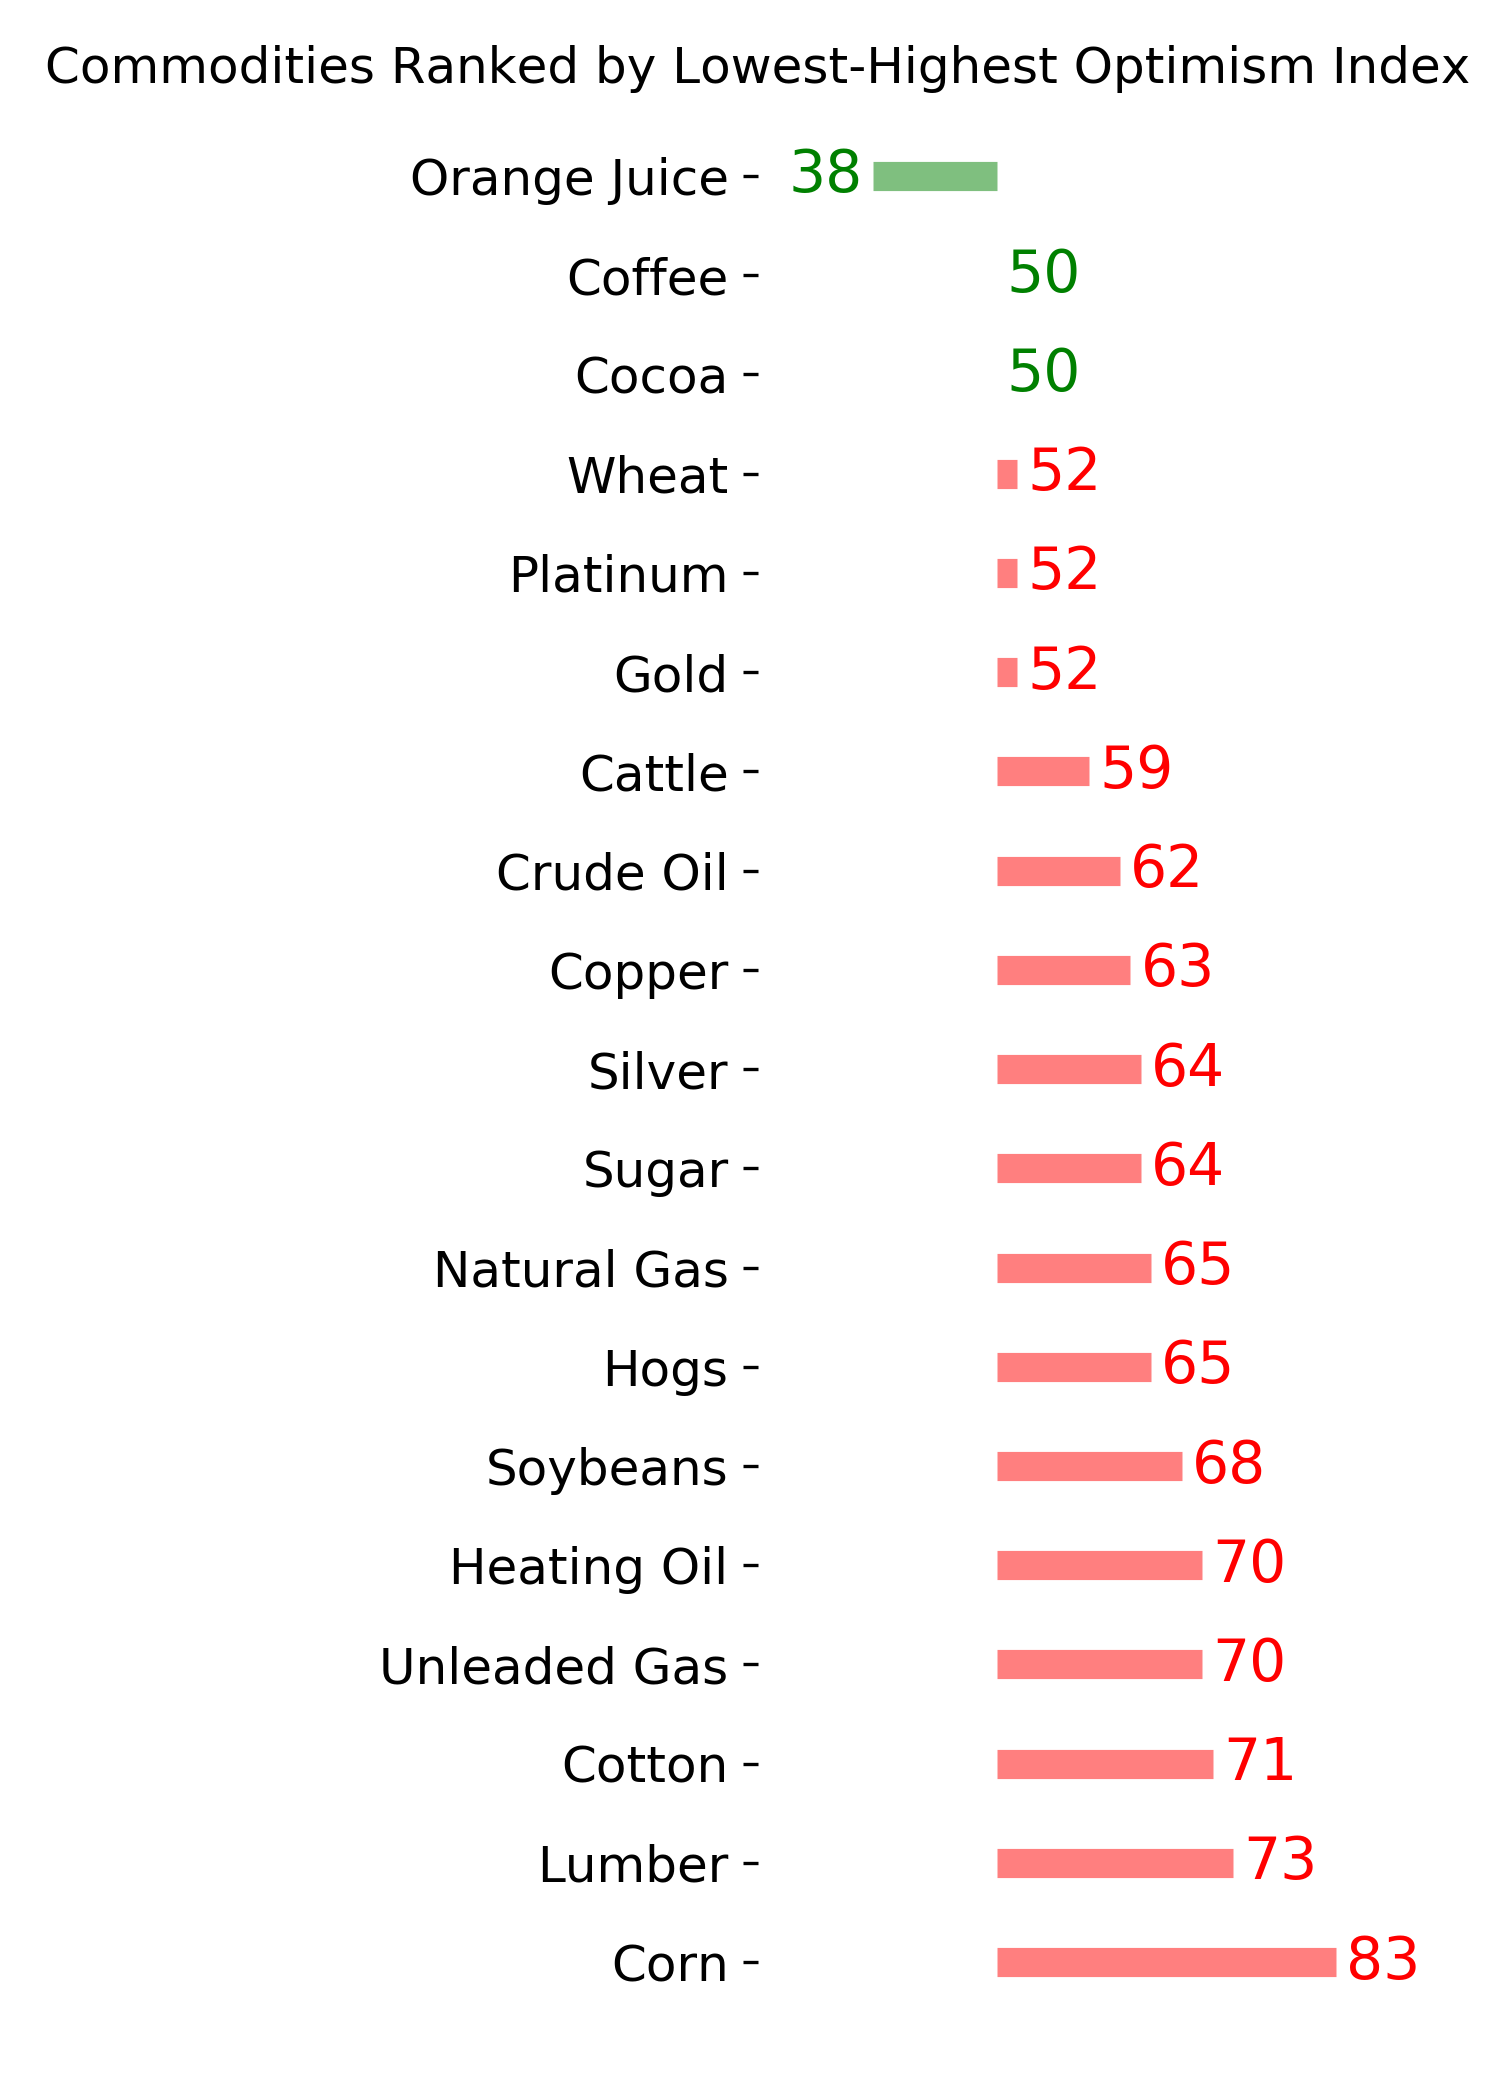
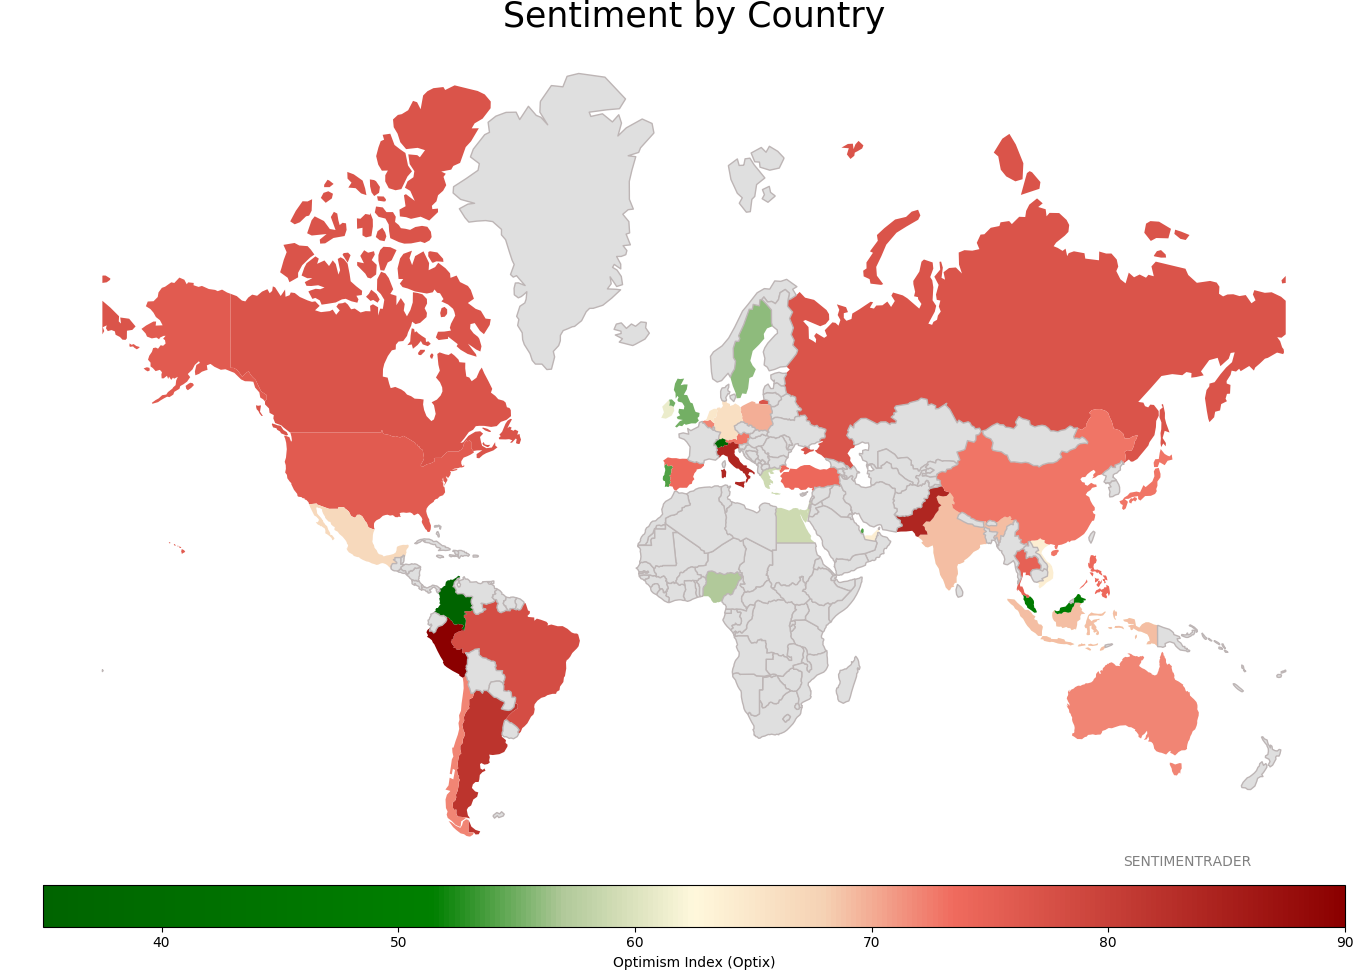
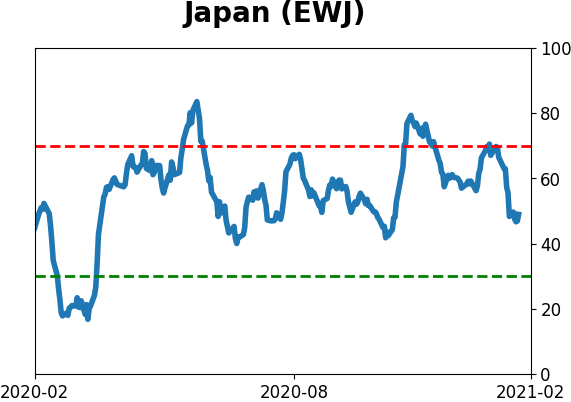
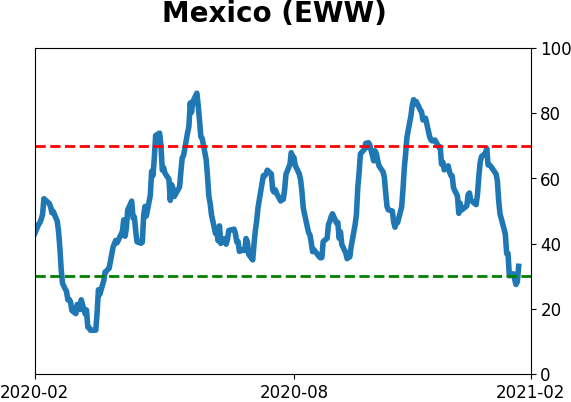
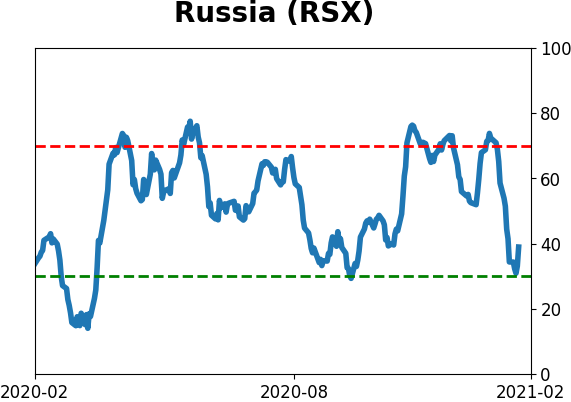
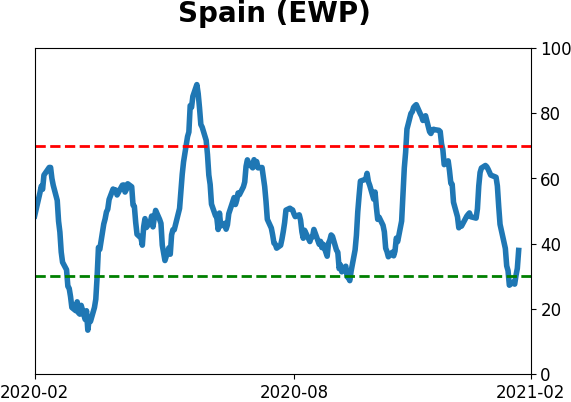
Sentiment Around The World
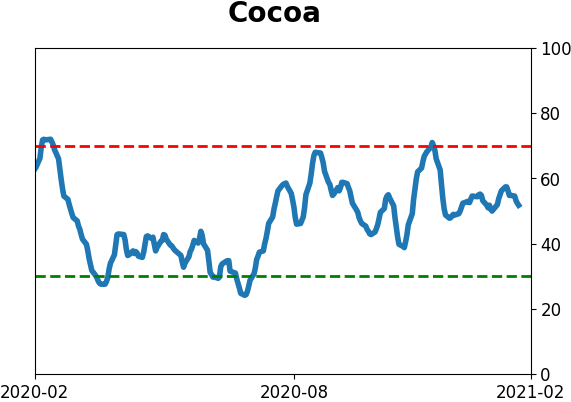
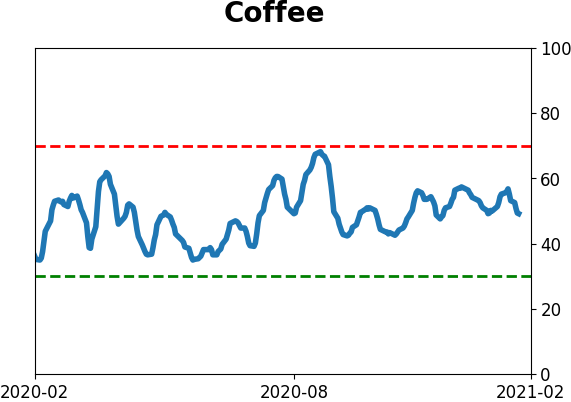
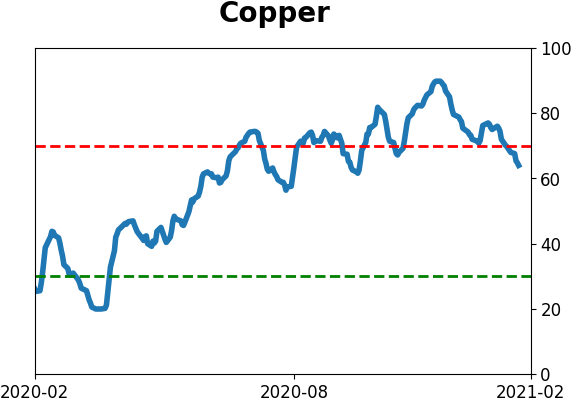
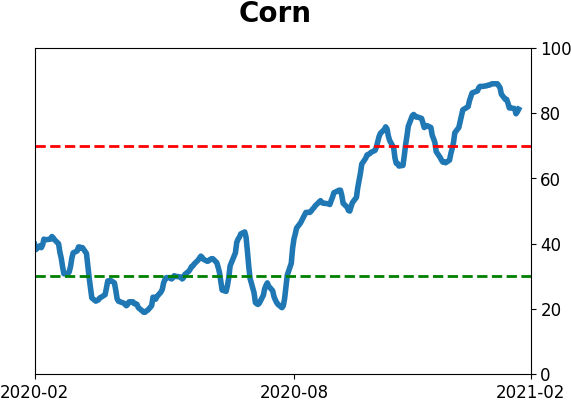
Optimism Index Thumbnails
|
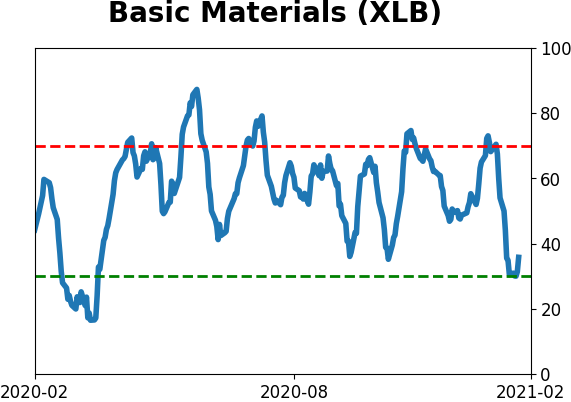
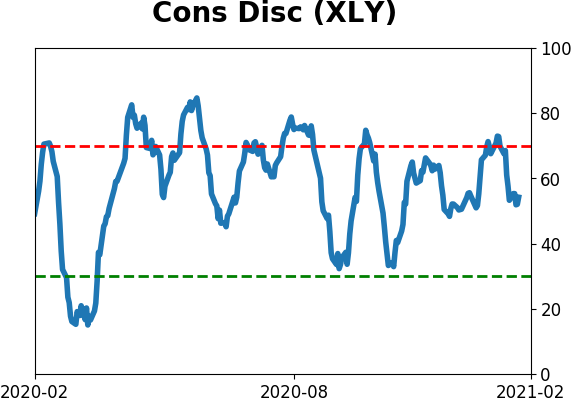
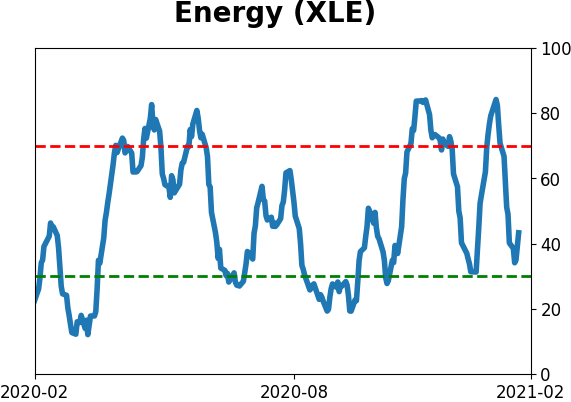
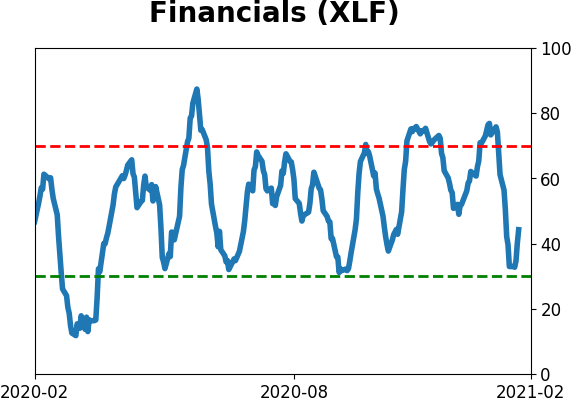
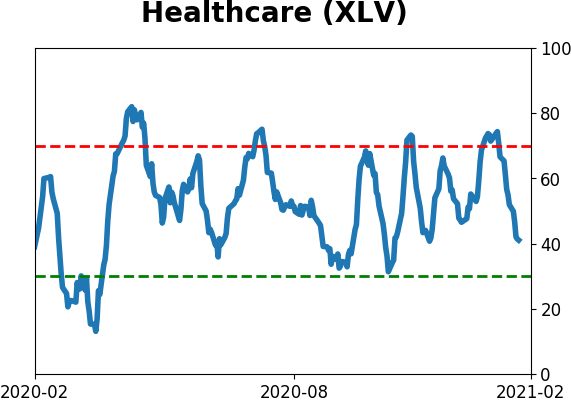
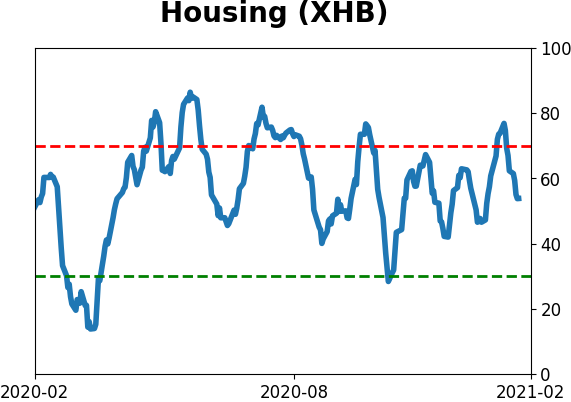
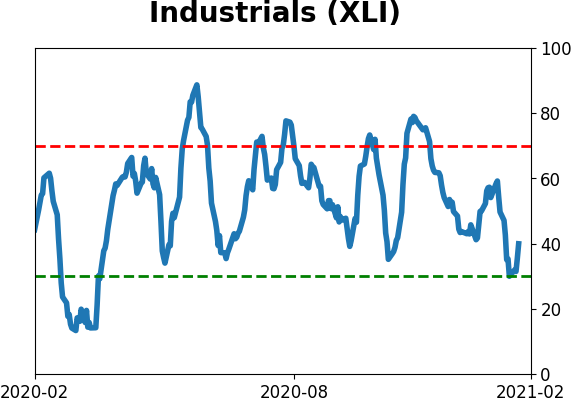
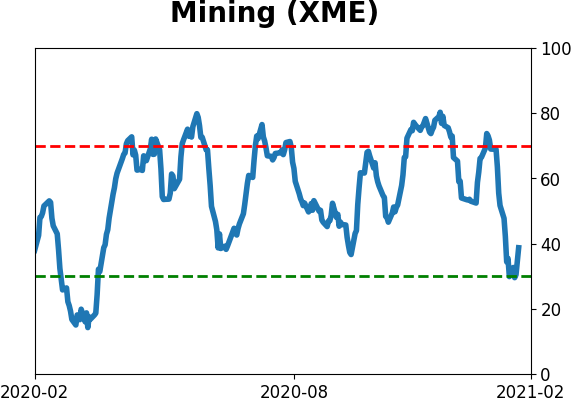
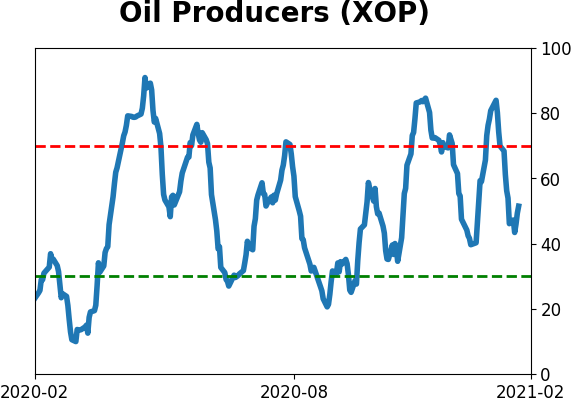
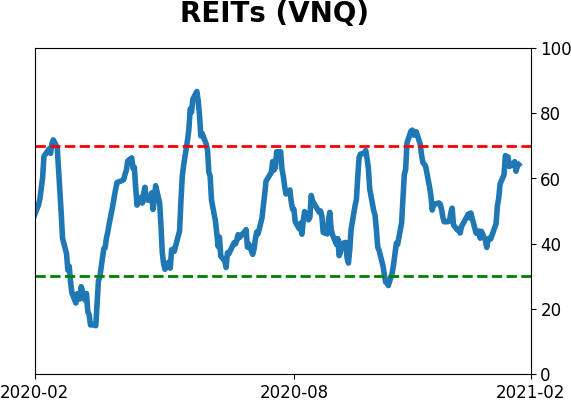
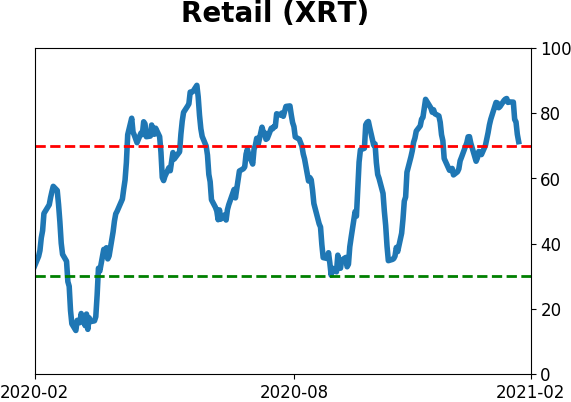
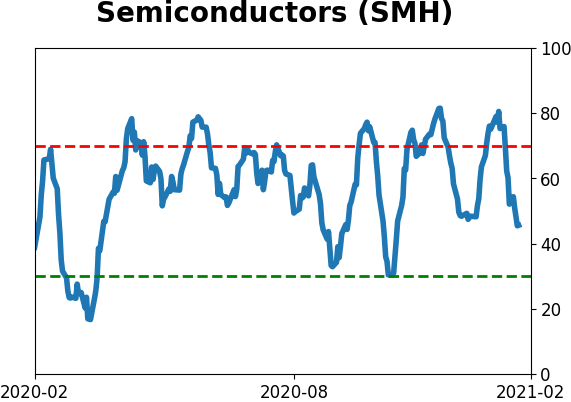
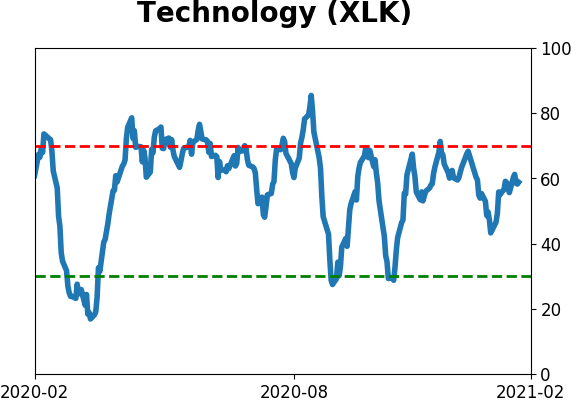
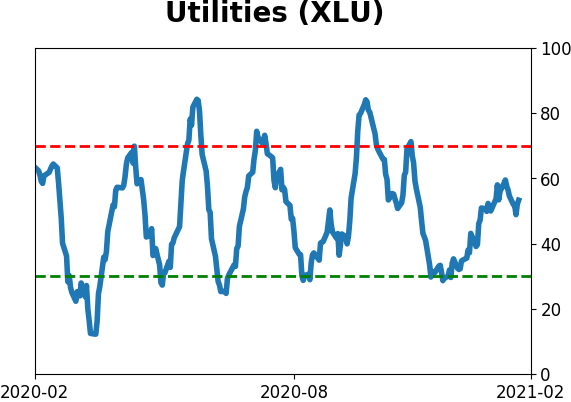
Sector ETF's - 10-Day Moving Average
|
|
|
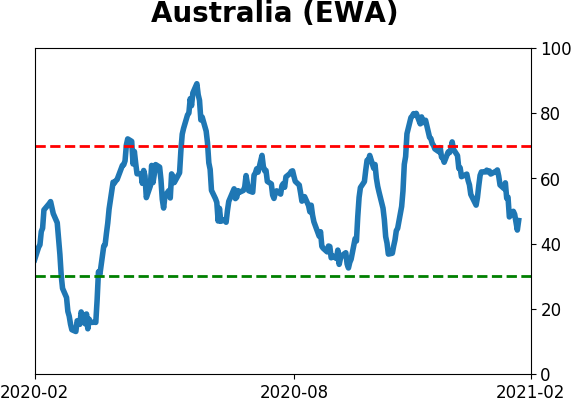
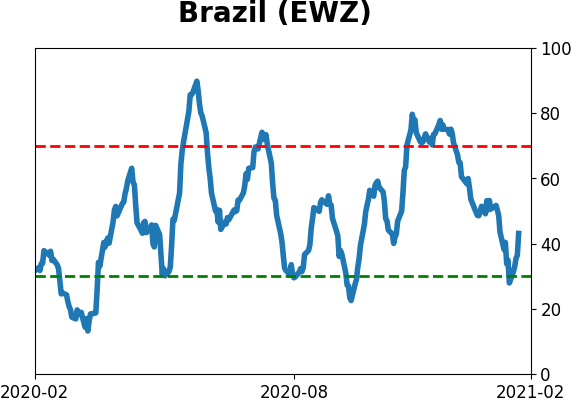
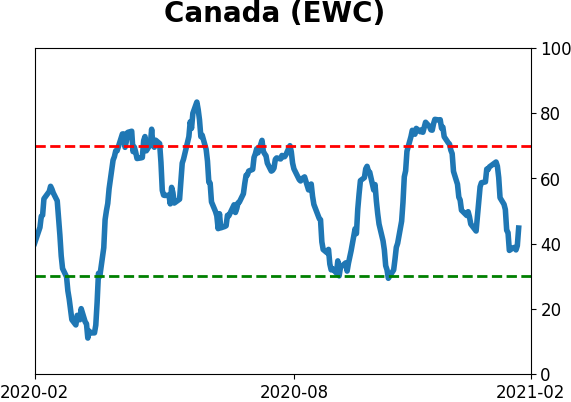
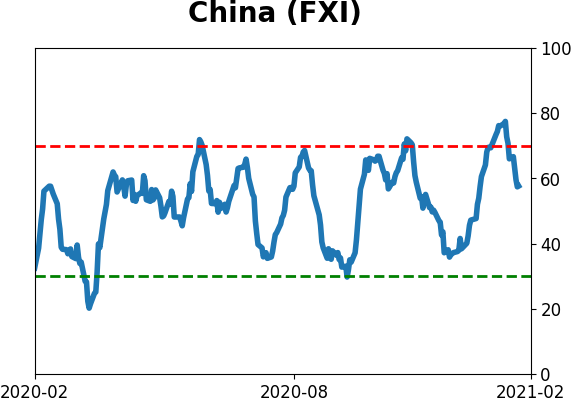
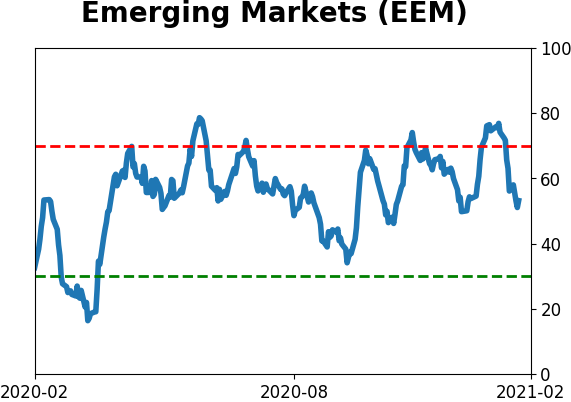
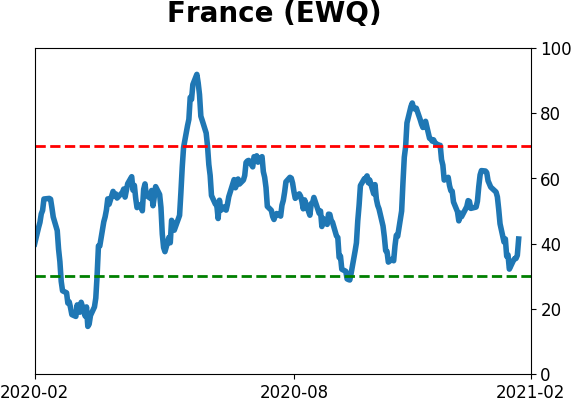
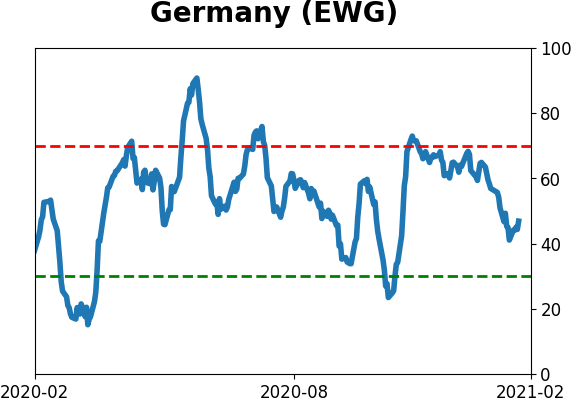
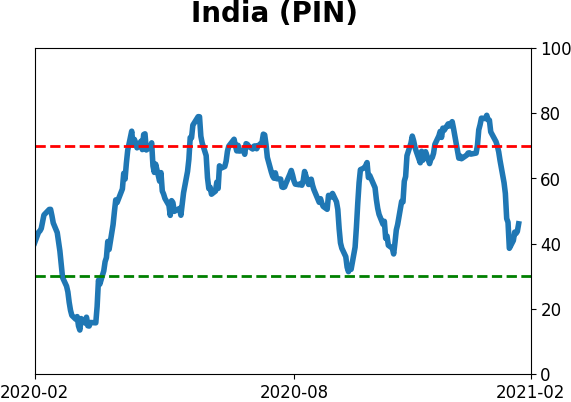
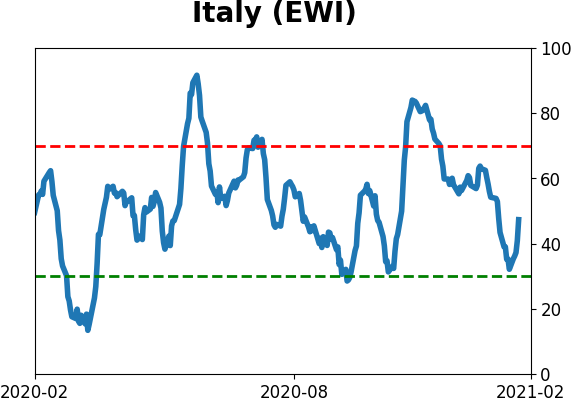
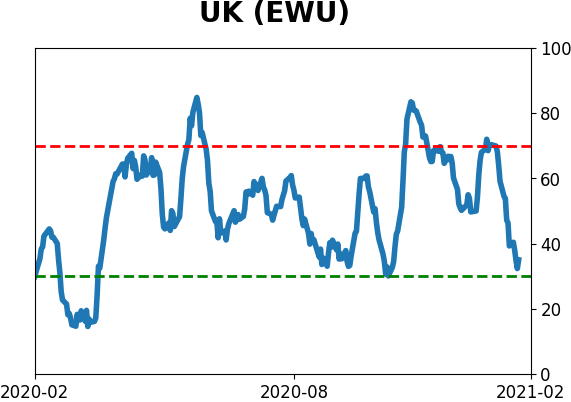
Country ETF's - 10-Day Moving Average
|
|
|
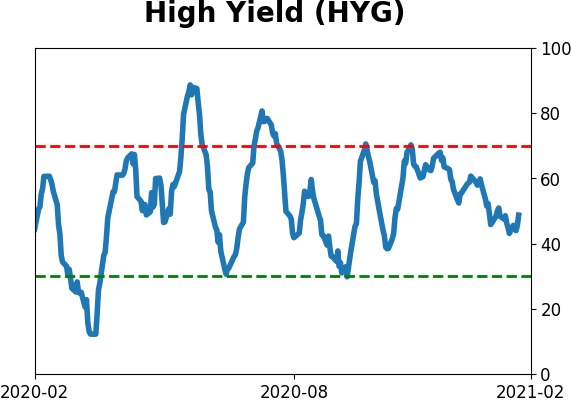
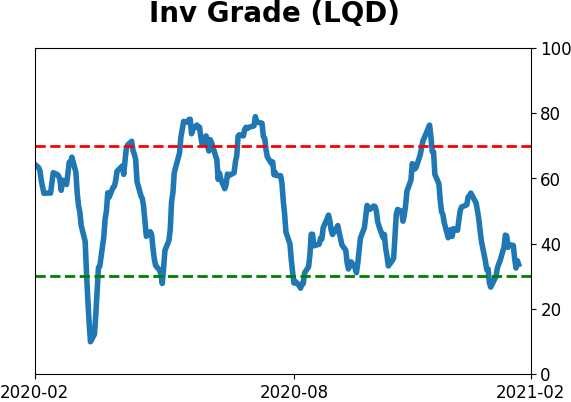
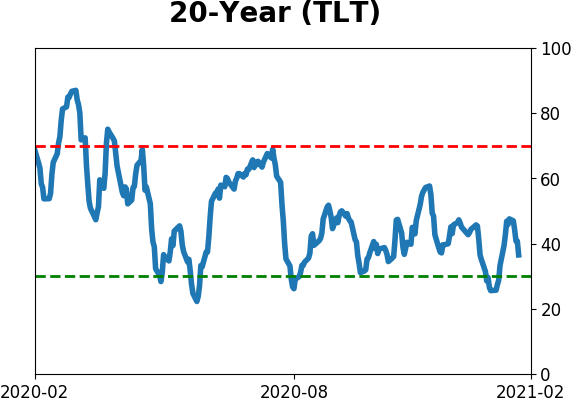
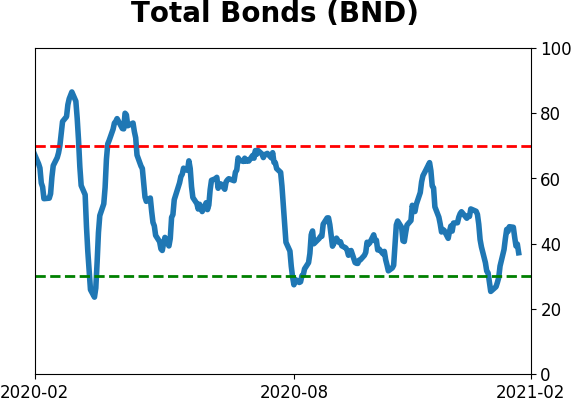
Bond ETF's - 10-Day Moving Average
|
|
|
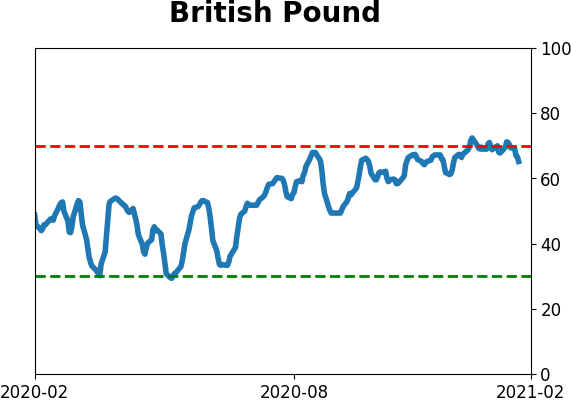
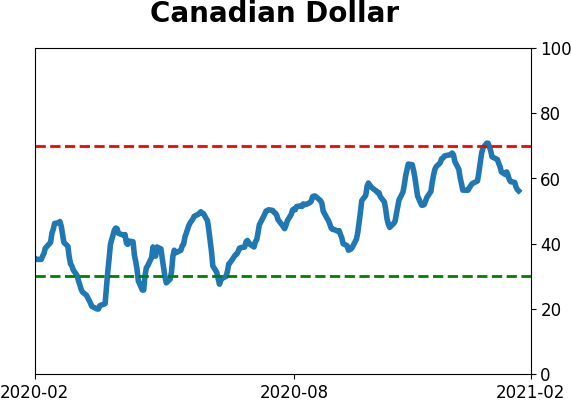
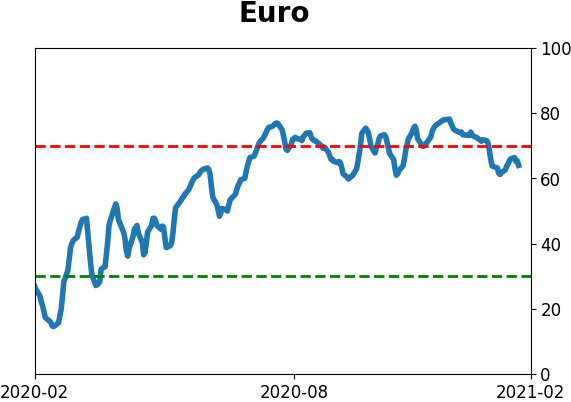
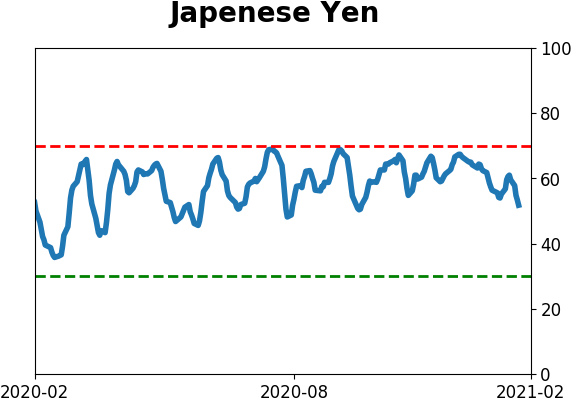
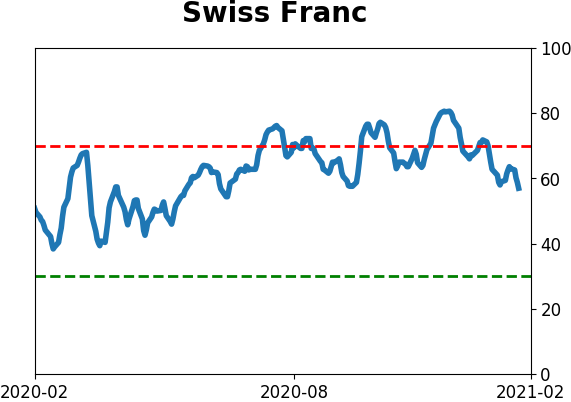
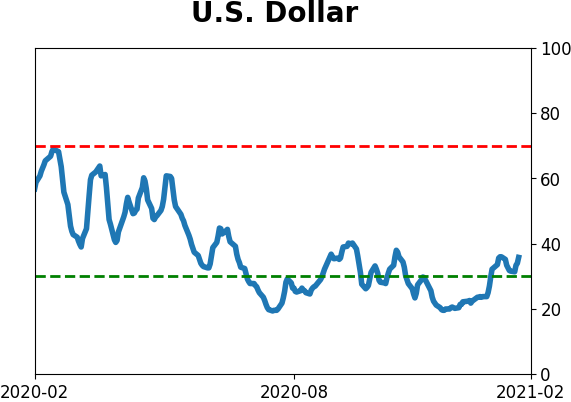
Currency ETF's - 5-Day Moving Average
|
|
|
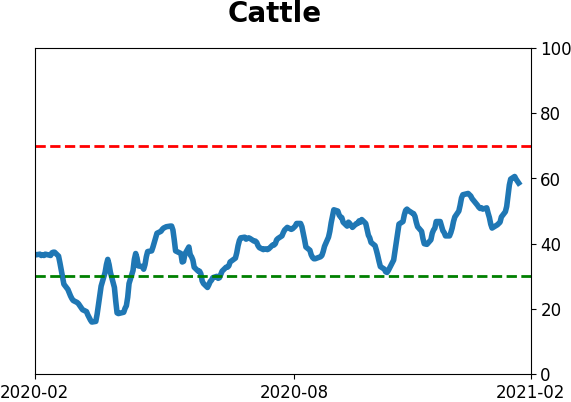
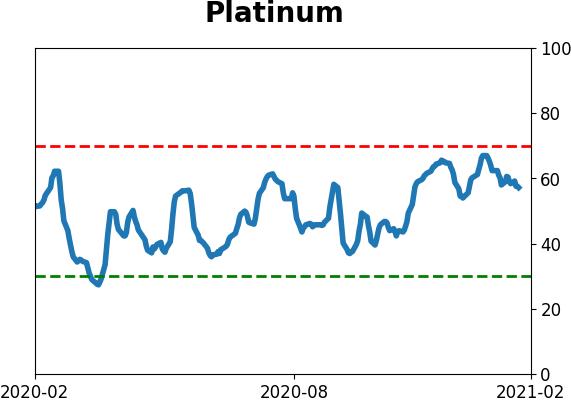
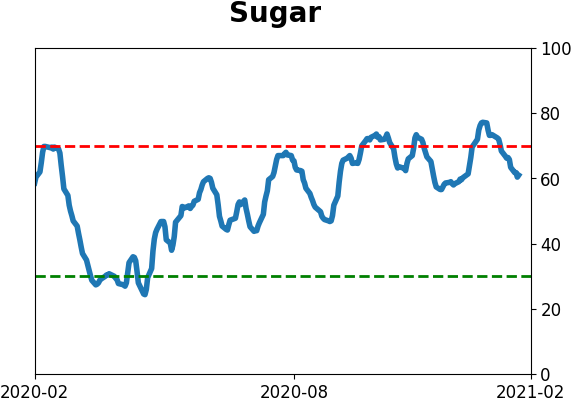
Commodity ETF's - 5-Day Moving Average
|
|