Headlines
|
|
A low short base just when markets need it most:
Across the S&P 500 and other indexes, there is a decades-low percentage of shares sold short. That lack of skepticism comes just as there is a decades-long high in the percentage of companies that are losing money.
Bottom Line:
See the Outlook & Allocations page for more details on these summaries STOCKS: Weak sell
We're in an extremely speculative environment that is enough to become defensive, especially with recent cracks showing in what had been pristine breadth conditions. The spike in fear from last week has already mostly dissipated and likely not enough to offset the negatives over a medium-term time frame. BONDS: Weak buy
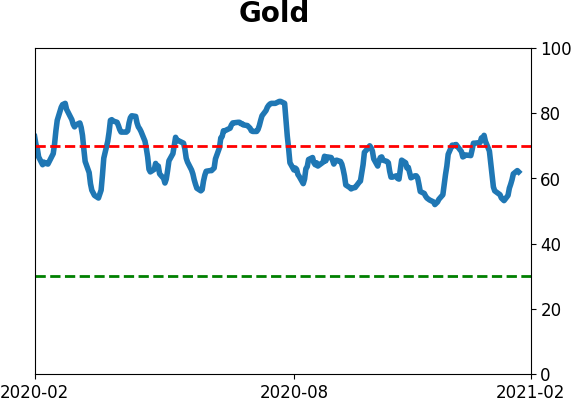
Various parts of the market have been hit in recent weeks, with mild oversold conditions that have started to reverse. GOLD: Weak buy
A dollar trying to rebound from a severe short position has weighed on gold and miners. The types of signals they've given in recent weeks, within the context of their recent surge, have usually resulted in higher prices.
|
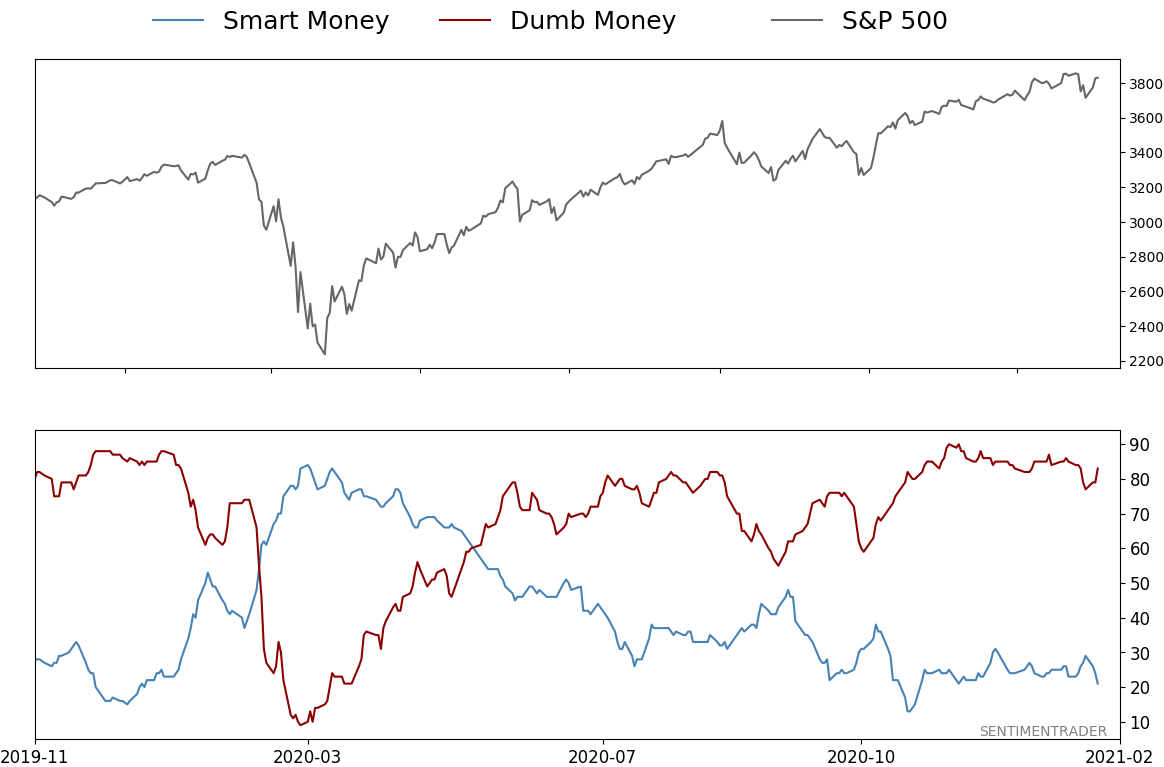
Smart / Dumb Money Confidence
|
Smart Money Confidence: 21%
Dumb Money Confidence: 83%
|
|
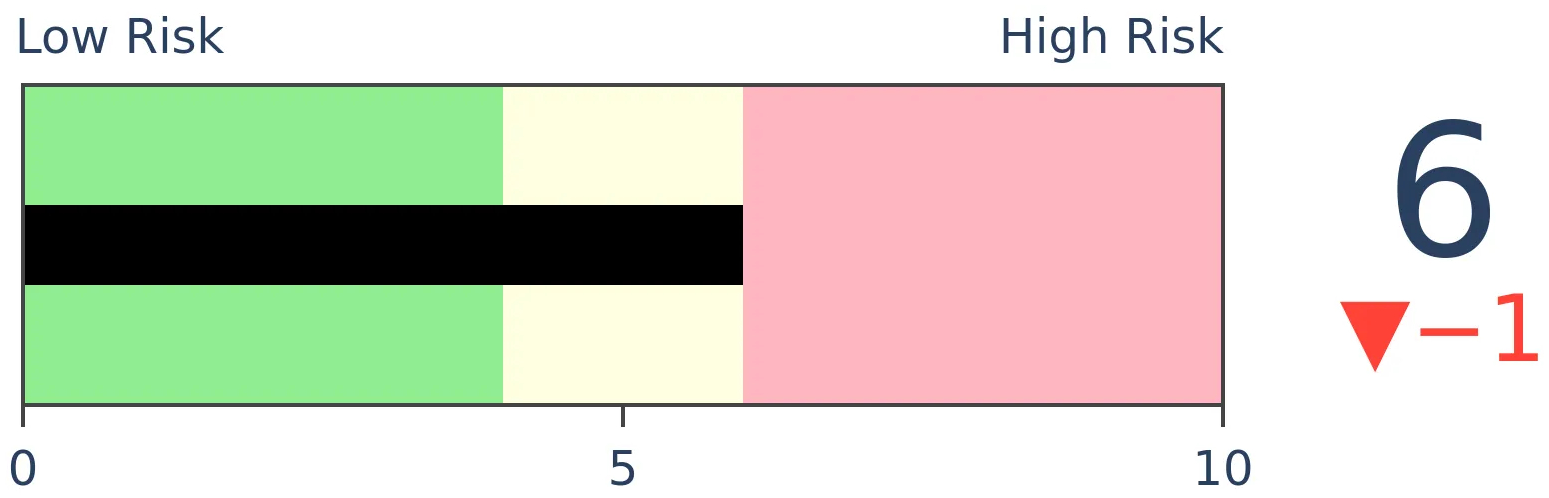
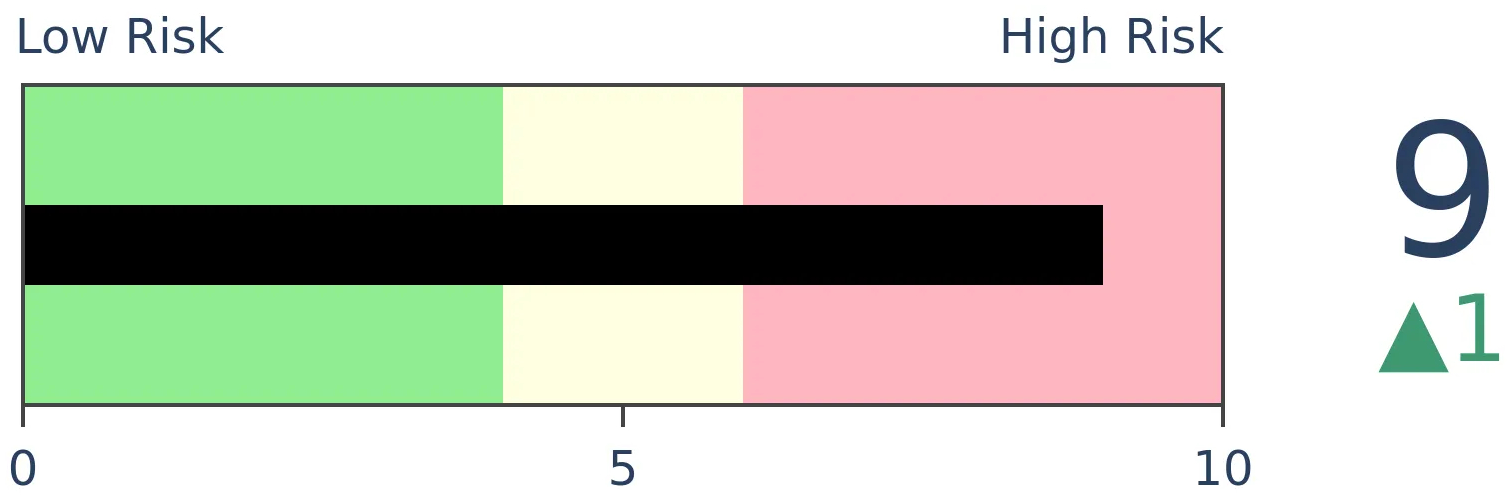
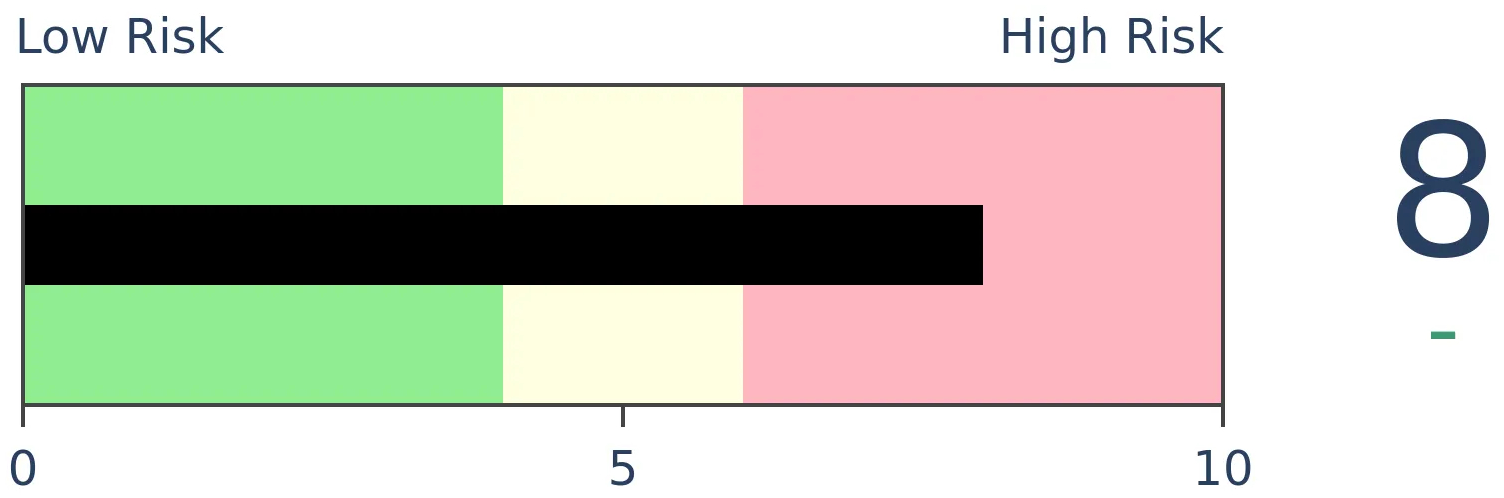
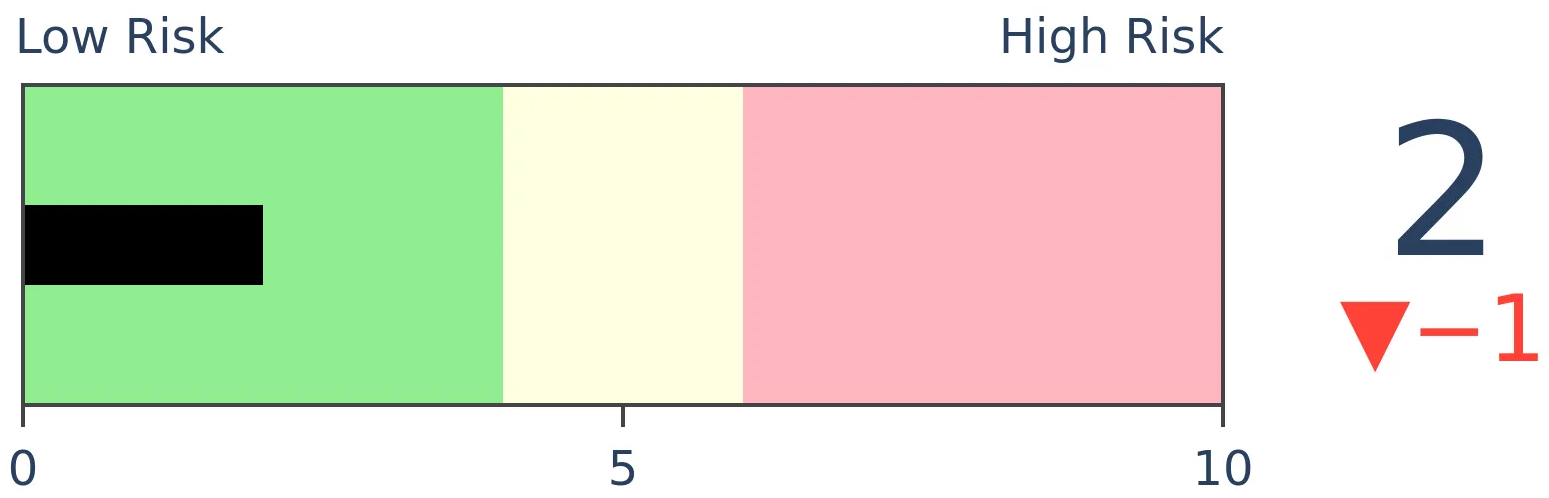
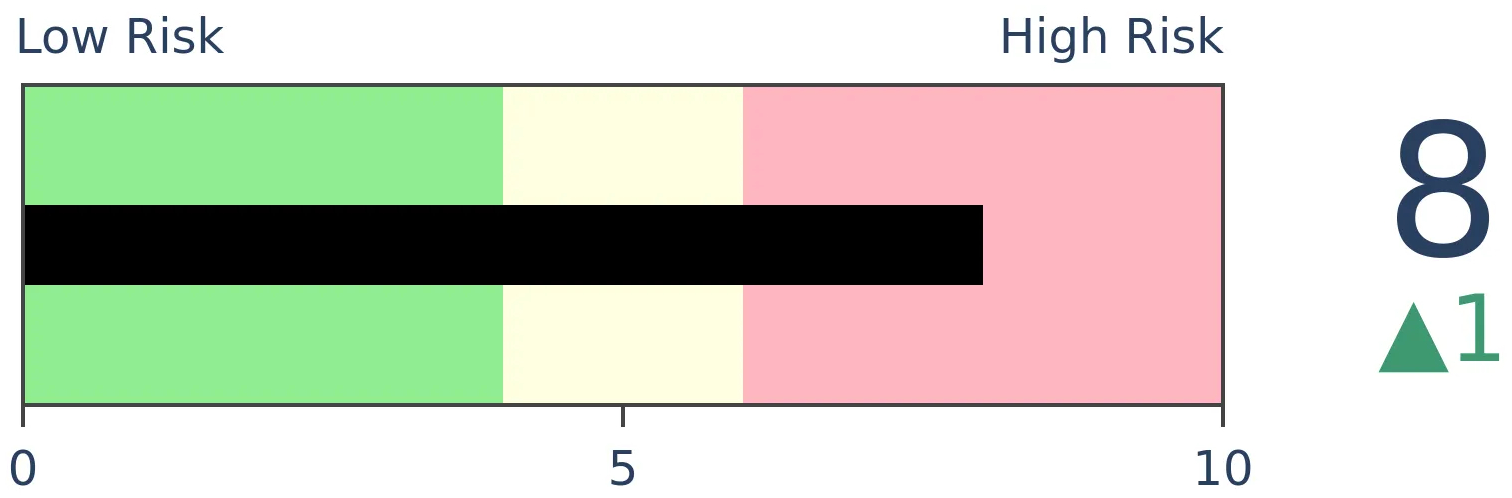
Risk Levels
Stocks Short-Term
|
Stocks Medium-Term
|
|
Bonds

|
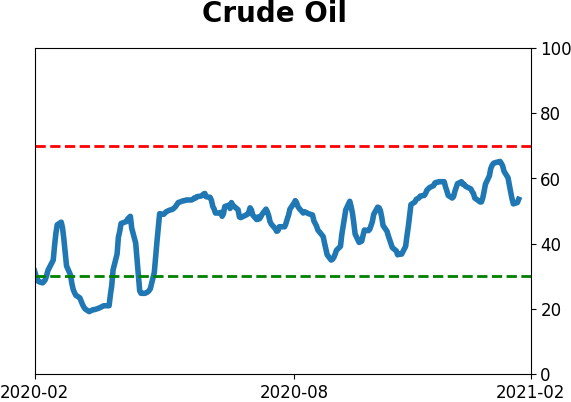
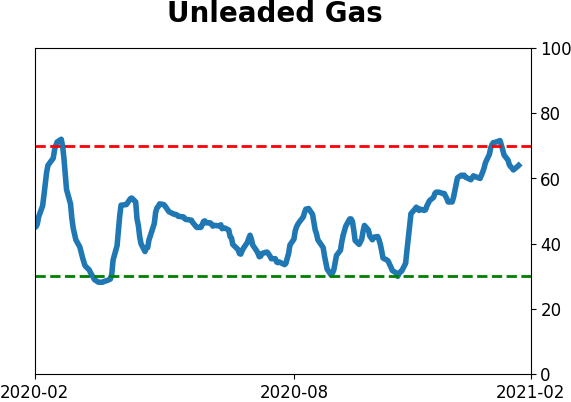
Crude Oil
|
|
Gold
|
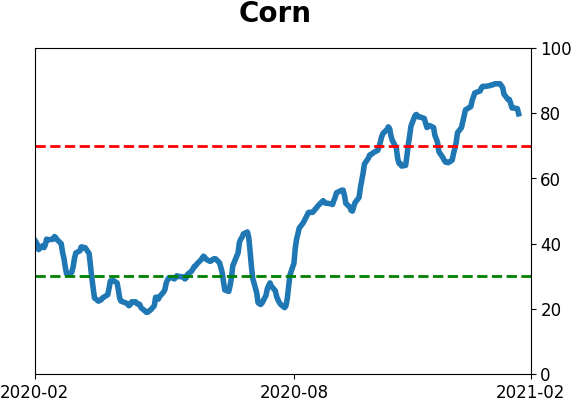
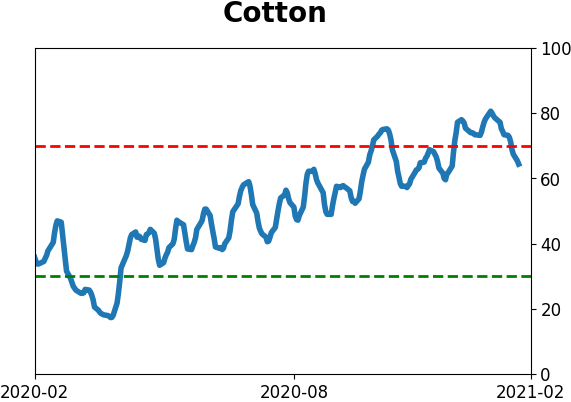
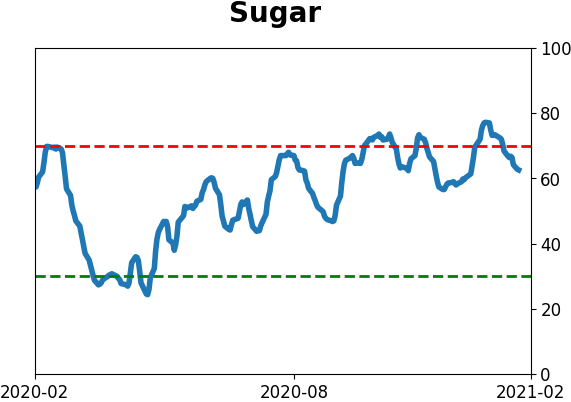
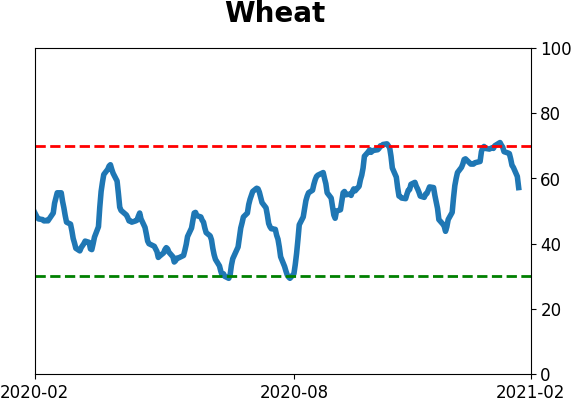
Agriculture
|
|
Research
BOTTOM LINE
Across the S&P 500 and other indexes, there is a decades-low percentage of shares sold short. That lack of skepticism comes just as there is a decades-long high in the percentage of companies that are losing money.
FORECAST / TIMEFRAME
SPY -- Down, Long-Term
|
The big topic over the past week has been short interest. By the sounds of mainstream media, there's a massive build-up of shares that greedy hedge funds have borrowed and sold, hoping to buy them back later at a lower price.
As usual, it's uninformed hyperbole. Short sellers provide an invaluable service to the investment world, and in any case, their thesis is completely wrong. In some stocks, there surely had been a huge build in the number of shares sold short. In the average stock, not so much.
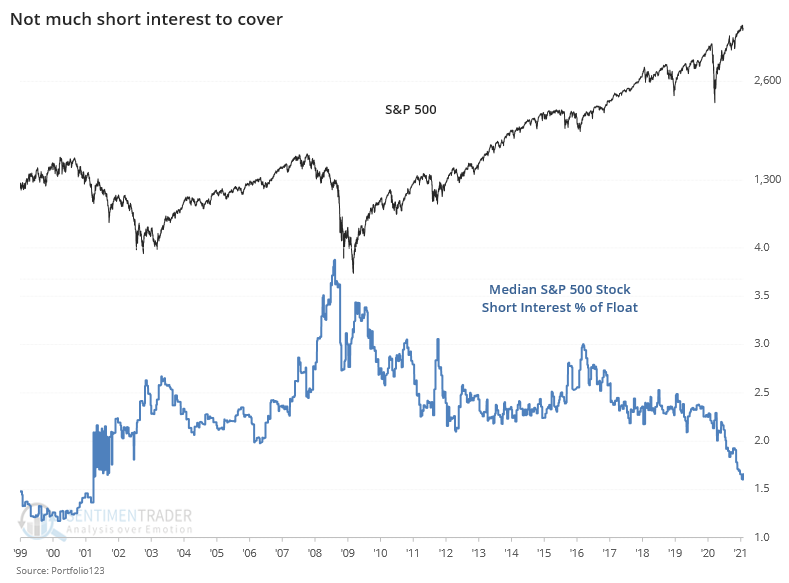
The median stock in the S&P 500 has only 1.6% of its float sold short, the lowest amount since 2001.
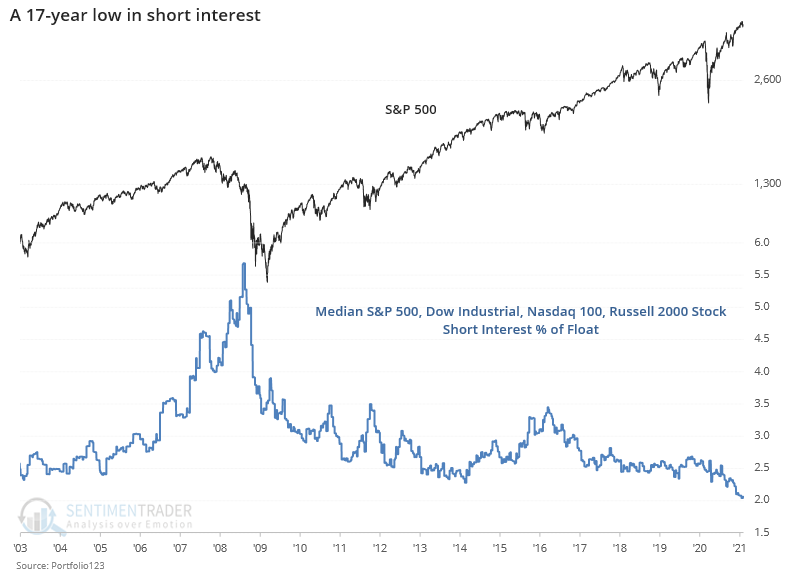
It's not just the large-caps in the S&P, though. The average stock across the S&P, Dow Industrials, Nasdaq 100, and Russell 2000 has just over 2% of its float sold short, a 17-year low.
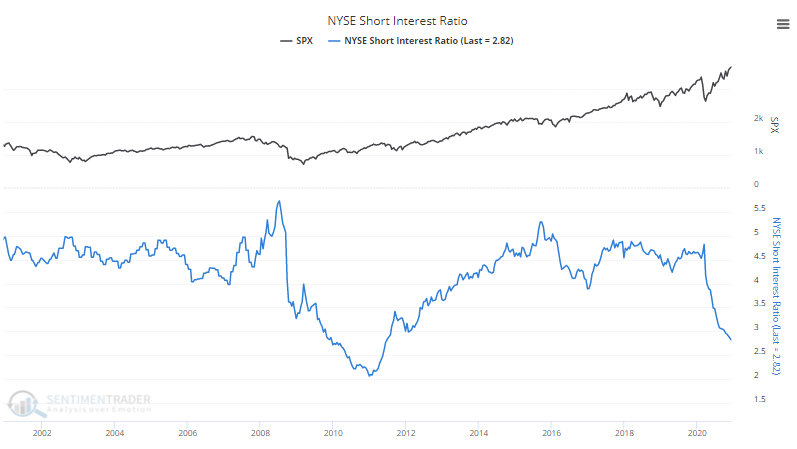
Across the broad NYSE universe, the Short Interest Ratio is near the lowest level in 20 years. Same for the Nasdaq exchange.
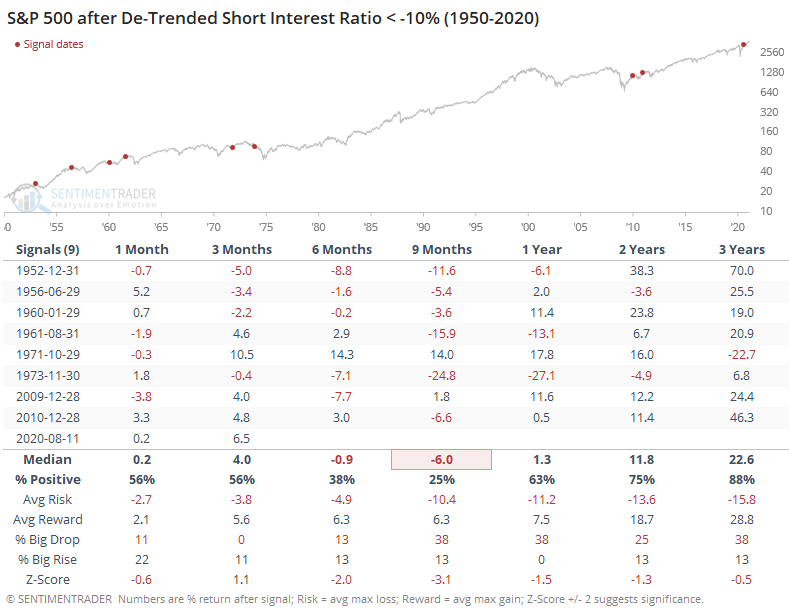
The De-Trended Short Interest Ratio is at its lowest level in a decade. This takes the current reading and compares it to its range over prior years, to give us a sense of relative extremes.
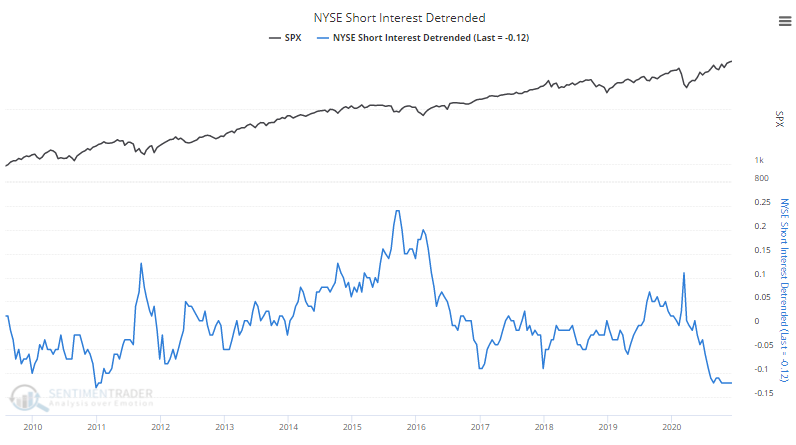
Even longer-term, it's nearing a record low.
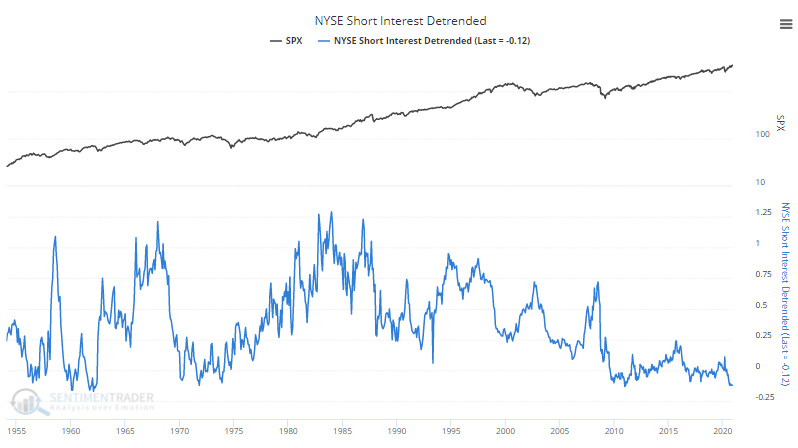
It's been this low only a few other times.
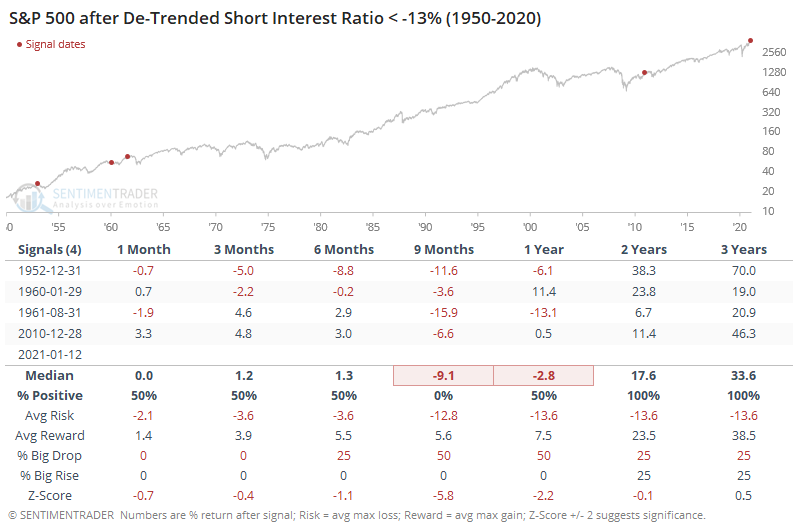
If we relax the parameters, then it triggered months ago, but prior instances tended to see muted returns up to 9 months later.
One of the main benefits of a healthy base of investors willing to sell short is that it helps to keep companies honest. Instead of the rah-rah "Great quarter, guys" from many analysts whose firms have investment banking relationships, shorts cast a skeptical eye and are willing to ask tougher questions.
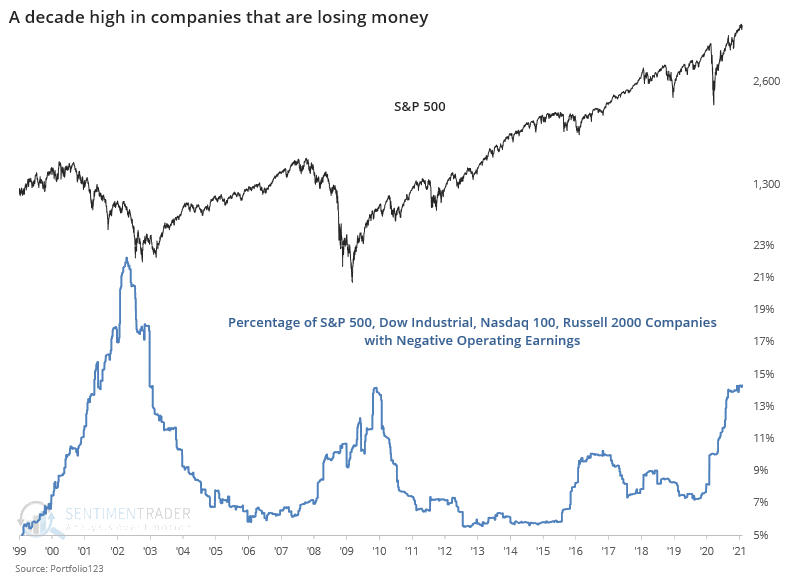
Perhaps it's never been more important. As companies emerge from the chaos of last spring, many of them are still losing money. More than 7% of firms within the S&P 500 are showing negative operating earnings over the past 12 months, the highest percentage in over a decade.
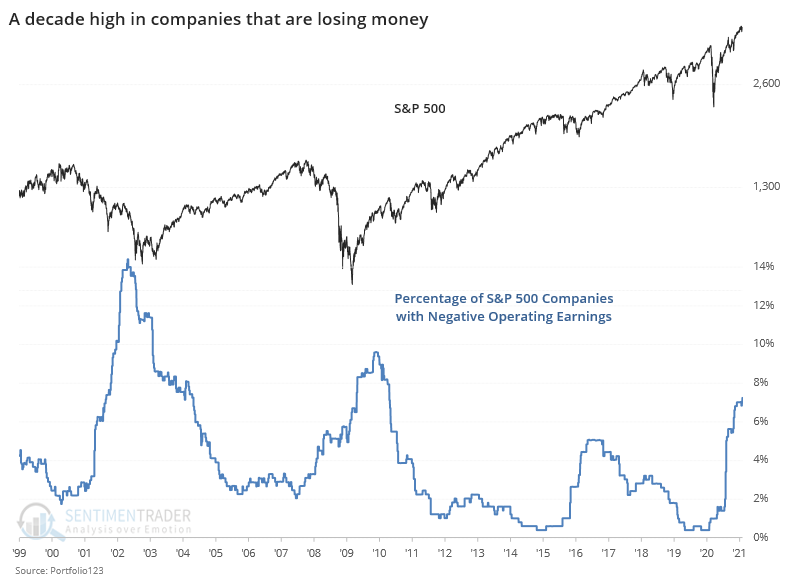
Again, it's not just those stocks. It's especially egregious in small-caps. Among companies in the Russell 2000, nearly 35% of them have not turned a profit, even as the index itself skyrocketed to one of its best rallies since its inception.
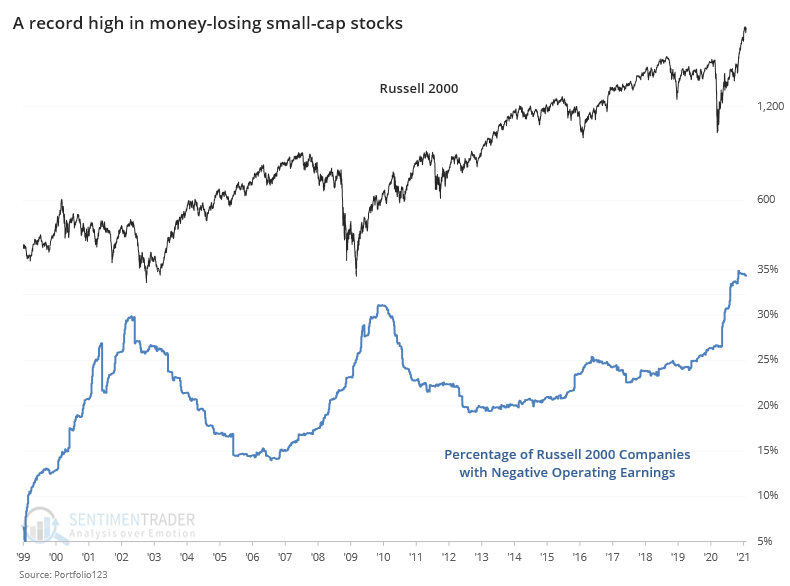
Across the S&P 500, Dow Industrials, Nasdaq 100, and Russell 2000, there is also a decade-high percentage in money-losing companies.
The worst offenders, of course, are the newest issues. We've discussed this repeatedly, and it bears mentioning again given the above. As of the end of 2020, about 80% of new issues did not turn a profit. Investors are willing to swallow a record amount of issuance, with the least discipline of possibly any time in history.
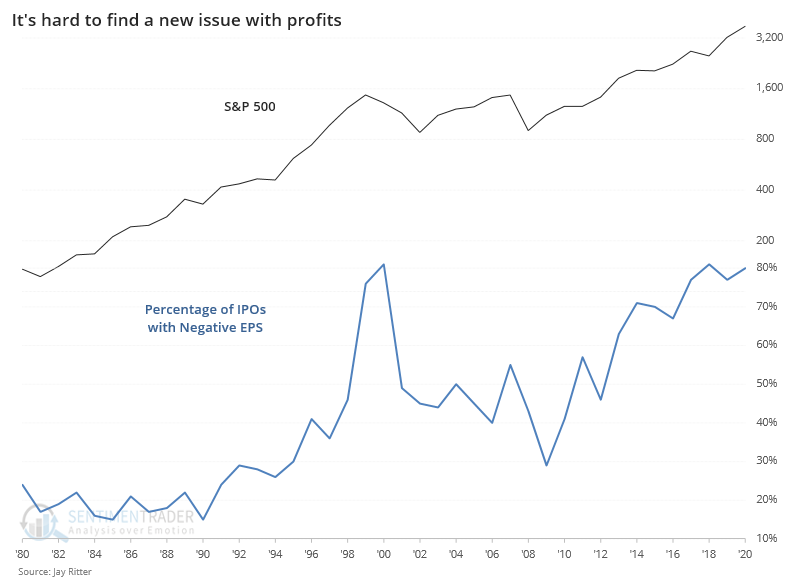
So, we have a situation with the most money-losing companies in a decade, with a market accepting of the lowest-quality issues ever, and a decades-low number of skeptical investors. This can go on for a while - at least weeks, possibly months, probably not years. Arguments could be made that history doesn't matter here given the fiscal/monetary environment. But it always seems like there's a regime change right around the time that the regime doesn't change.
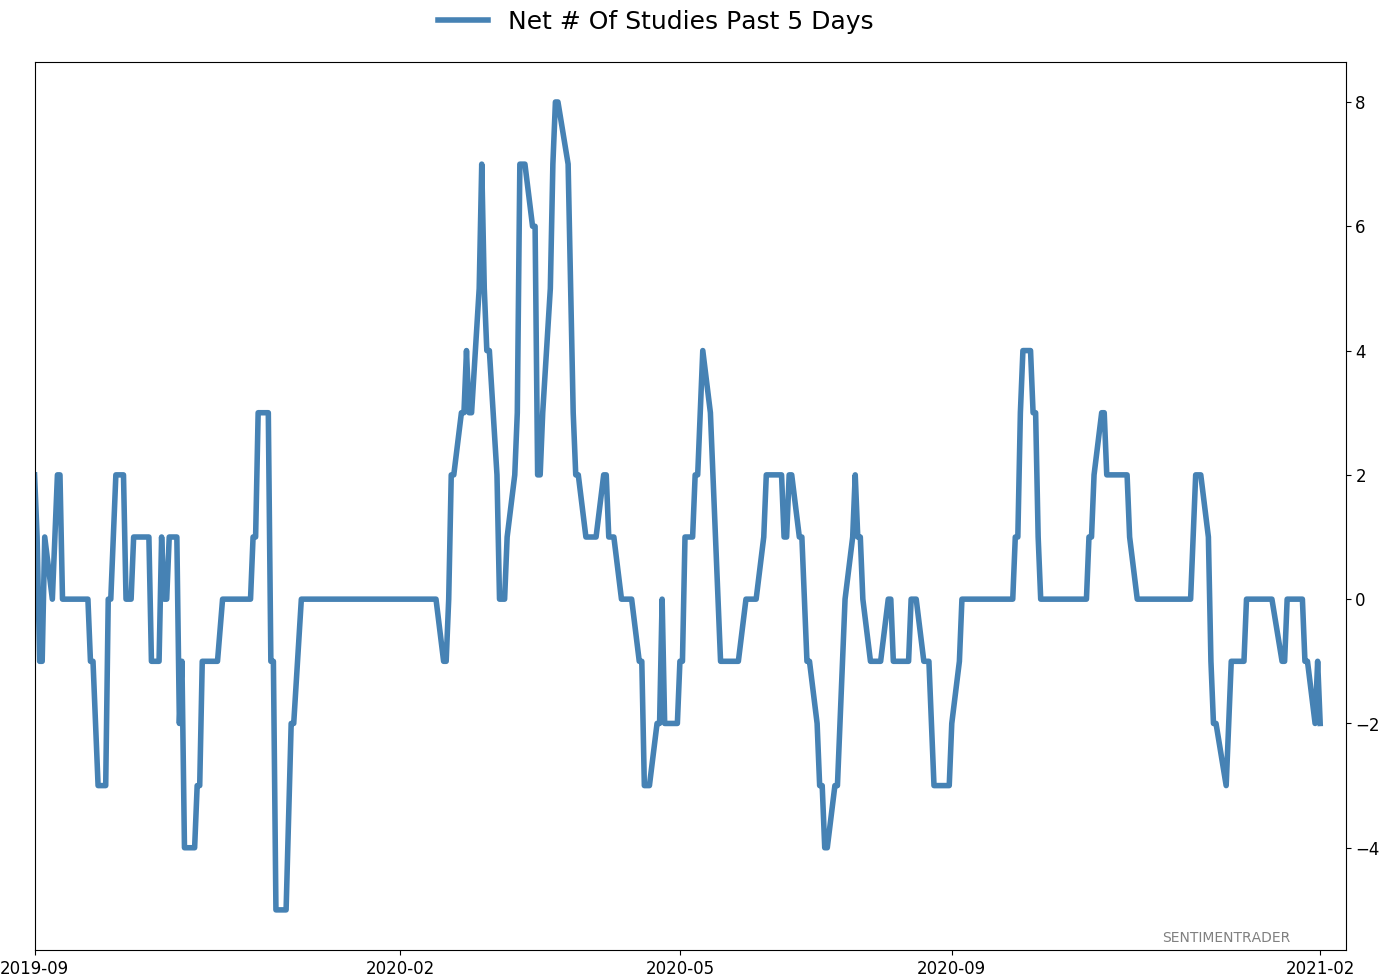
Active Studies
| Time Frame | Bullish | Bearish | | Short-Term | 0 | 0 | | Medium-Term | 2 | 4 | | Long-Term | 15 | 3 |
|
Indicators at Extremes
Portfolio
| Position | Description | Weight % | Added / Reduced | Date | | Stocks | 8.7% RSP | 8.7 | Reduced 28.8% | 2021-01-26 | | Bonds | 9.5% ANGL, 9.1% SCHP, 9.0% BND | 27.6 | Reduced 0.2% | 2021-01-26 | | Commodities | GCC | 2.3 | Reduced 2.1%
| 2020-09-04 | | Precious Metals | GDX | 8.9 | Added 4.8% | 2020-12-01 | | Special Situations | 10.3% XLE, 8.9% PSCE | 19.2 | Added 19.2% | 2021-01-26 | | Cash | | 33.4 | | |
|
Updates (Changes made today are underlined)
With a market that has seen the kinds of broad participation and big breath thrusts like we did in the fall, it's hard to become too negative. Those kinds of conditions have consistently preceded higher returns over the next 6-12 months. It's the interim that's more of an issue. Even conditions like that haven't prevented some shorter-term pullbacks. And when we combine an environment where speculation is rampant and recent days have seen an increase in cracks under the surface of the indexes, it's enough to become more defensive over a short- to medium-term time frame. We still don't have much confirmation from the price action in the indexes, so those who are more conservative would likely wait before increasing cash levels. In a bid to more closely align the portfolio with what most of our members consider "stocks", we have moved any sector-specific investments to the "special situations" category instead of "stocks." This way, the "stocks" category is essentially the most benchmarked index in the world, the S&P 500. RETURN YTD: 3.7% 2020: 8.1%, 2019: 12.6%, 2018: 0.6%, 2017: 3.8%, 2016: 17.1%, 2015: 9.2%, 2014: 14.5%, 2013: 2.2%, 2012: 10.8%, 2011: 16.5%, 2010: 15.3%, 2009: 23.9%, 2008: 16.2%, 2007: 7.8%
|
|
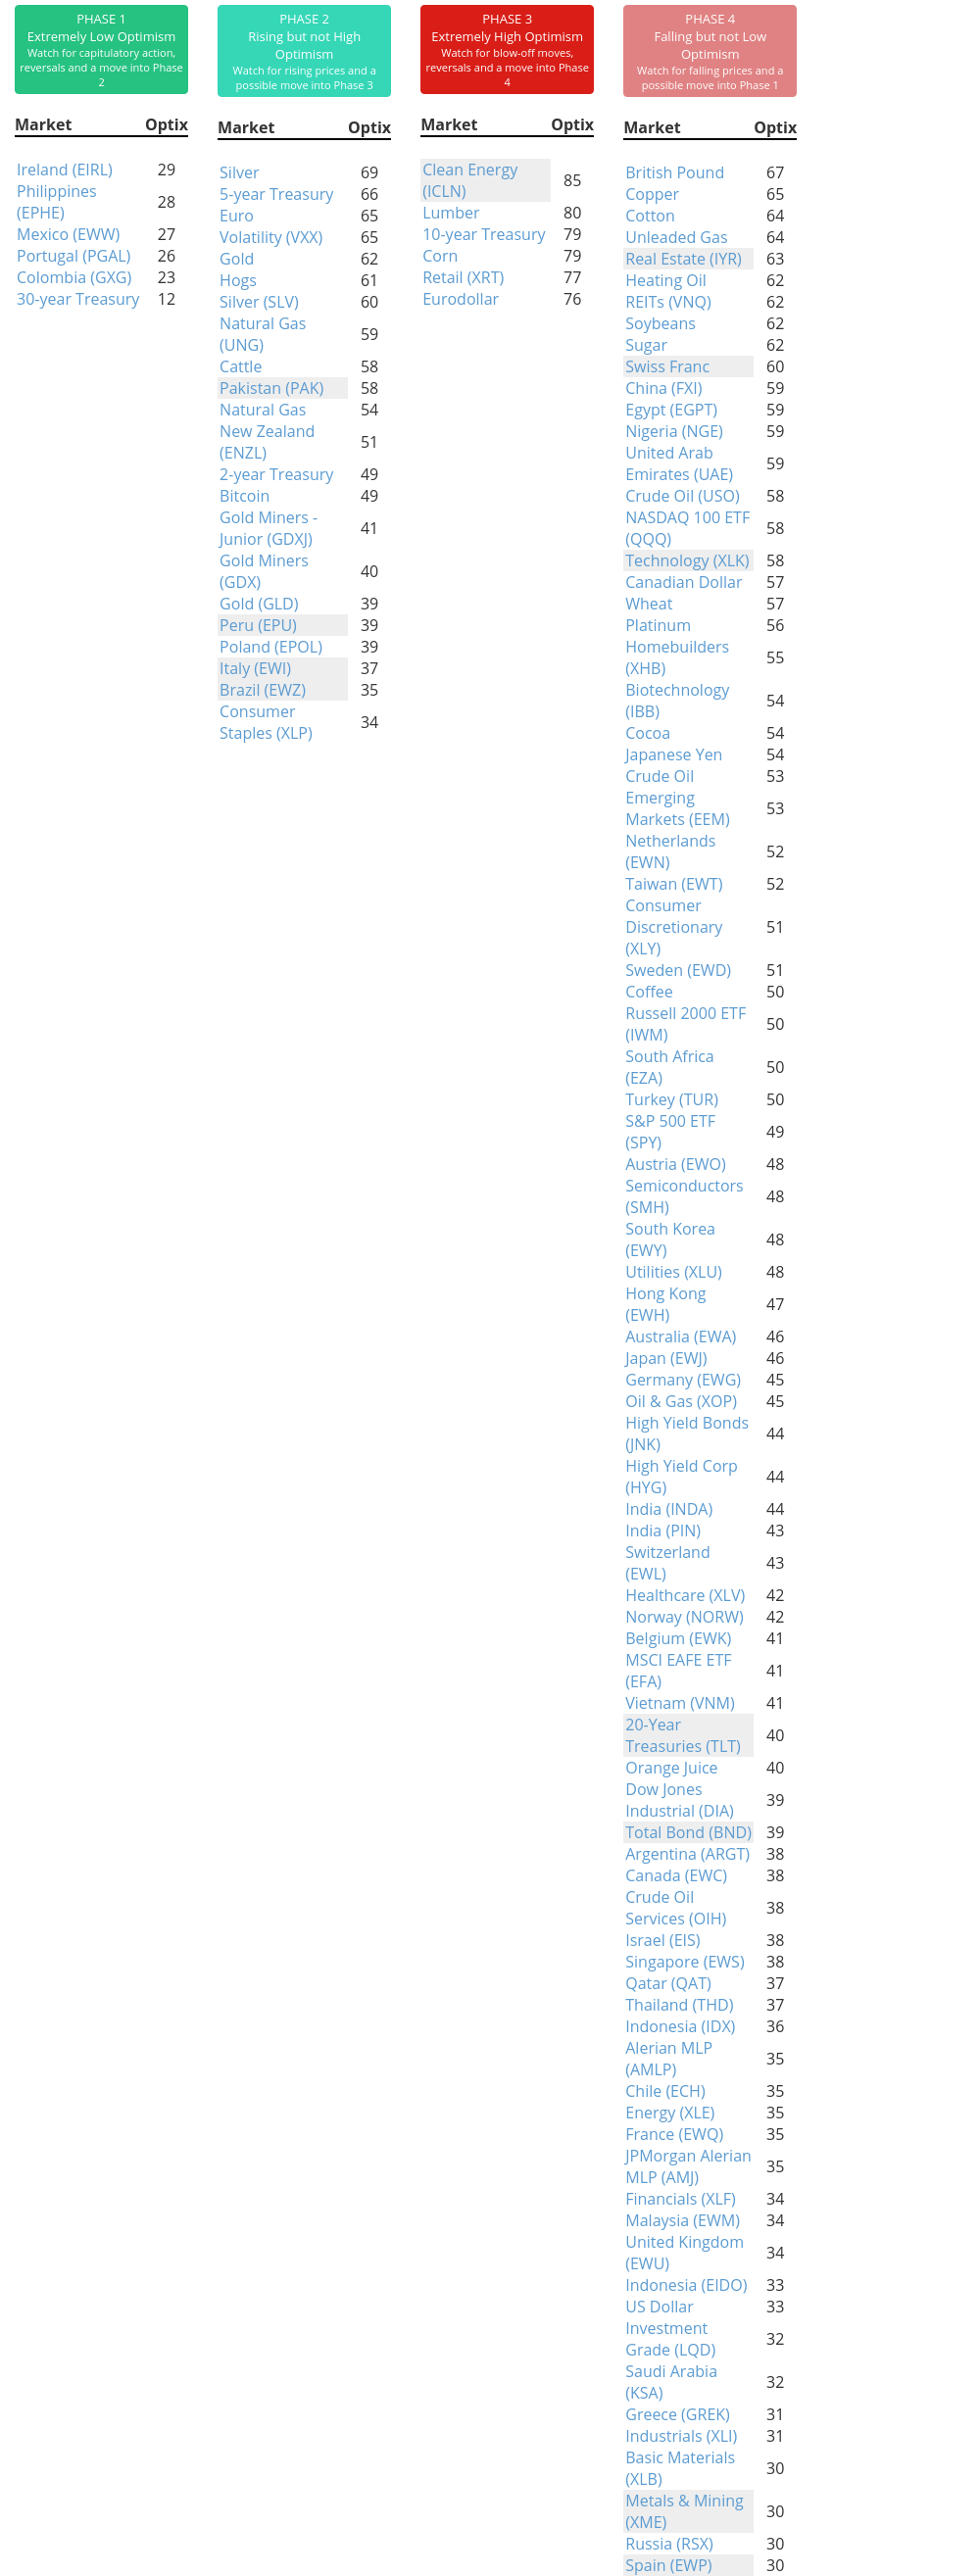
Phase Table
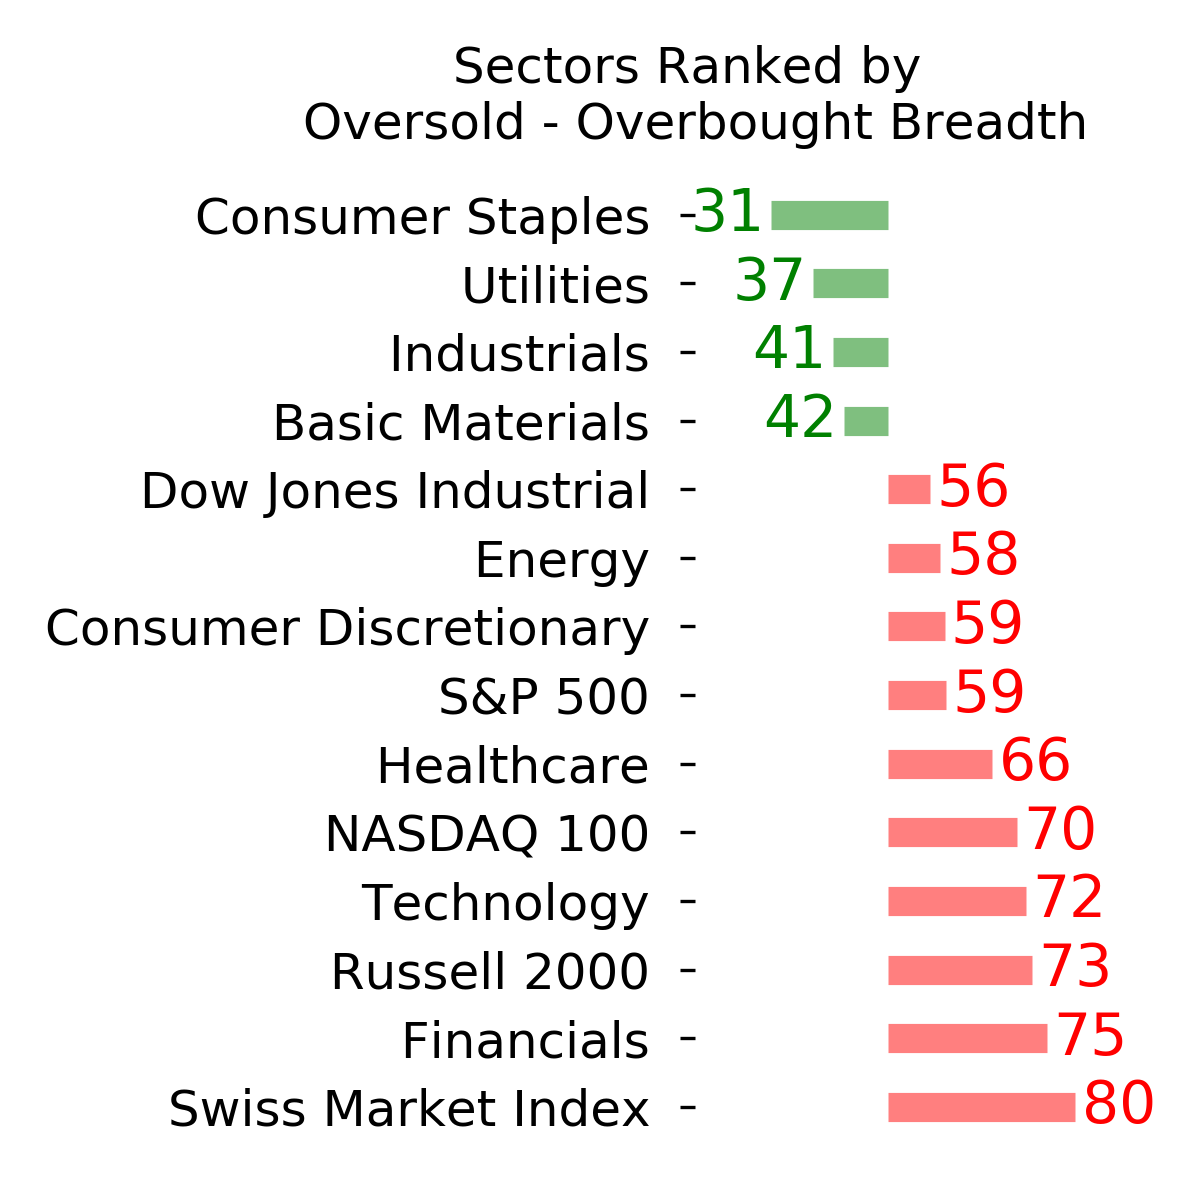
Ranks
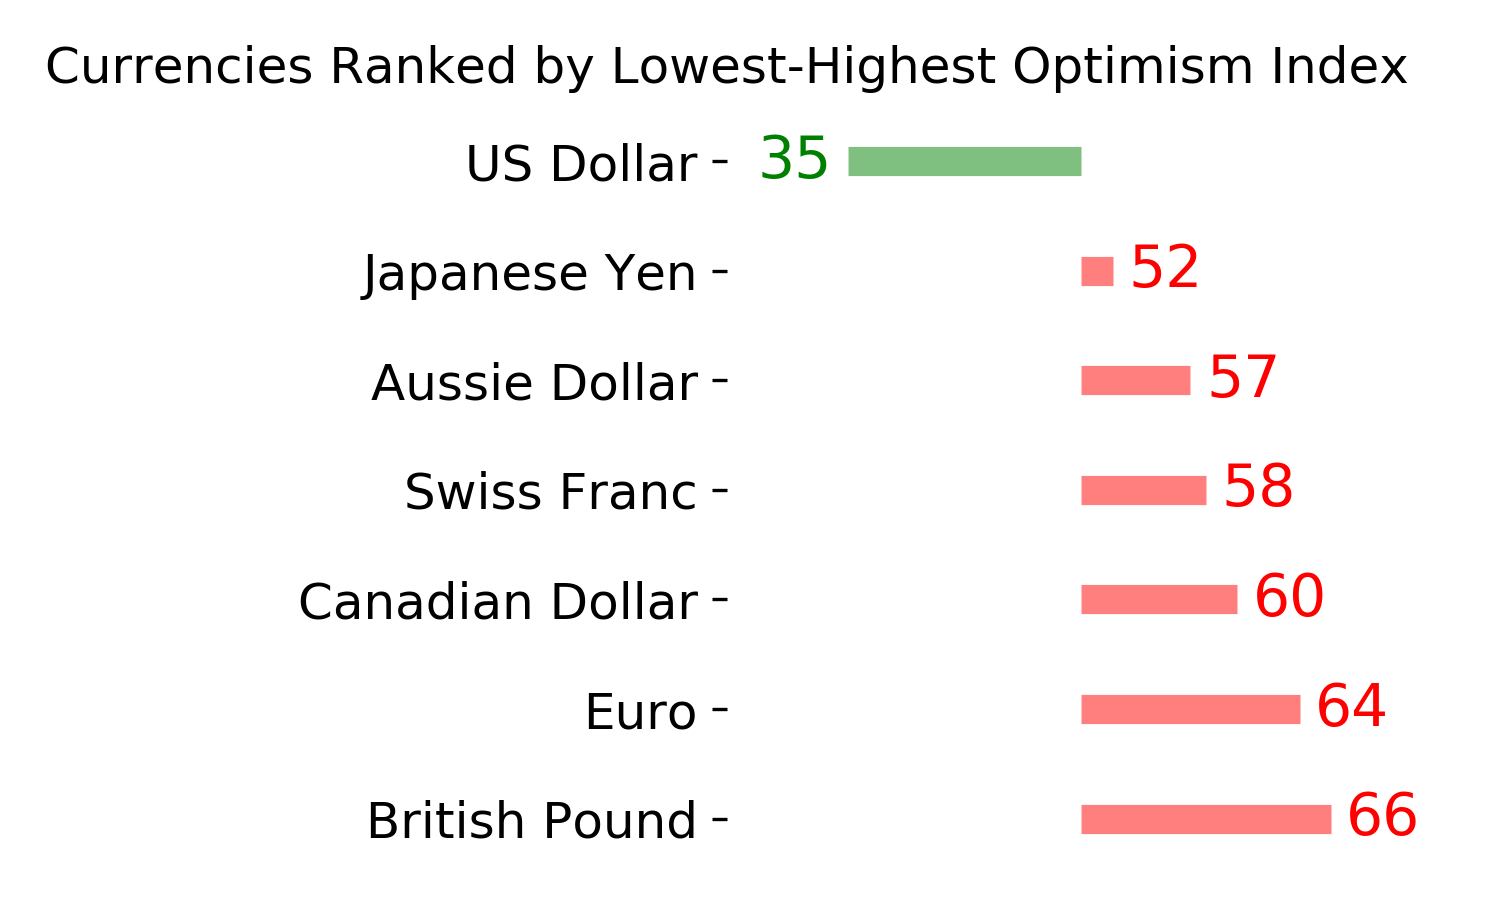
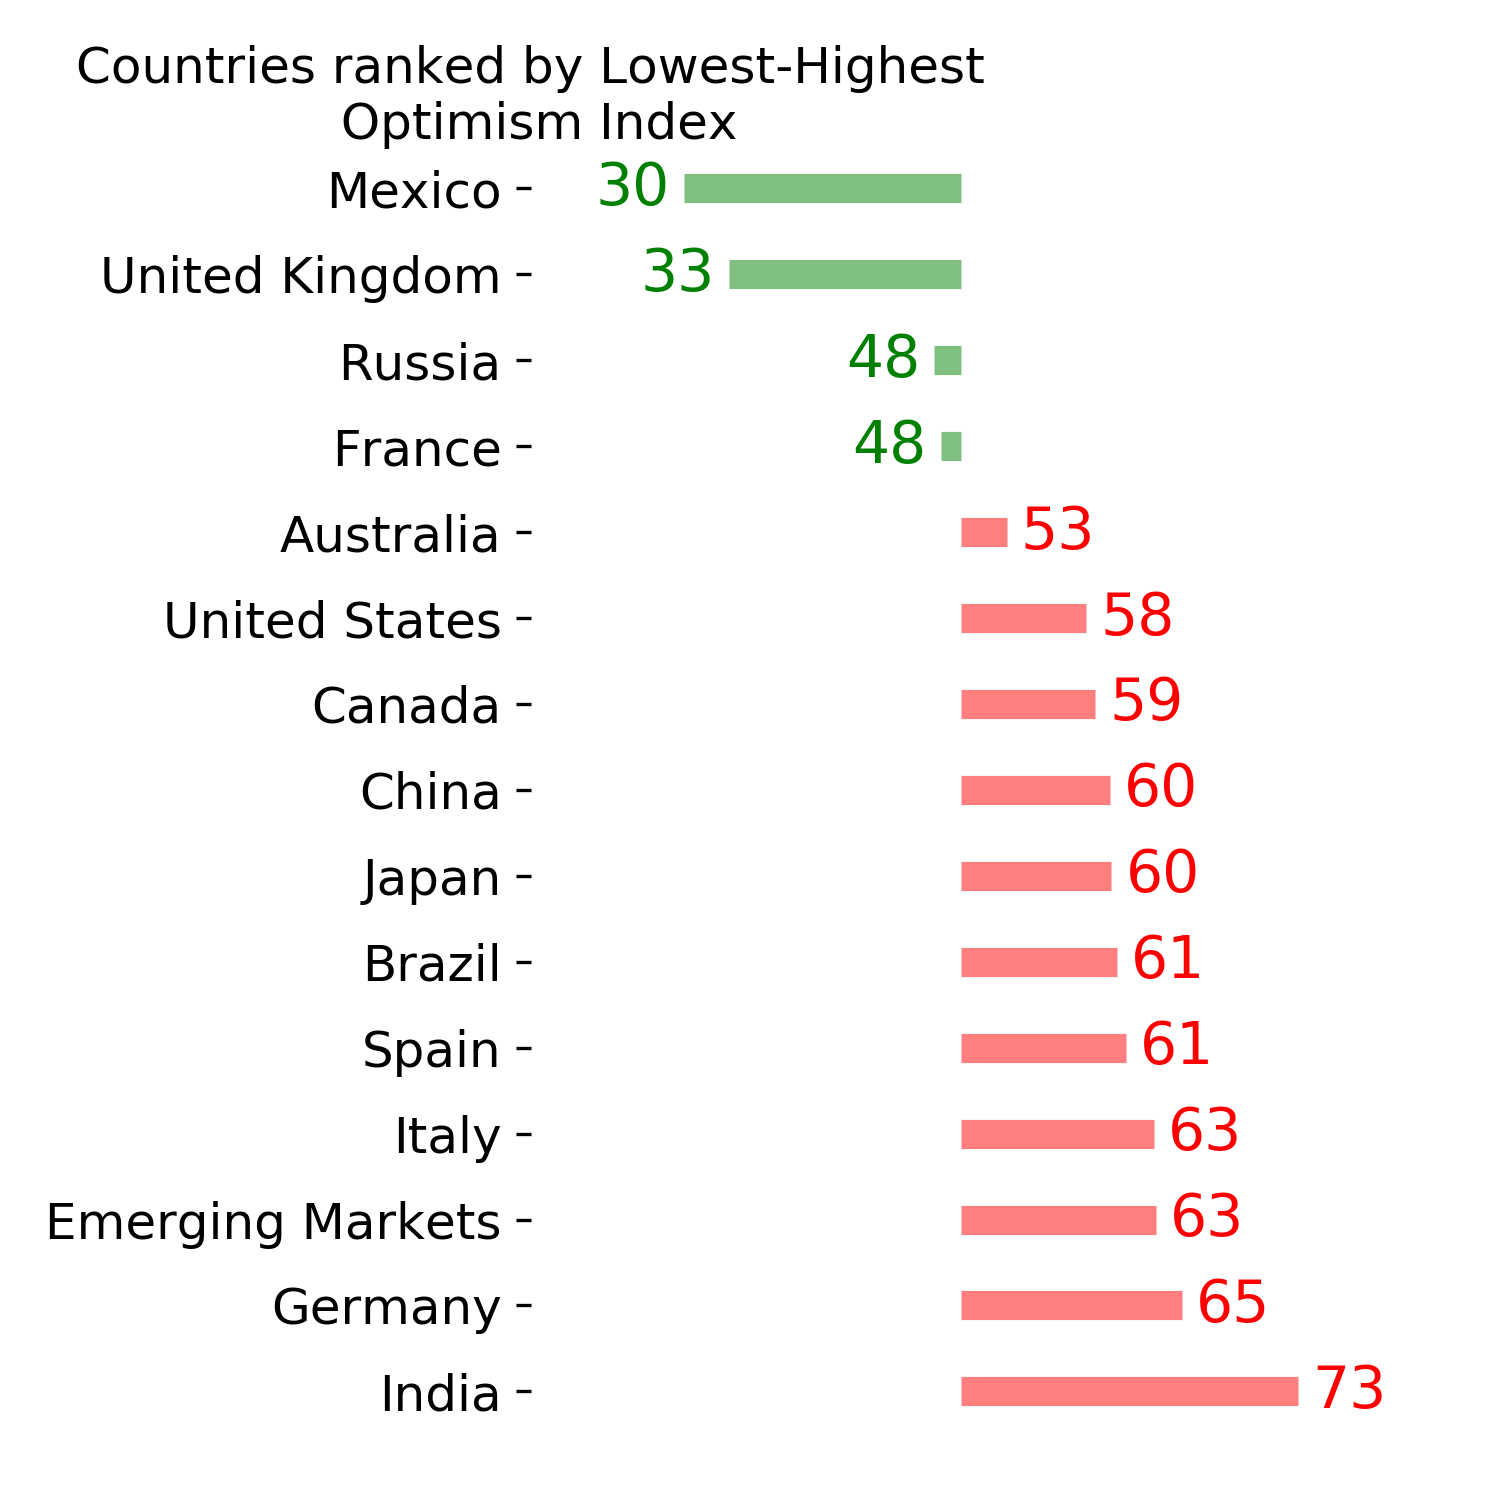
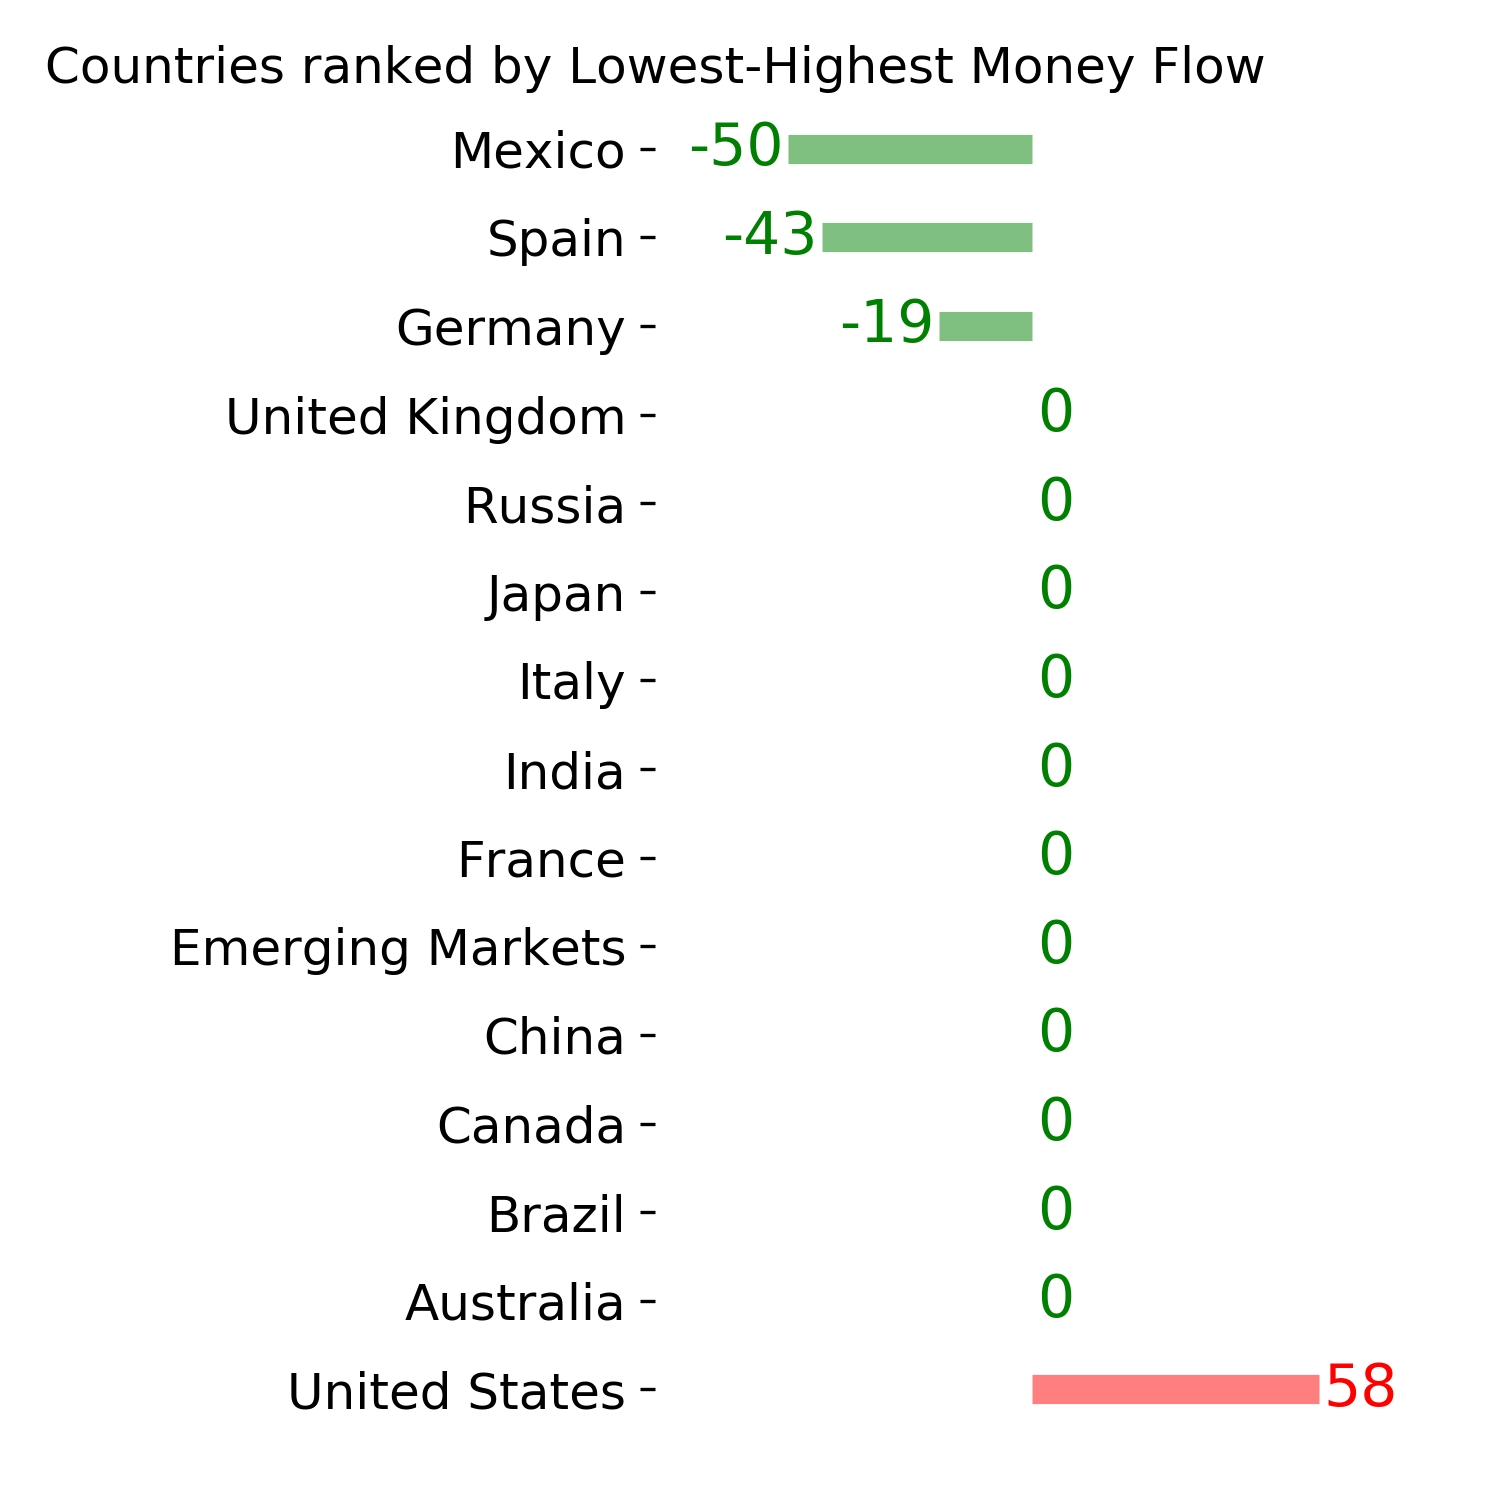
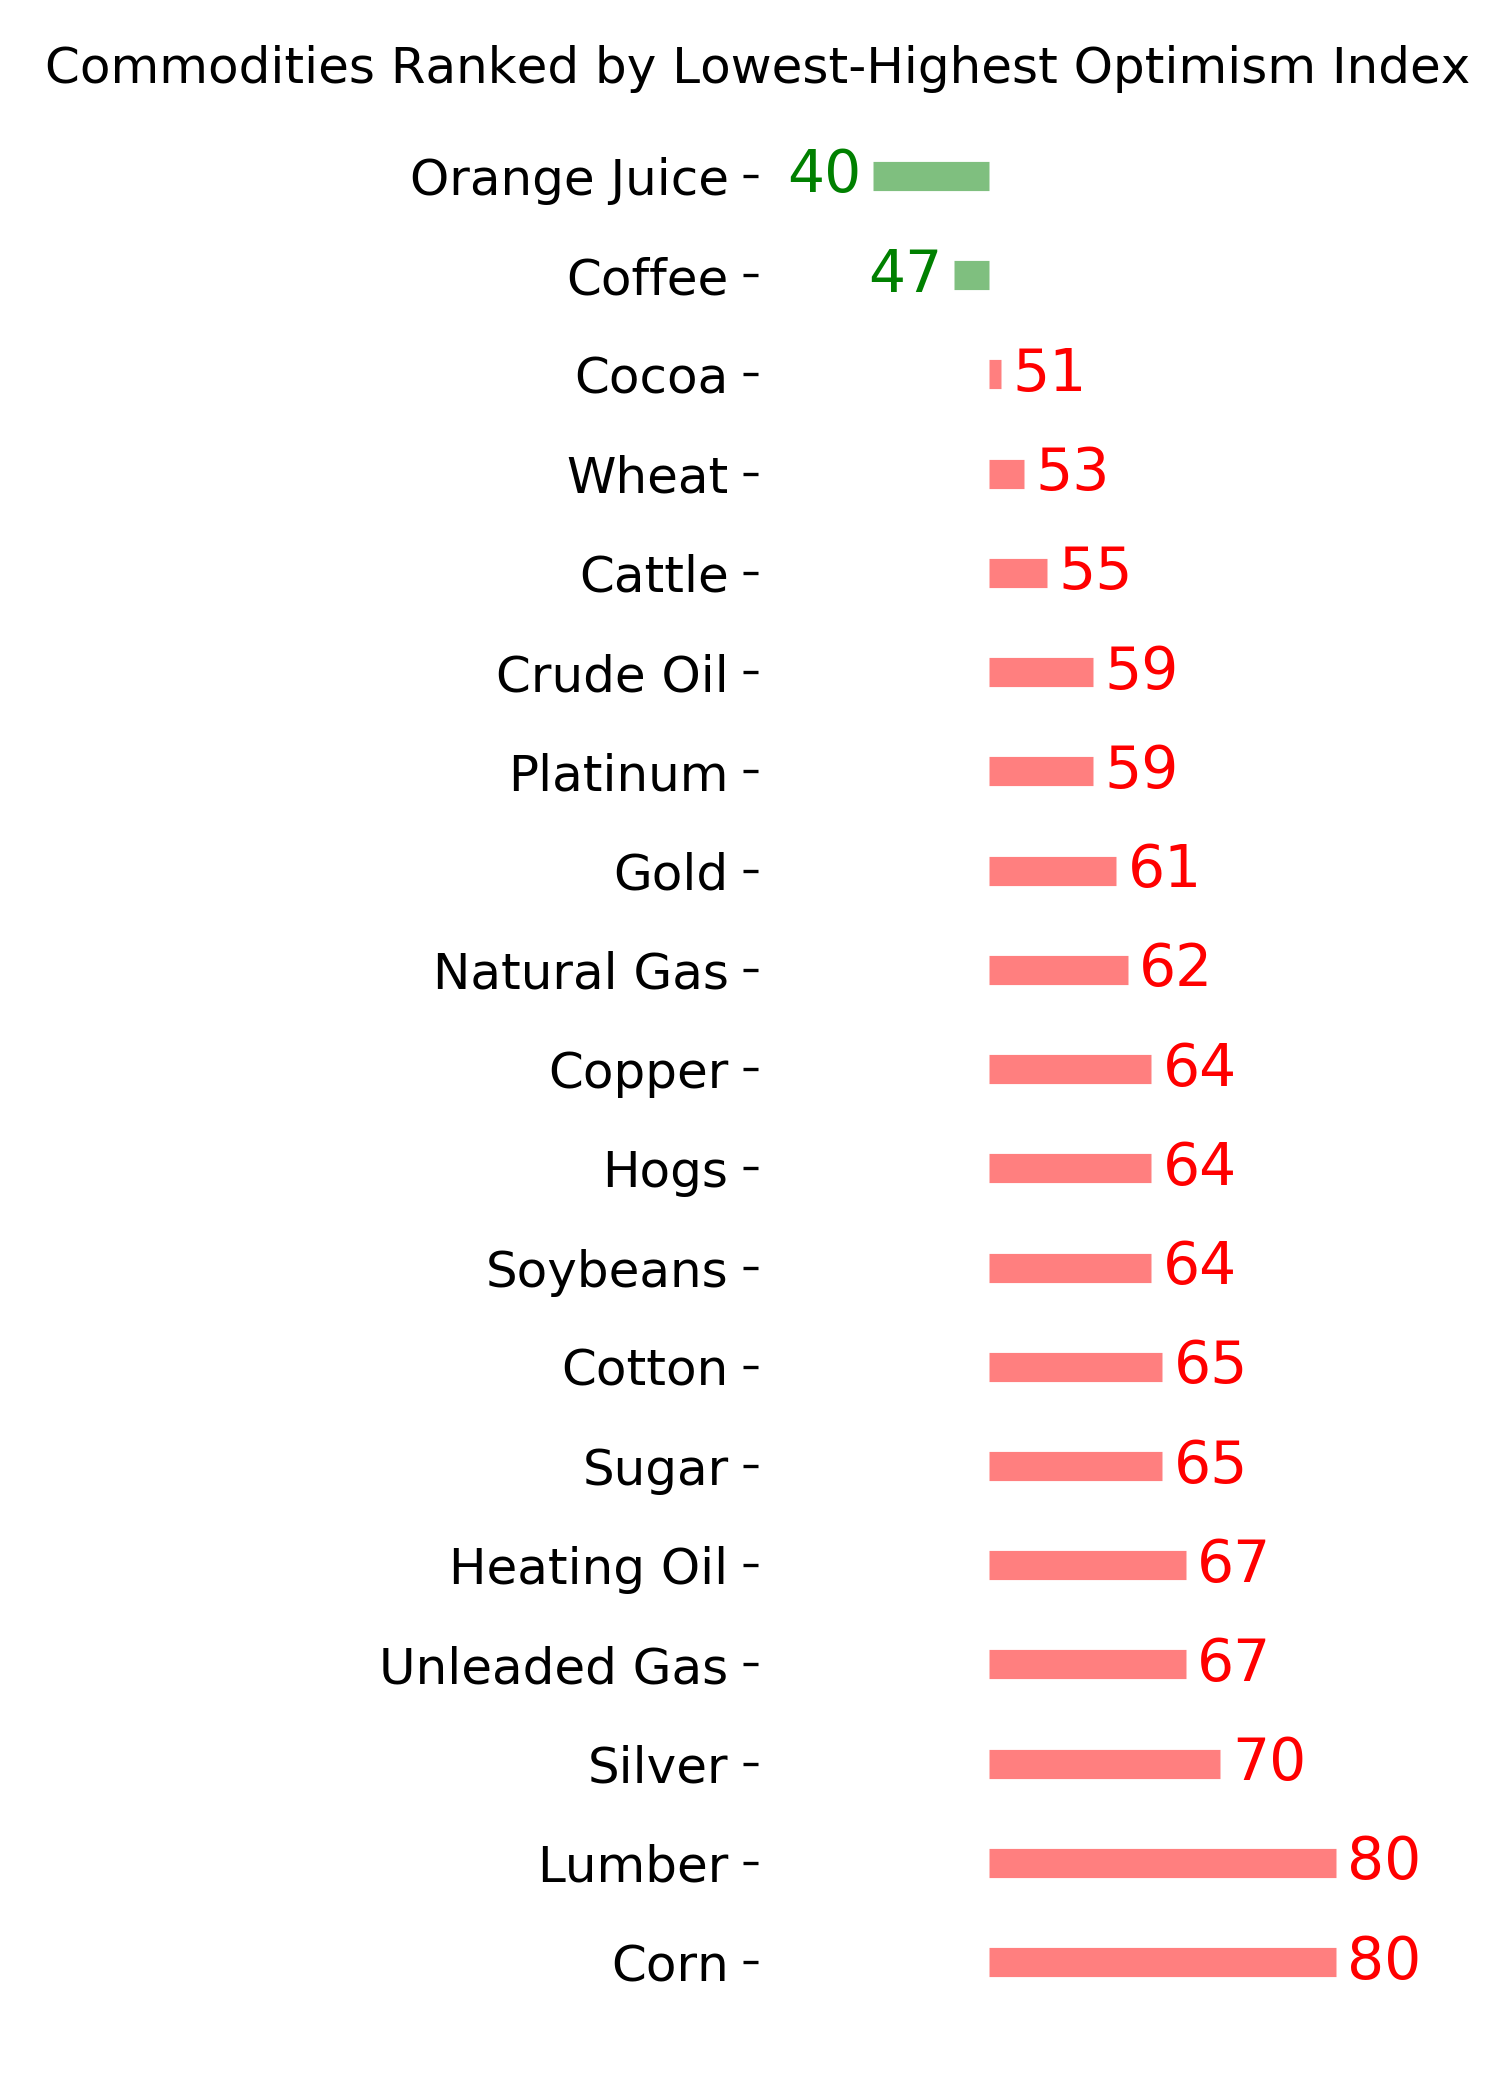
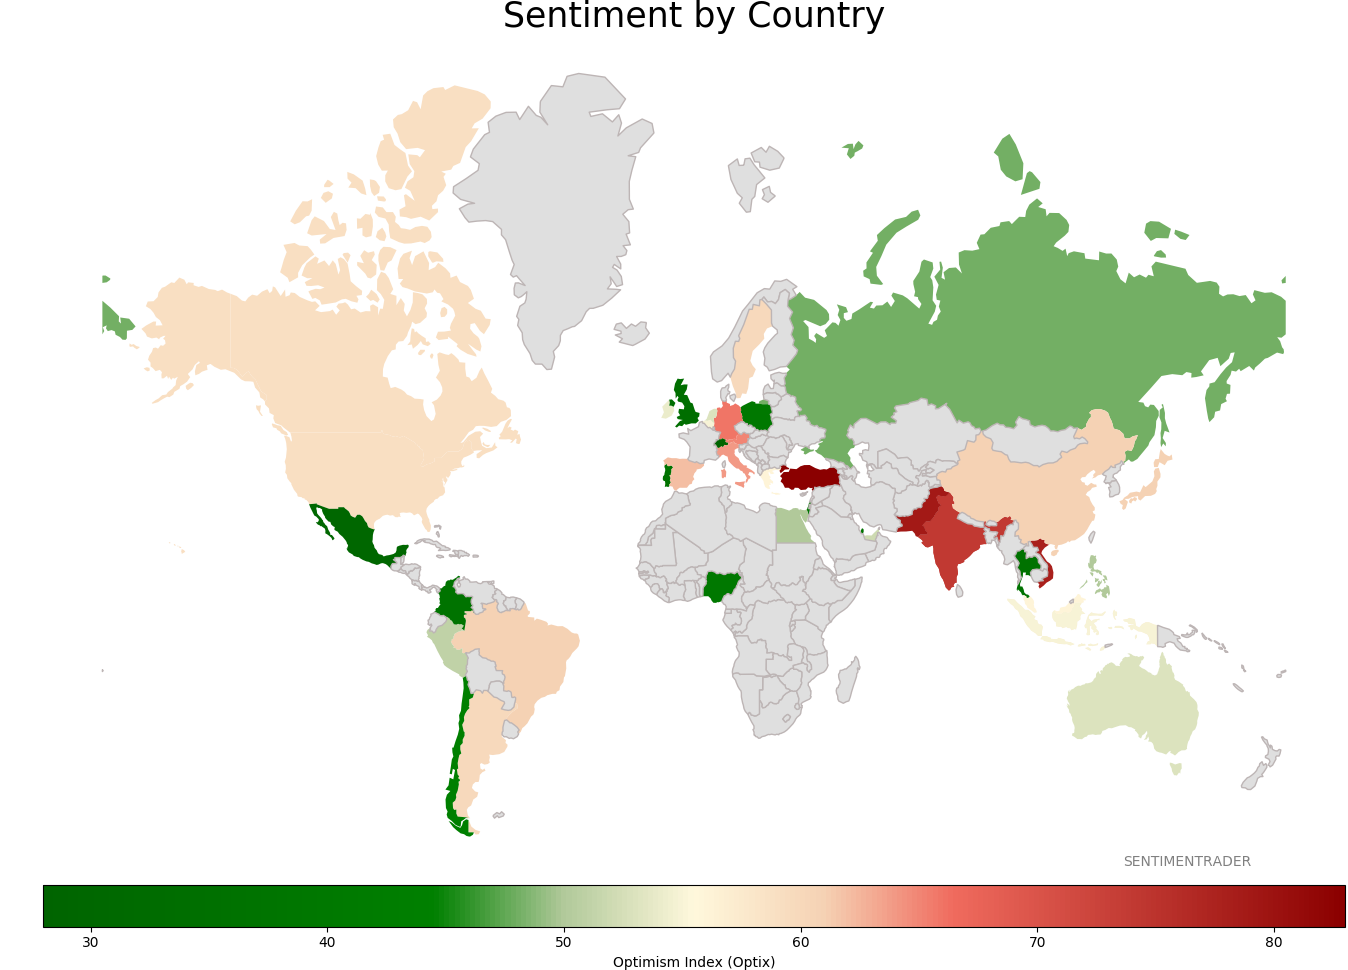
Sentiment Around The World
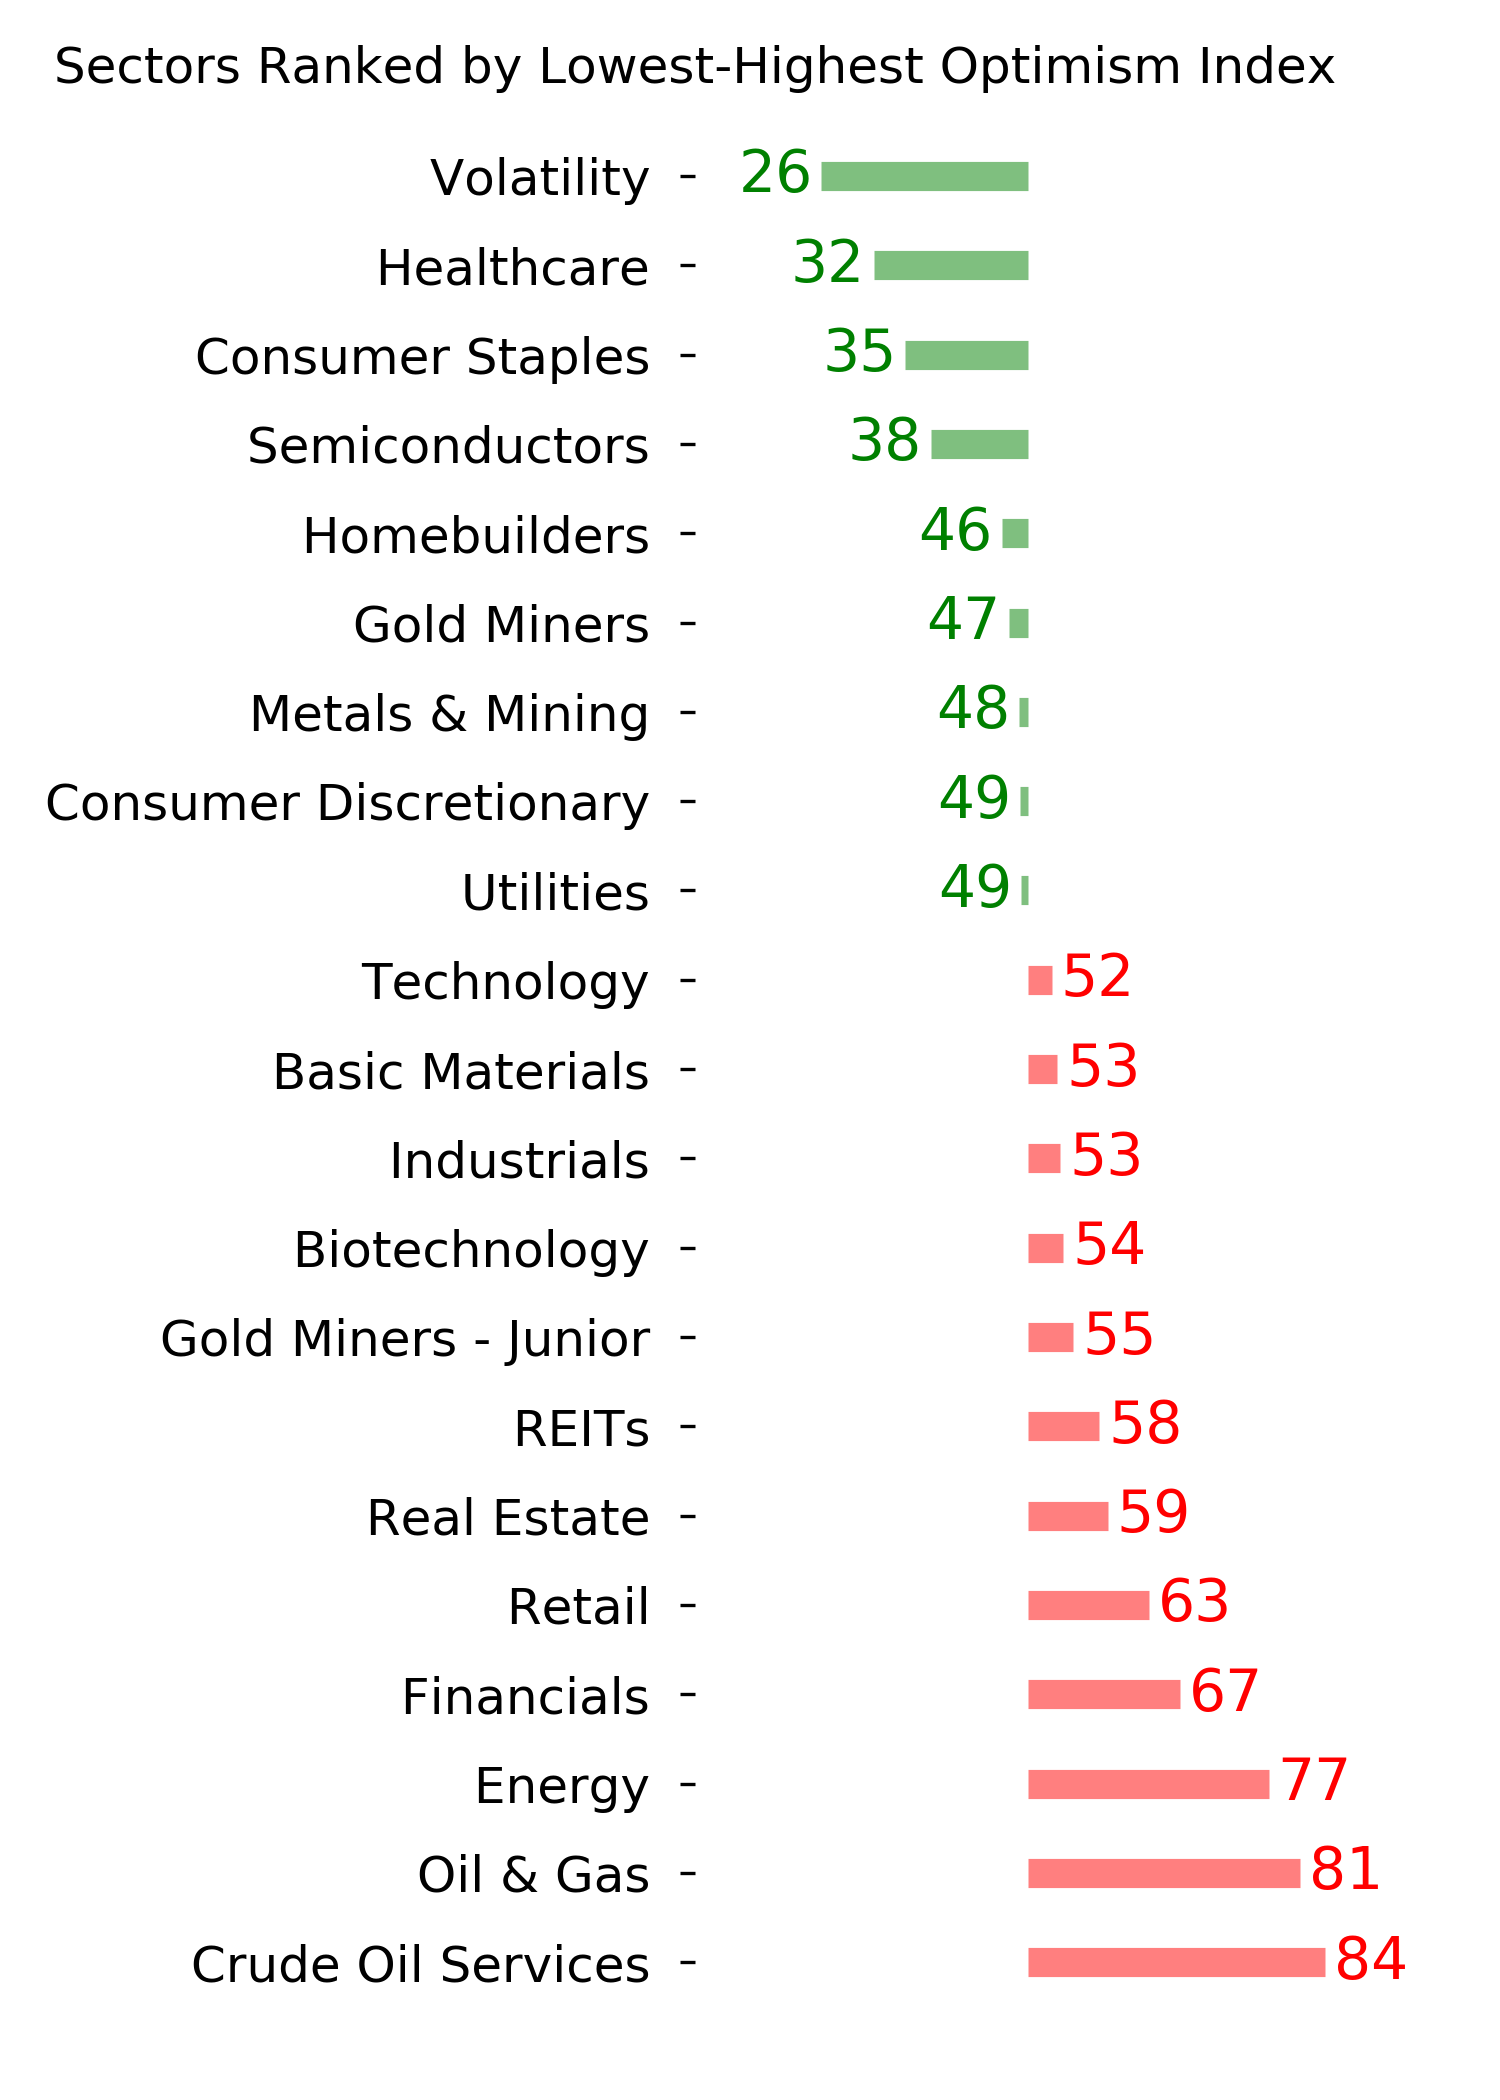
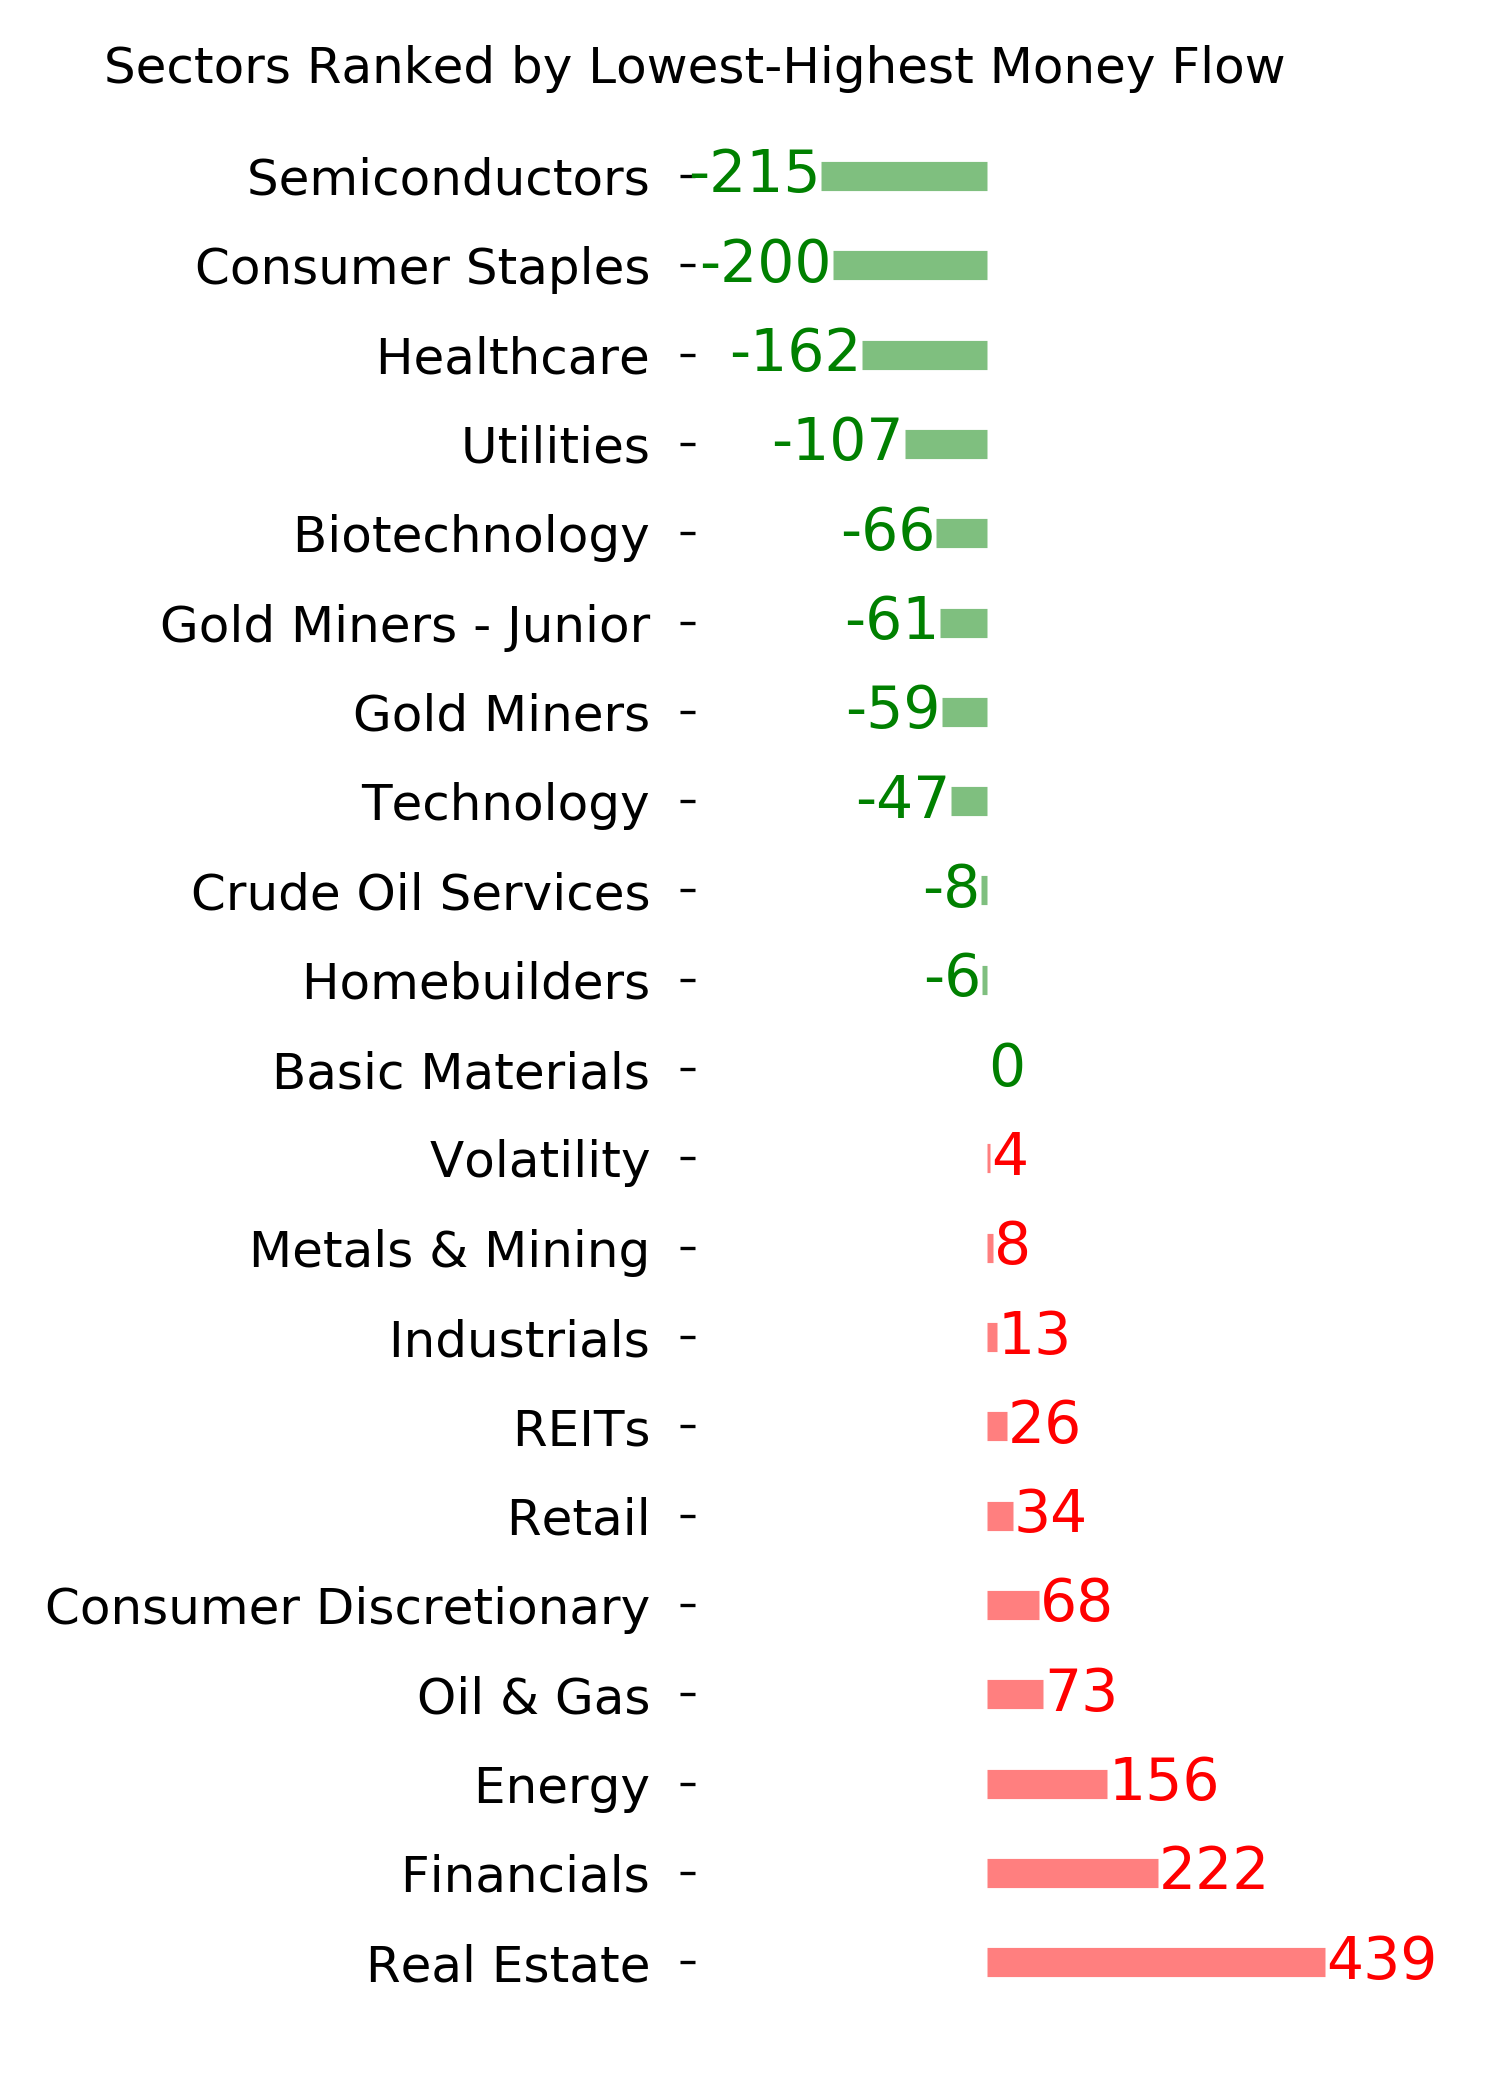
Optimism Index Thumbnails
|
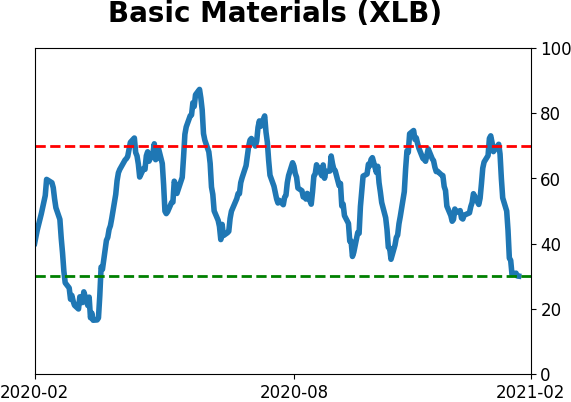
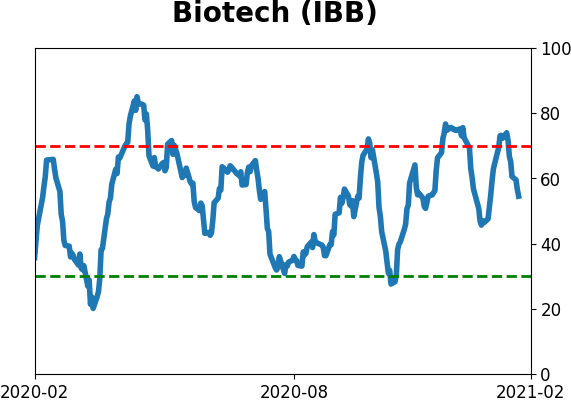
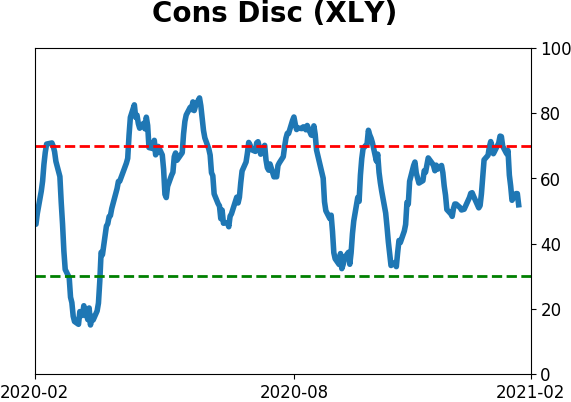
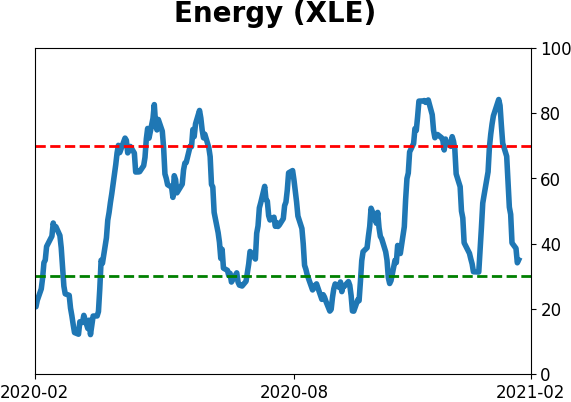
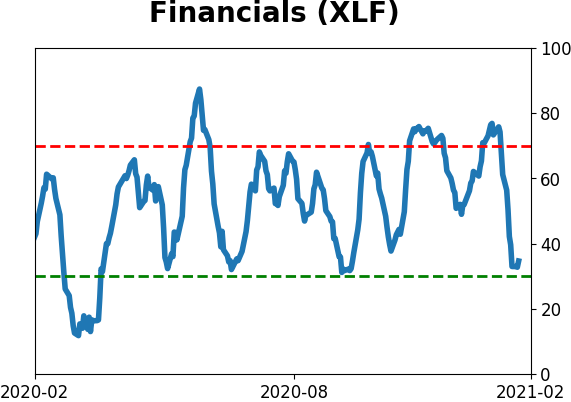
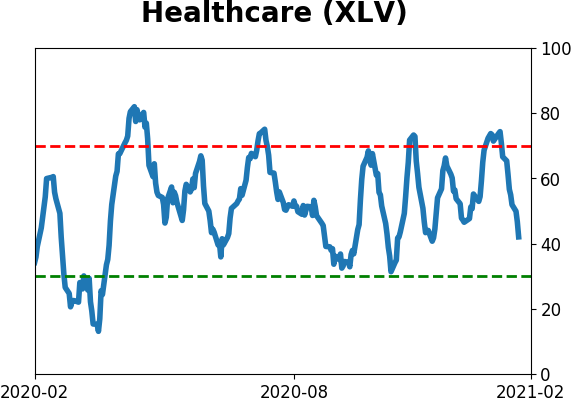
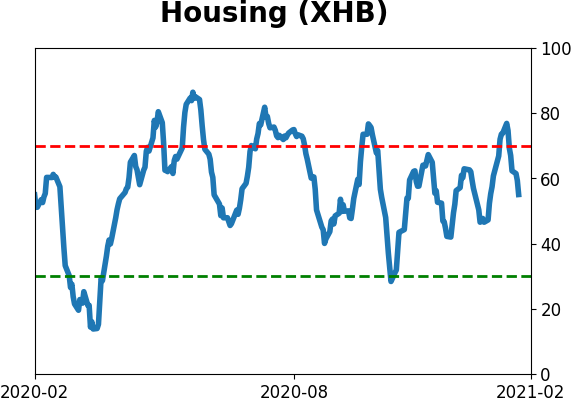
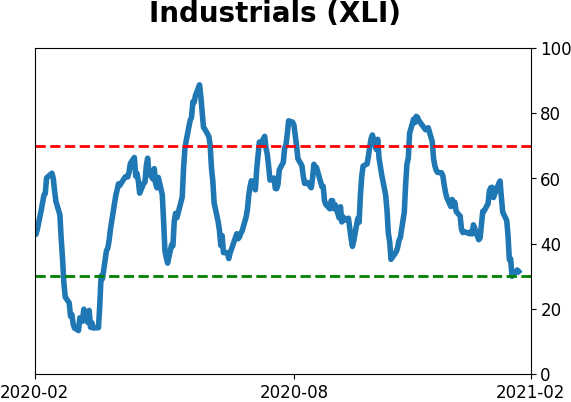
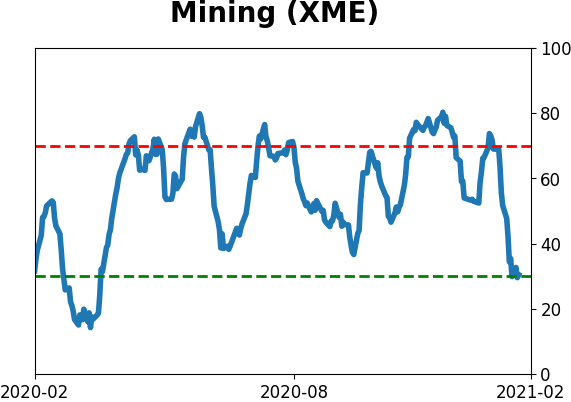
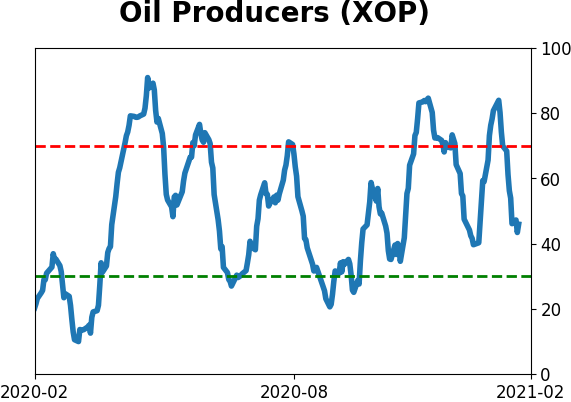
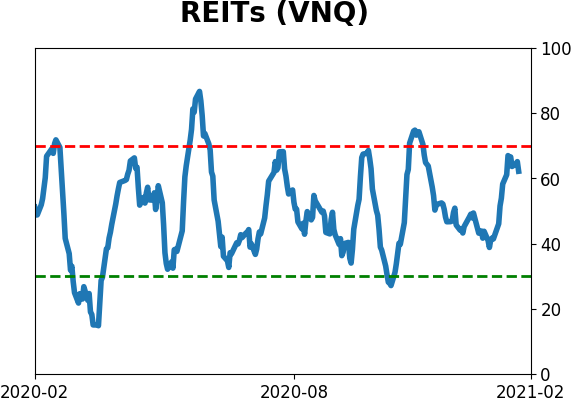
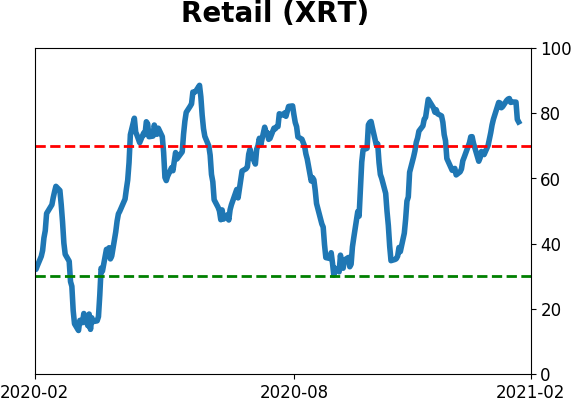
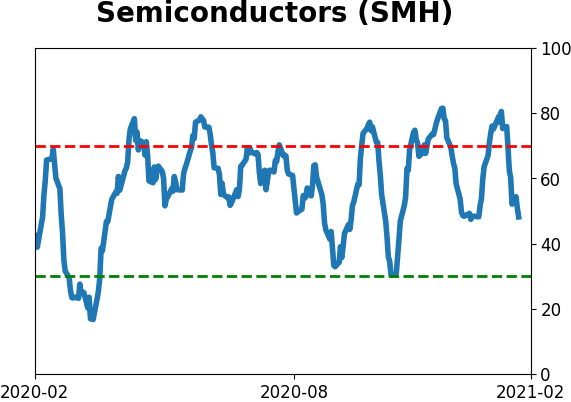
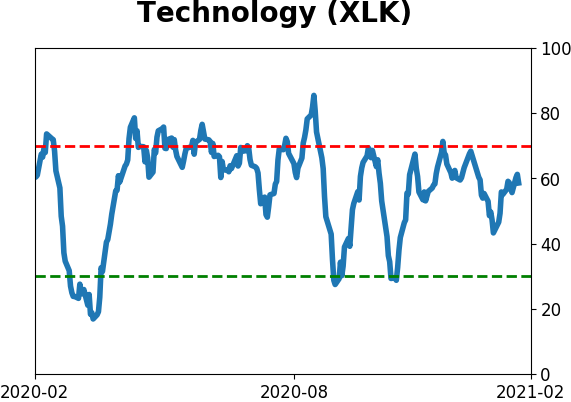
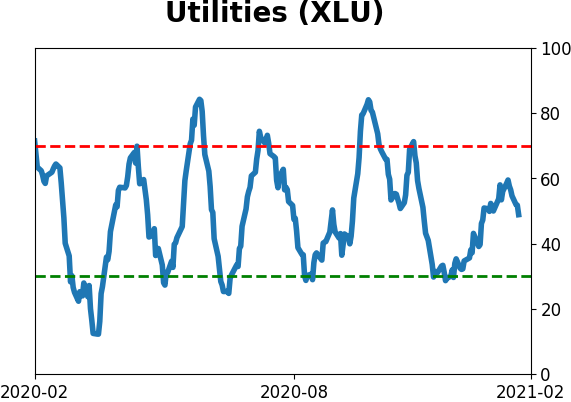
Sector ETF's - 10-Day Moving Average
|
|
|
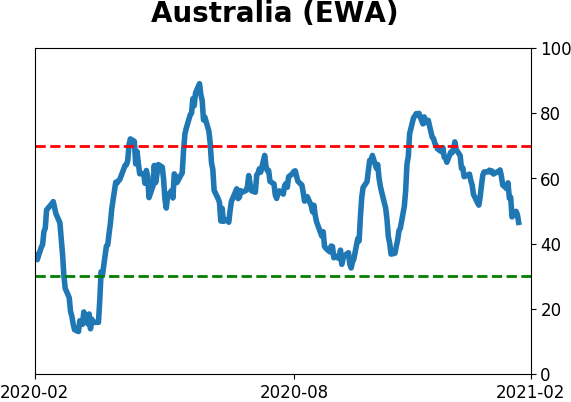
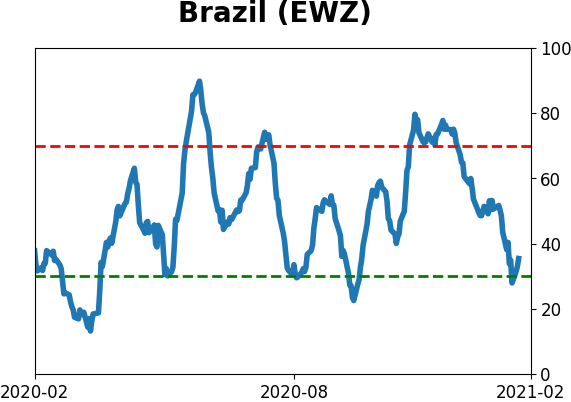
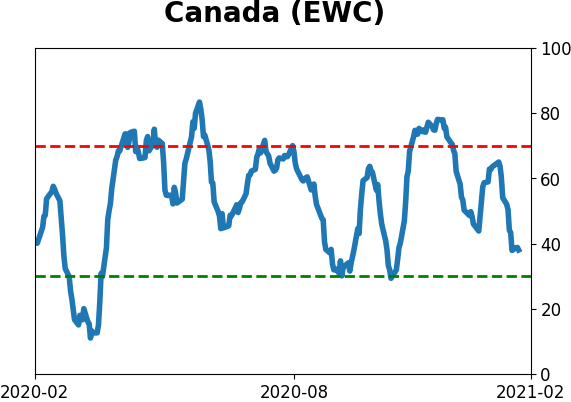
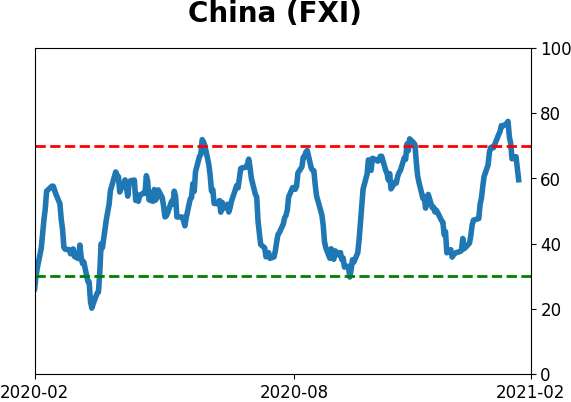
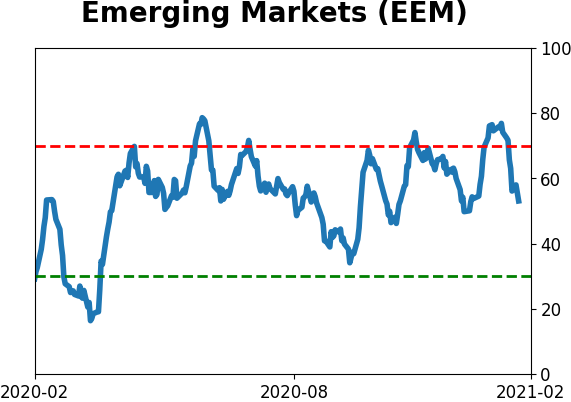
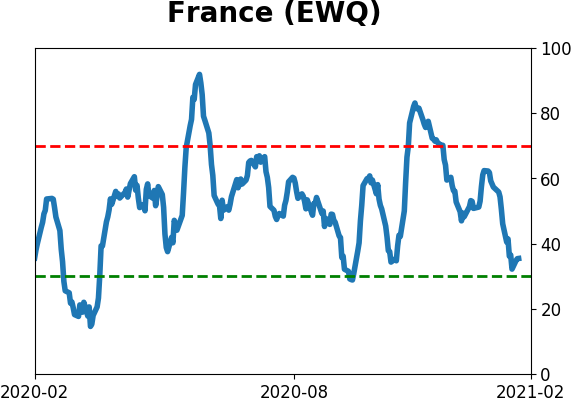
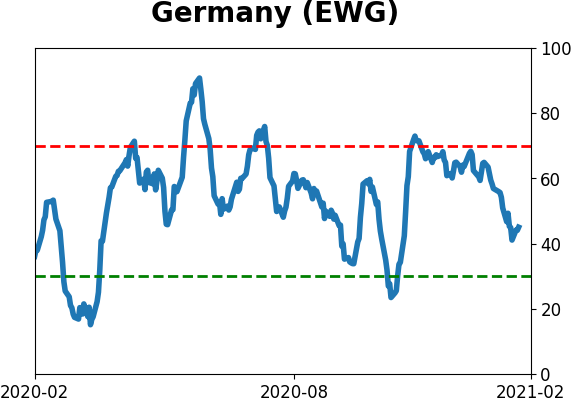
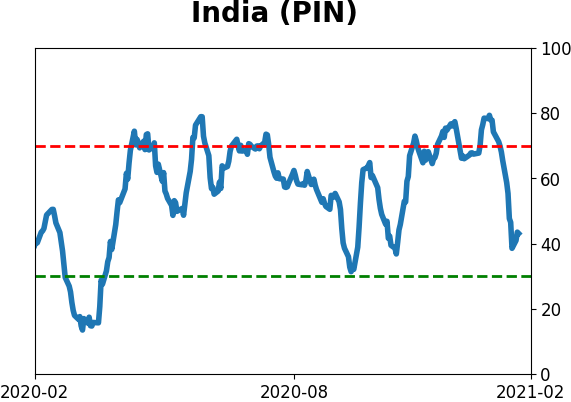
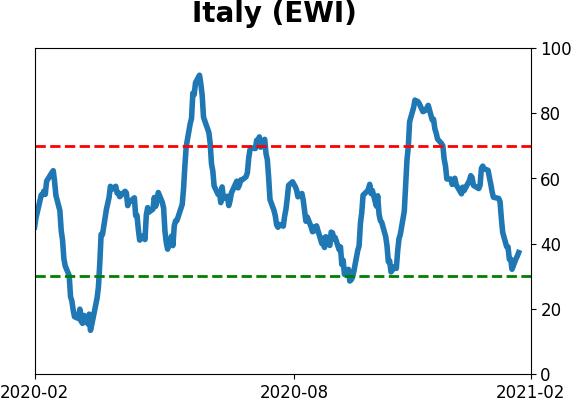
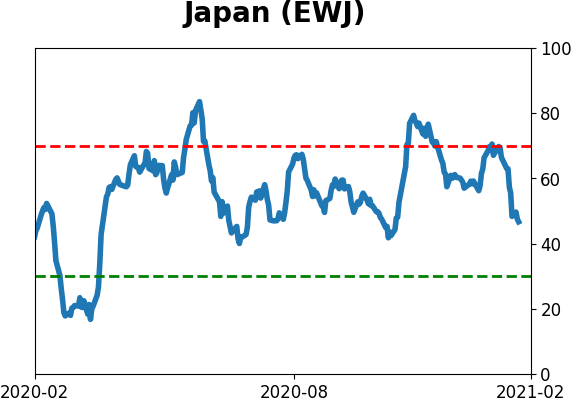
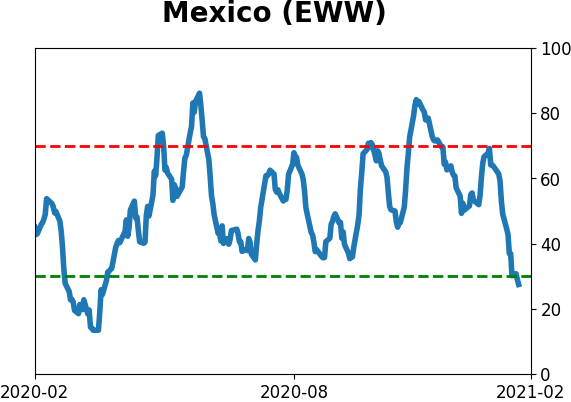
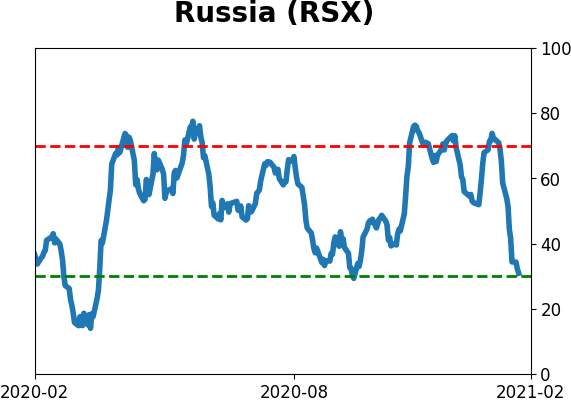
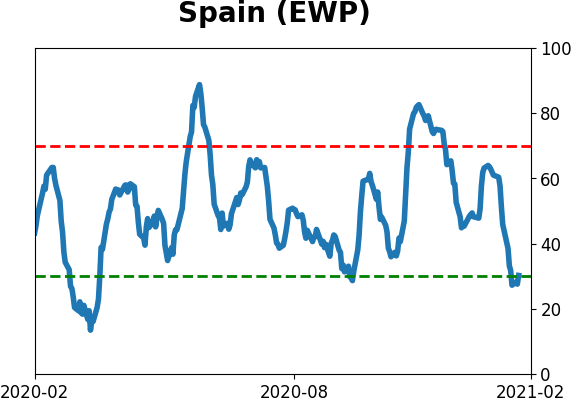
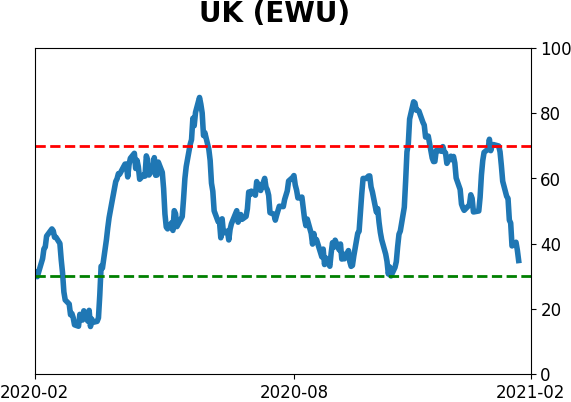
Country ETF's - 10-Day Moving Average
|
|
|
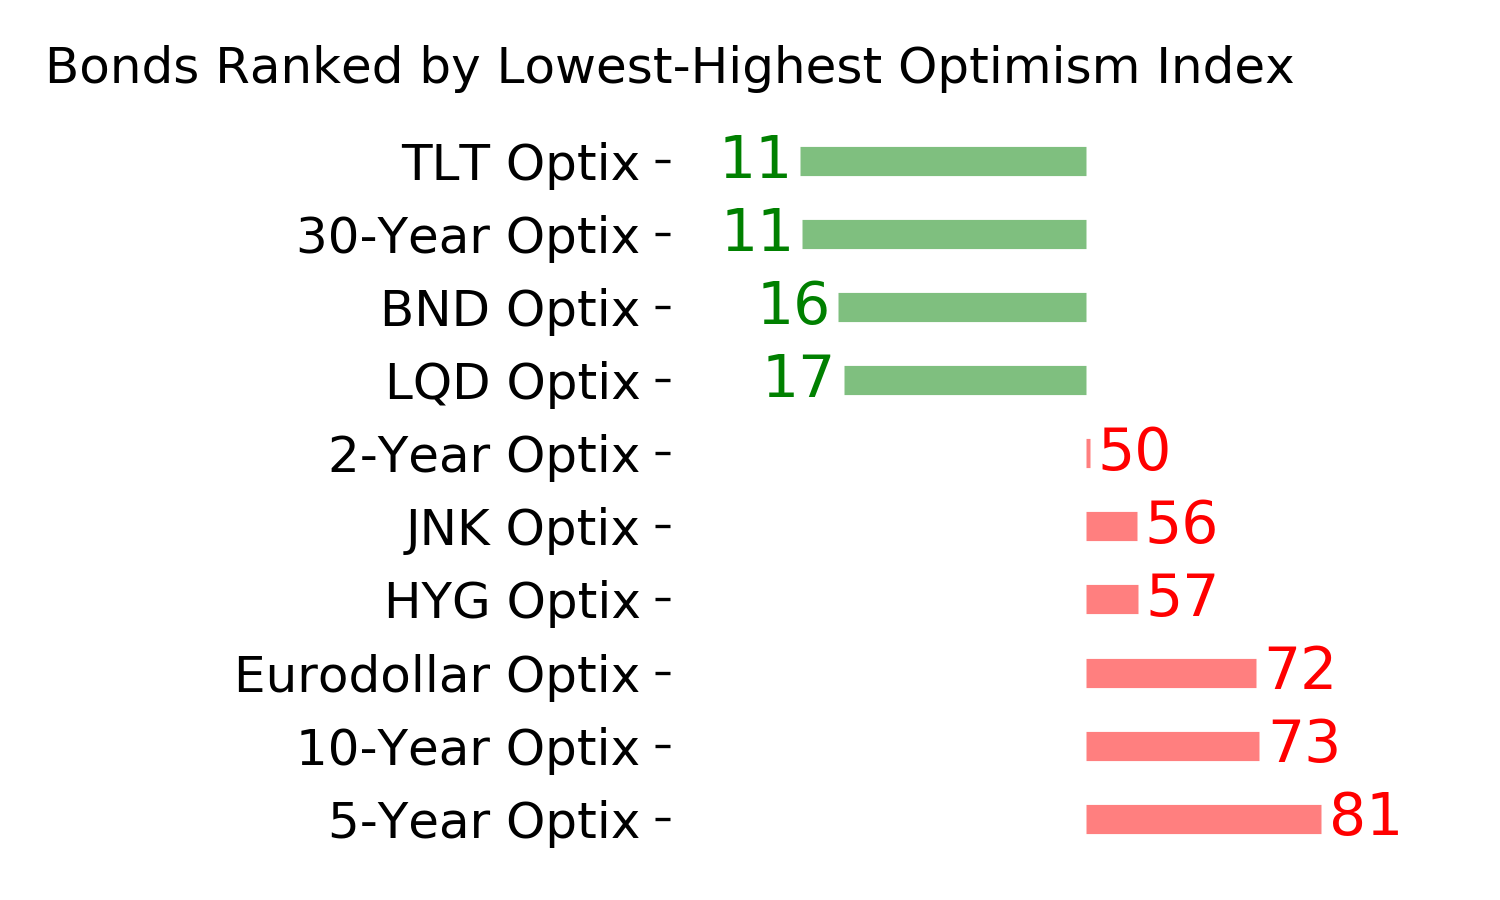
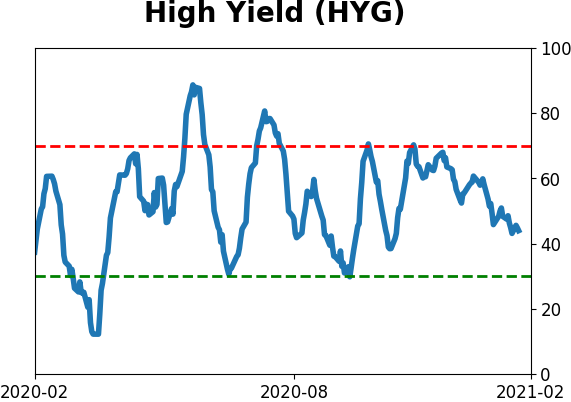
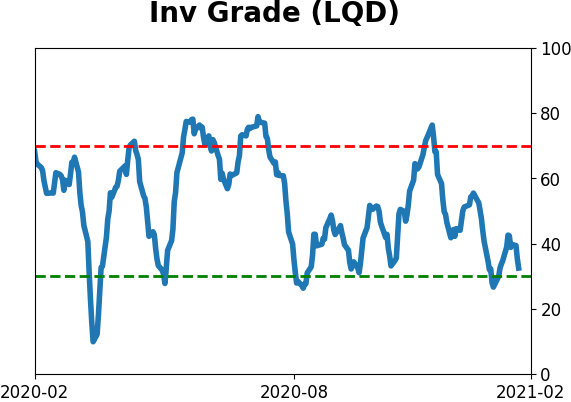
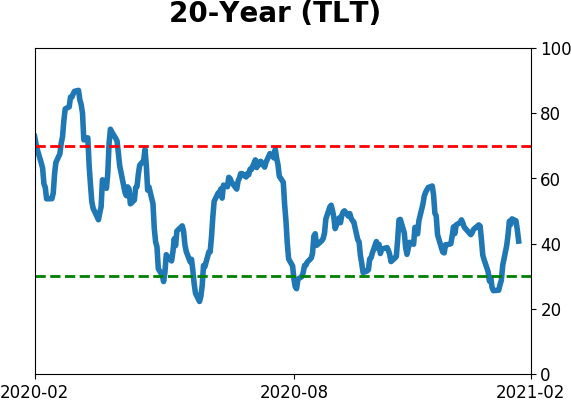
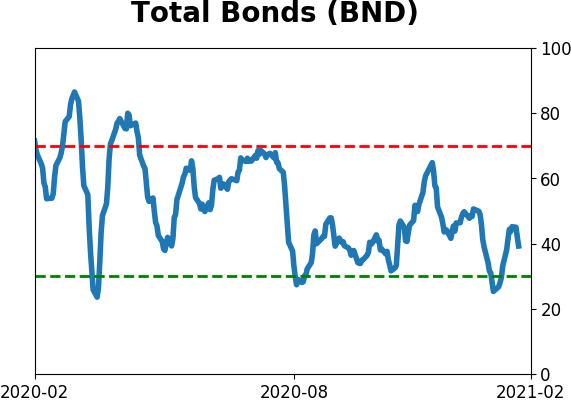
Bond ETF's - 10-Day Moving Average
|
|
|
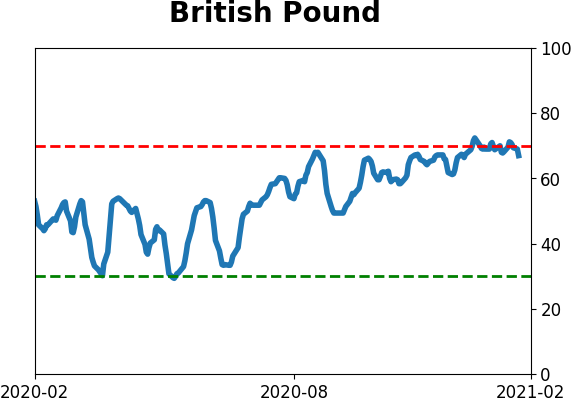
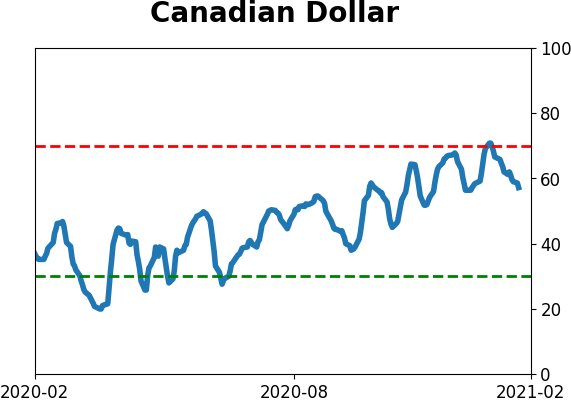
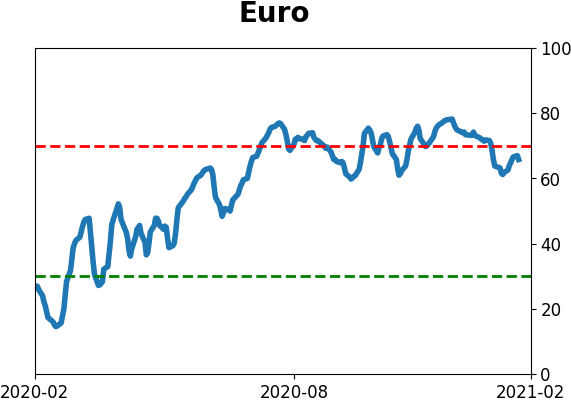
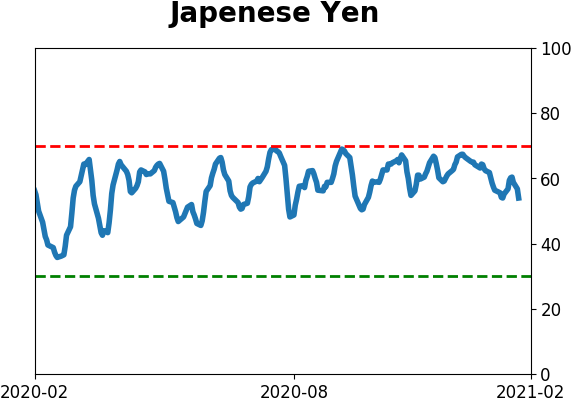
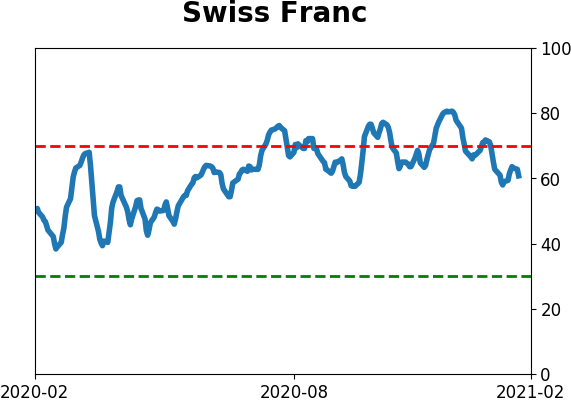
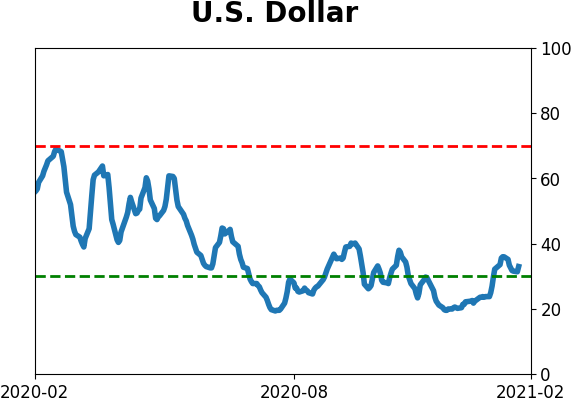
Currency ETF's - 5-Day Moving Average
|
|
|
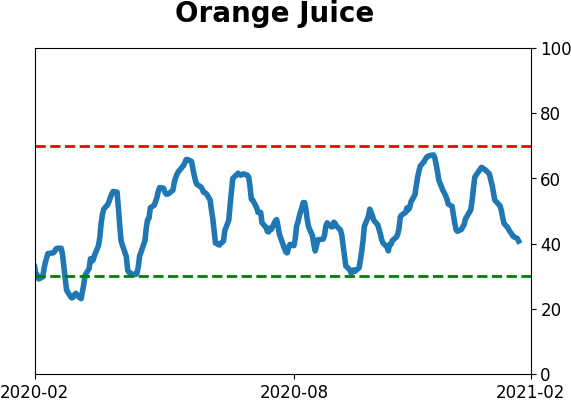
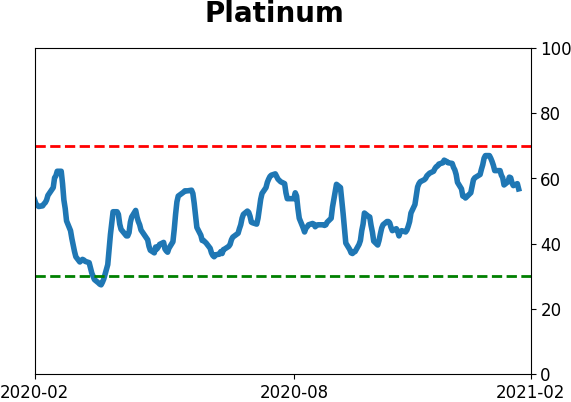
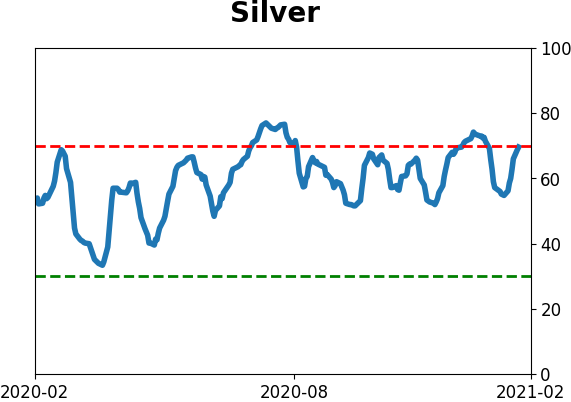
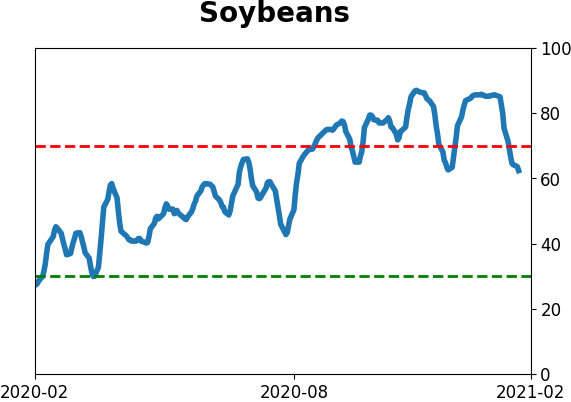
Commodity ETF's - 5-Day Moving Average
|
|