Headlines
|
|
A key reversal pushes trends to important junctures:
The S&P 500 suffered a key reversal week last week, as it finally dropped below its 50-day moving average. Barely 40% of stocks within the index have held above their own averages, a threshold that has been an important level to watch.
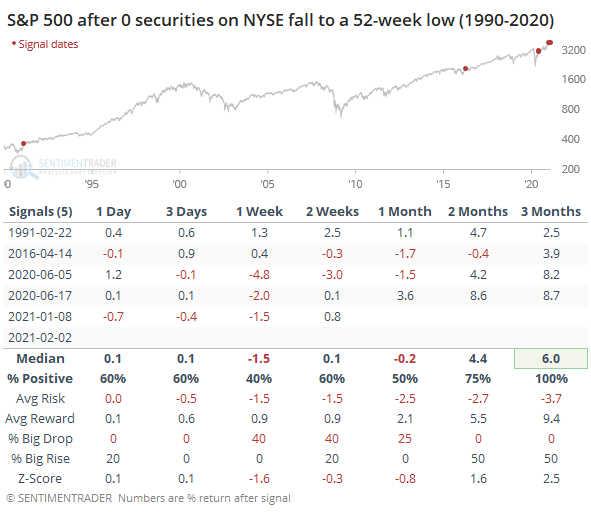
No lows: A few days ago, there was panic in the air as the VIX spiked by one of the largest amounts ever. A few days later, things apparently are so good that not a single security on the NYSE fell to a 52-week low at any point during the day. Figures like this can get sketchy the further back we go, and it depends on the source, but according to our records, this has only happened a handful of other times since 1990 (it was more common prior to 1985). There were some minor losses after most of the others, but it's hard to be too negative on stocks in general when there is still no consistent pressure from sellers. This has to change for bears to capitalize on what is a spectacularly speculative environment.
Bottom Line:
See the Outlook & Allocations page for more details on these summaries STOCKS: Weak sell
We're in an extremely speculative environment that is enough to become defensive, especially with recent cracks showing in what had been pristine breadth conditions. The spike in fear on Wednesday (and again Friday) is likely not enough to offset the negatives over a medium-term time frame. BONDS: Weak buy
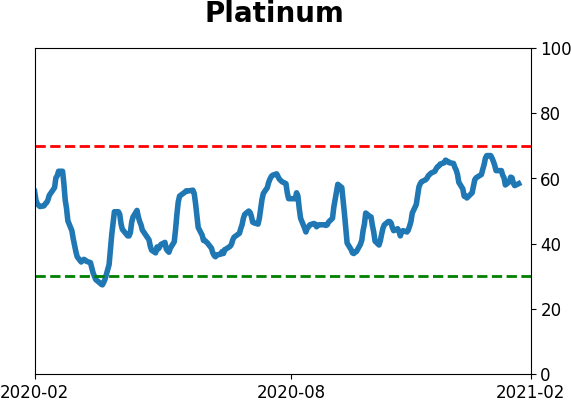
Various parts of the market have been hit in recent weeks, with mild oversold conditions that have started to reverse. GOLD: Weak buy
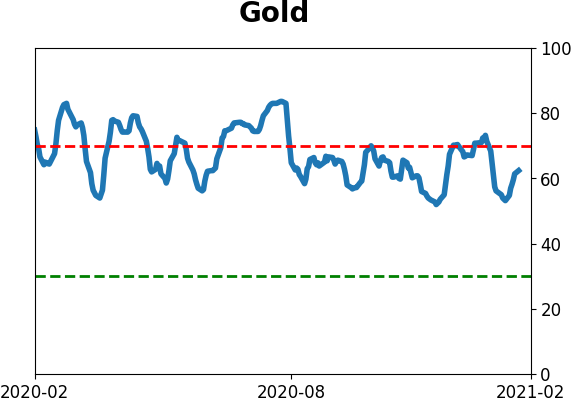
A dollar trying to rebound from a severe short position has weighed on gold and miners. The types of signals they've given in recent weeks, within the context of their recent surge, have usually resulted in higher prices.
|
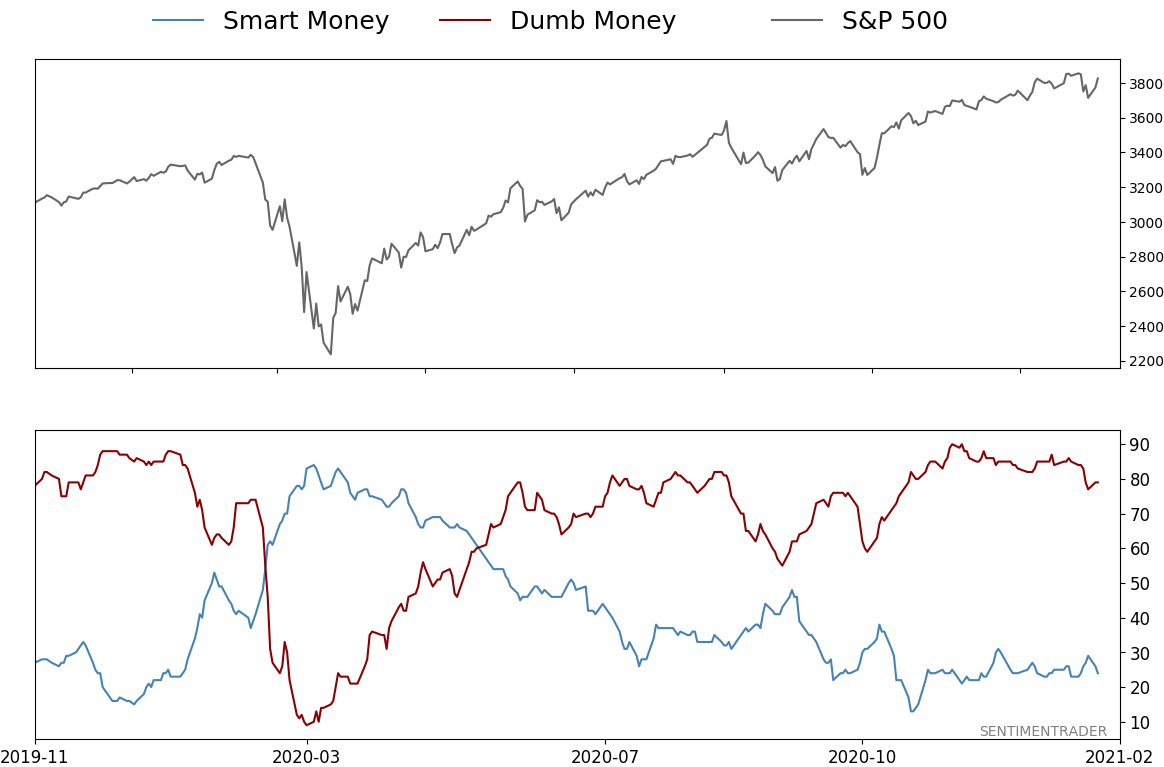
Smart / Dumb Money Confidence
|
Smart Money Confidence: 24%
Dumb Money Confidence: 79%
|
|
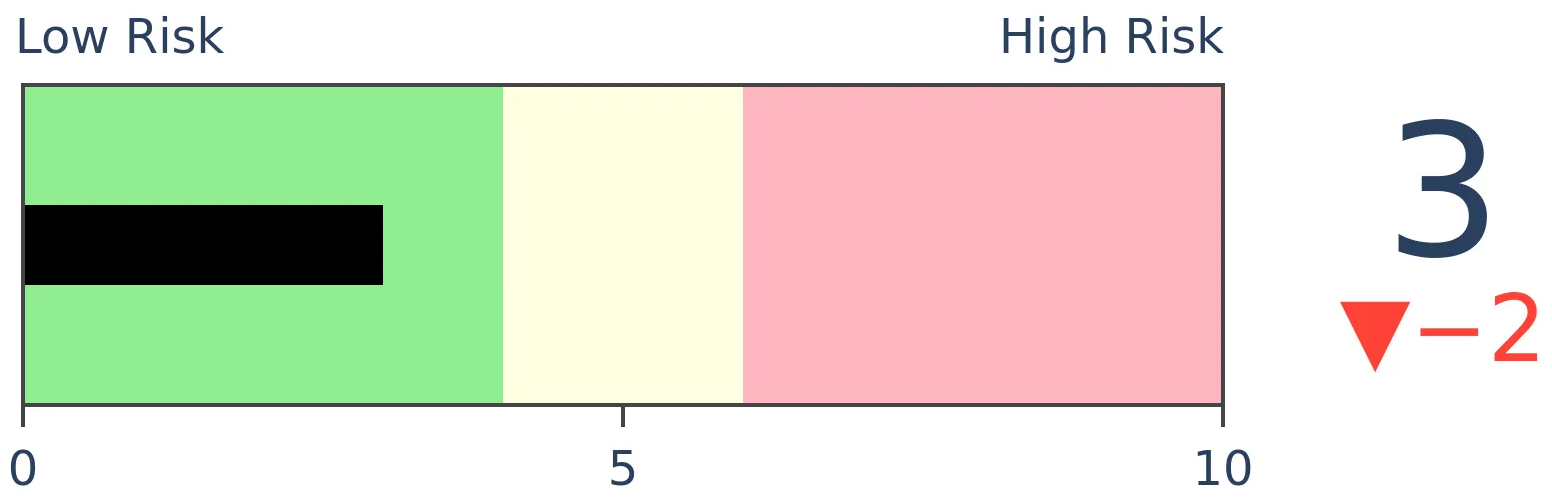
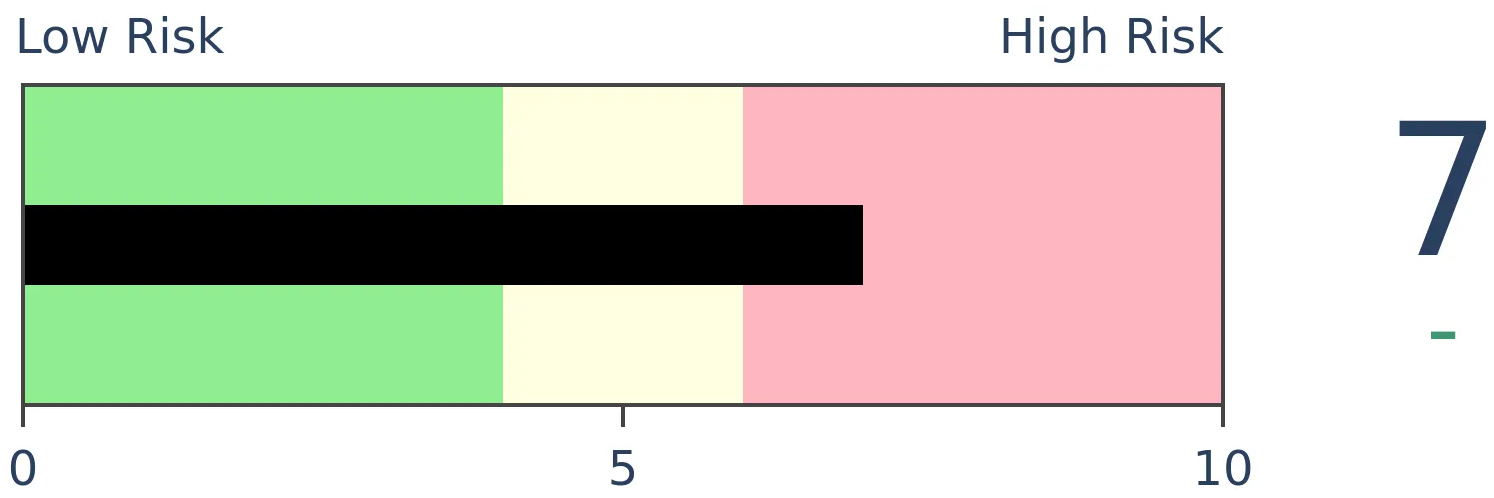
Risk Levels
Stocks Short-Term

|
Stocks Medium-Term
|
|
Bonds

|
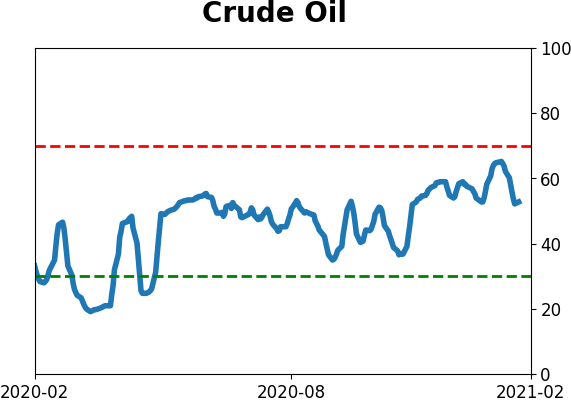
Crude Oil

|
|
Gold
|
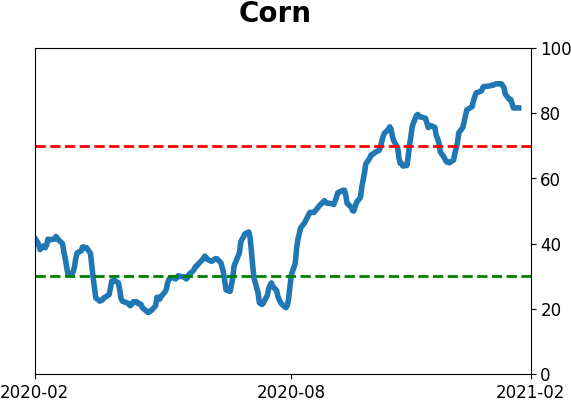
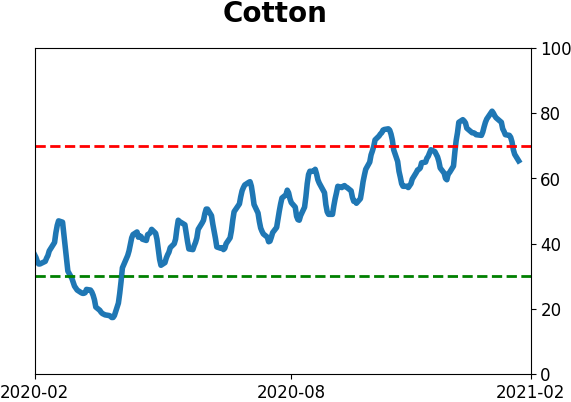
Agriculture
|
|
Research
BOTTOM LINE
The S&P 500 suffered a key reversal week last week, as it finally dropped below its 50-day moving average. Barely 40% of stocks within the index have held above their own averages, a threshold that has been an important level to watch.
FORECAST / TIMEFRAME
None
|
It's been a couple of days since the dust settled on last week, and stocks managed to rebound strongly.
This is a little bit unusual since last week was a negative Key Reversal Week, with a higher high, but lower low and lower close.
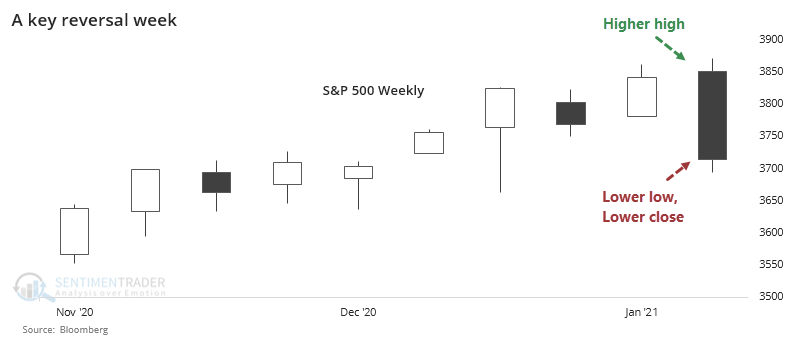
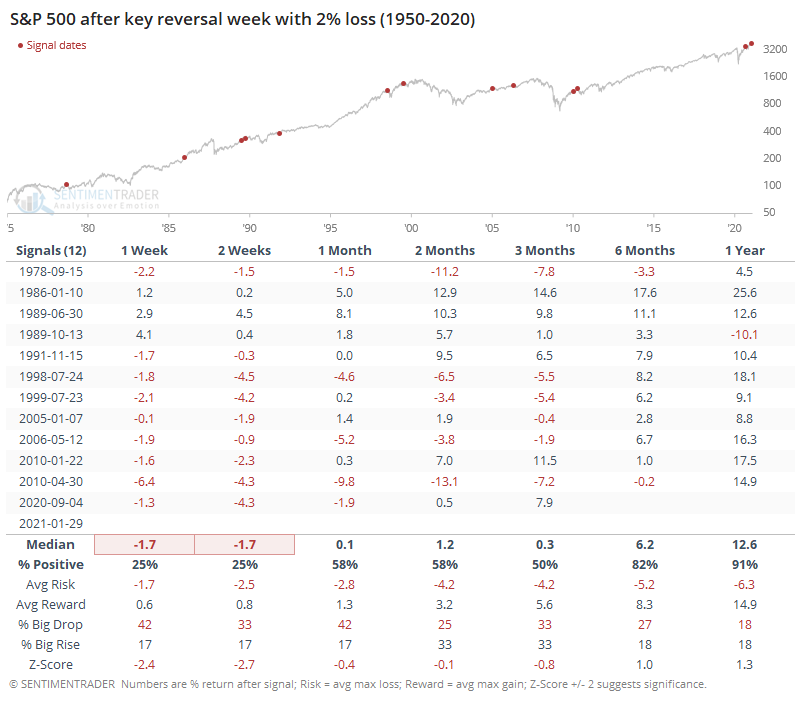
A week like that has had consistently negative overtones for the weeks ahead when the closing loss was more than 2% for the week.
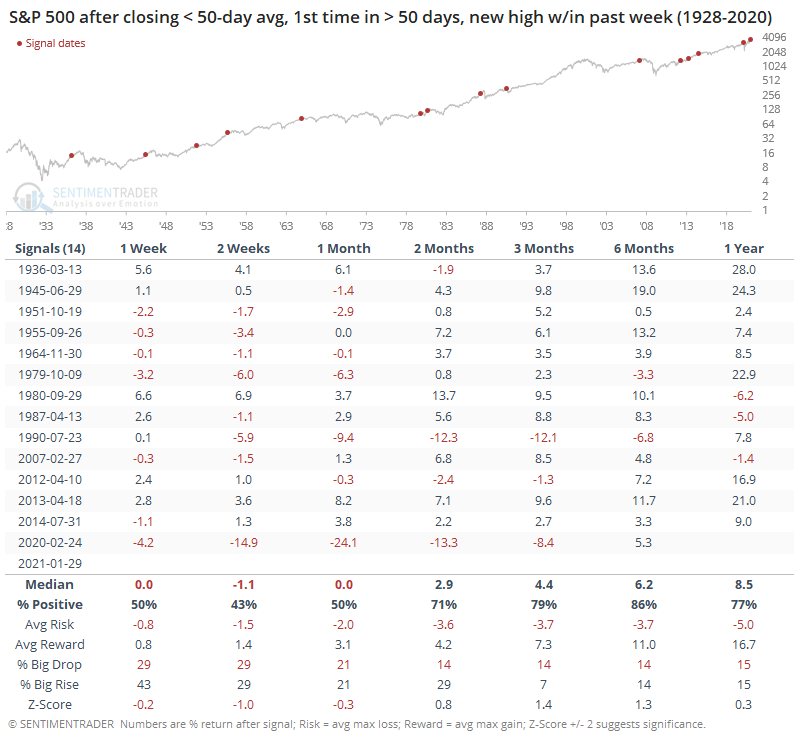
In the process, the S&P 500 lost its 50-day moving average. That's the first time it had been below its 50-day in more than 50 sessions, a relatively long streak when occurring after what had just been a 52-week high. Other times its medium-term trend shifted like this, the ndex struggled in the shorter-term but it was not a consistent longer-term sell signal.
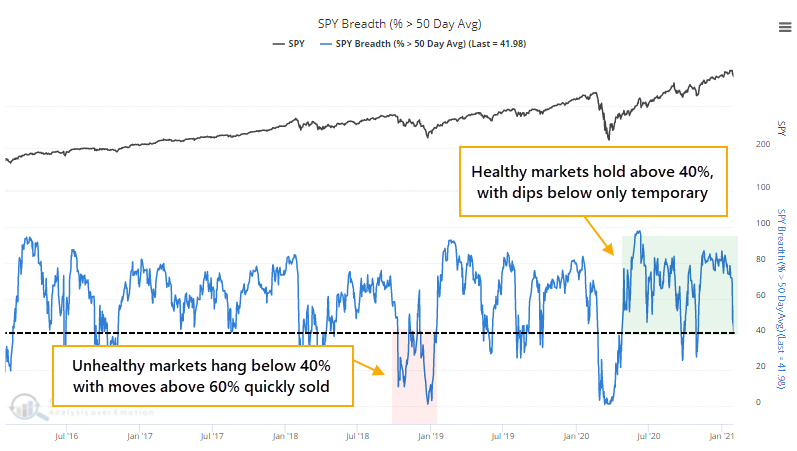
As we saw last week, there was a quick and substantial pullback in the percentage of stocks within the S&P that were above their own 50-day moving averages. That corrected further on Friday, and stopped right around the 40% level. In healthy market environments, this is about where it tends to stop as buyers tend to step in quickly and that's about it for the pullbacks. It appears the same thing happened this time, though it's still too early to tell.
During unhealthy environments, we consistently see fewer than 40% of stocks above their averages, and moves above 60% tend to bring sellers in quickly. So far, this still looks healthy.
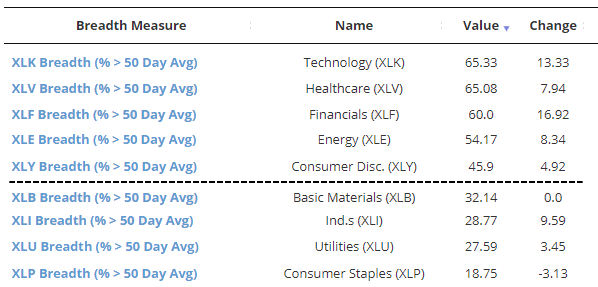
The percentage of industries and sectors above their 50-day averages both plunged below 40%, so that bears watching. More than 40% of countries are still above their average, so that's a bit of a positive.

Among sectors, it's mostly the defensive ones that are seeing the fewest stocks above their 50-day averages, so there is still evidence of a risk-on mentality.
So far, there isn't much evidence that this is anything other than a pullback within a healthy environment. Some cracks are starting to show, and certainly the sentiment backdrop means the market is on shaky footing. But we need to see measures like this hold below key levels to have more confidence that there has been a true change in character.
Active Studies
| Time Frame | Bullish | Bearish | | Short-Term | 0 | 0 | | Medium-Term | 2 | 4 | | Long-Term | 15 | 2 |
|
Indicators at Extremes
Portfolio
| Position | Description | Weight % | Added / Reduced | Date | | Stocks | 8.7% RSP | 8.7 | Reduced 28.8% | 2021-01-26 | | Bonds | 9.5% ANGL, 9.1% SCHP, 9.0% BND | 27.6 | Reduced 0.2% | 2021-01-26 | | Commodities | GCC | 2.3 | Reduced 2.1%
| 2020-09-04 | | Precious Metals | GDX | 8.9 | Added 4.8% | 2020-12-01 | | Special Situations | 10.3% XLE, 8.9% PSCE | 19.2 | Added 19.2% | 2021-01-26 | | Cash | | 33.4 | | |
|
Updates (Changes made today are underlined)
With a market that has seen the kinds of broad participation and big breath thrusts like we did in the fall, it's hard to become too negative. Those kinds of conditions have consistently preceded higher returns over the next 6-12 months. It's the interim that's more of an issue. Even conditions like that haven't prevented some shorter-term pullbacks. And when we combine an environment where speculation is rampant and recent days have seen an increase in cracks under the surface of the indexes, it's enough to become more defensive over a short- to medium-term time frame. We still don't have much confirmation from the price action in the indexes, so those who are more conservative would likely wait before increasing cash levels. In a bid to more closely align the portfolio with what most of our members consider "stocks", we have moved any sector-specific investments to the "special situations" category instead of "stocks." This way, the "stocks" category is essentially the most benchmarked index in the world, the S&P 500. RETURN YTD: 2.8% 2020: 8.1%, 2019: 12.6%, 2018: 0.6%, 2017: 3.8%, 2016: 17.1%, 2015: 9.2%, 2014: 14.5%, 2013: 2.2%, 2012: 10.8%, 2011: 16.5%, 2010: 15.3%, 2009: 23.9%, 2008: 16.2%, 2007: 7.8%
|
|
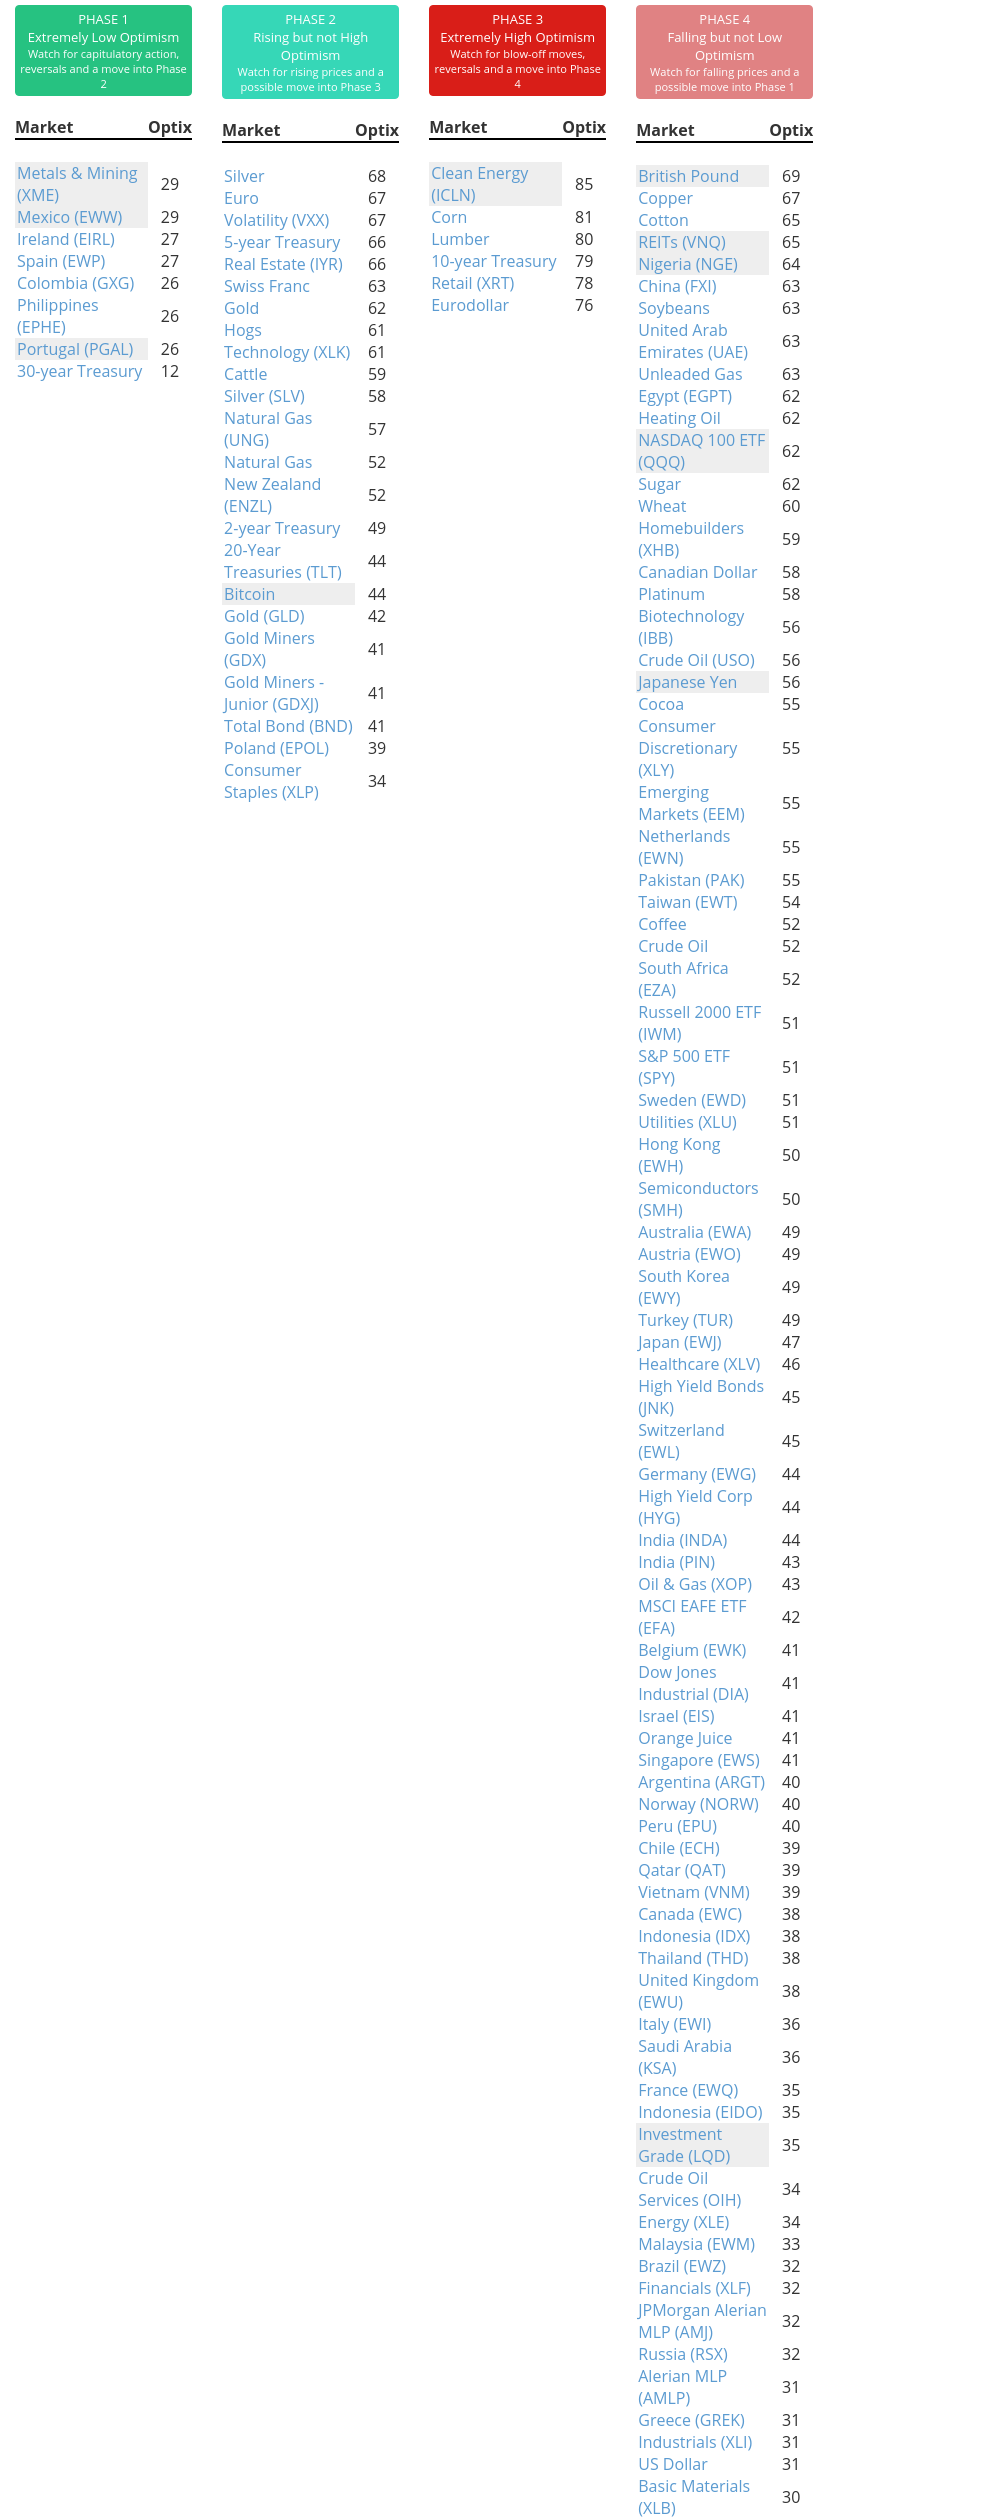
Phase Table
Ranks
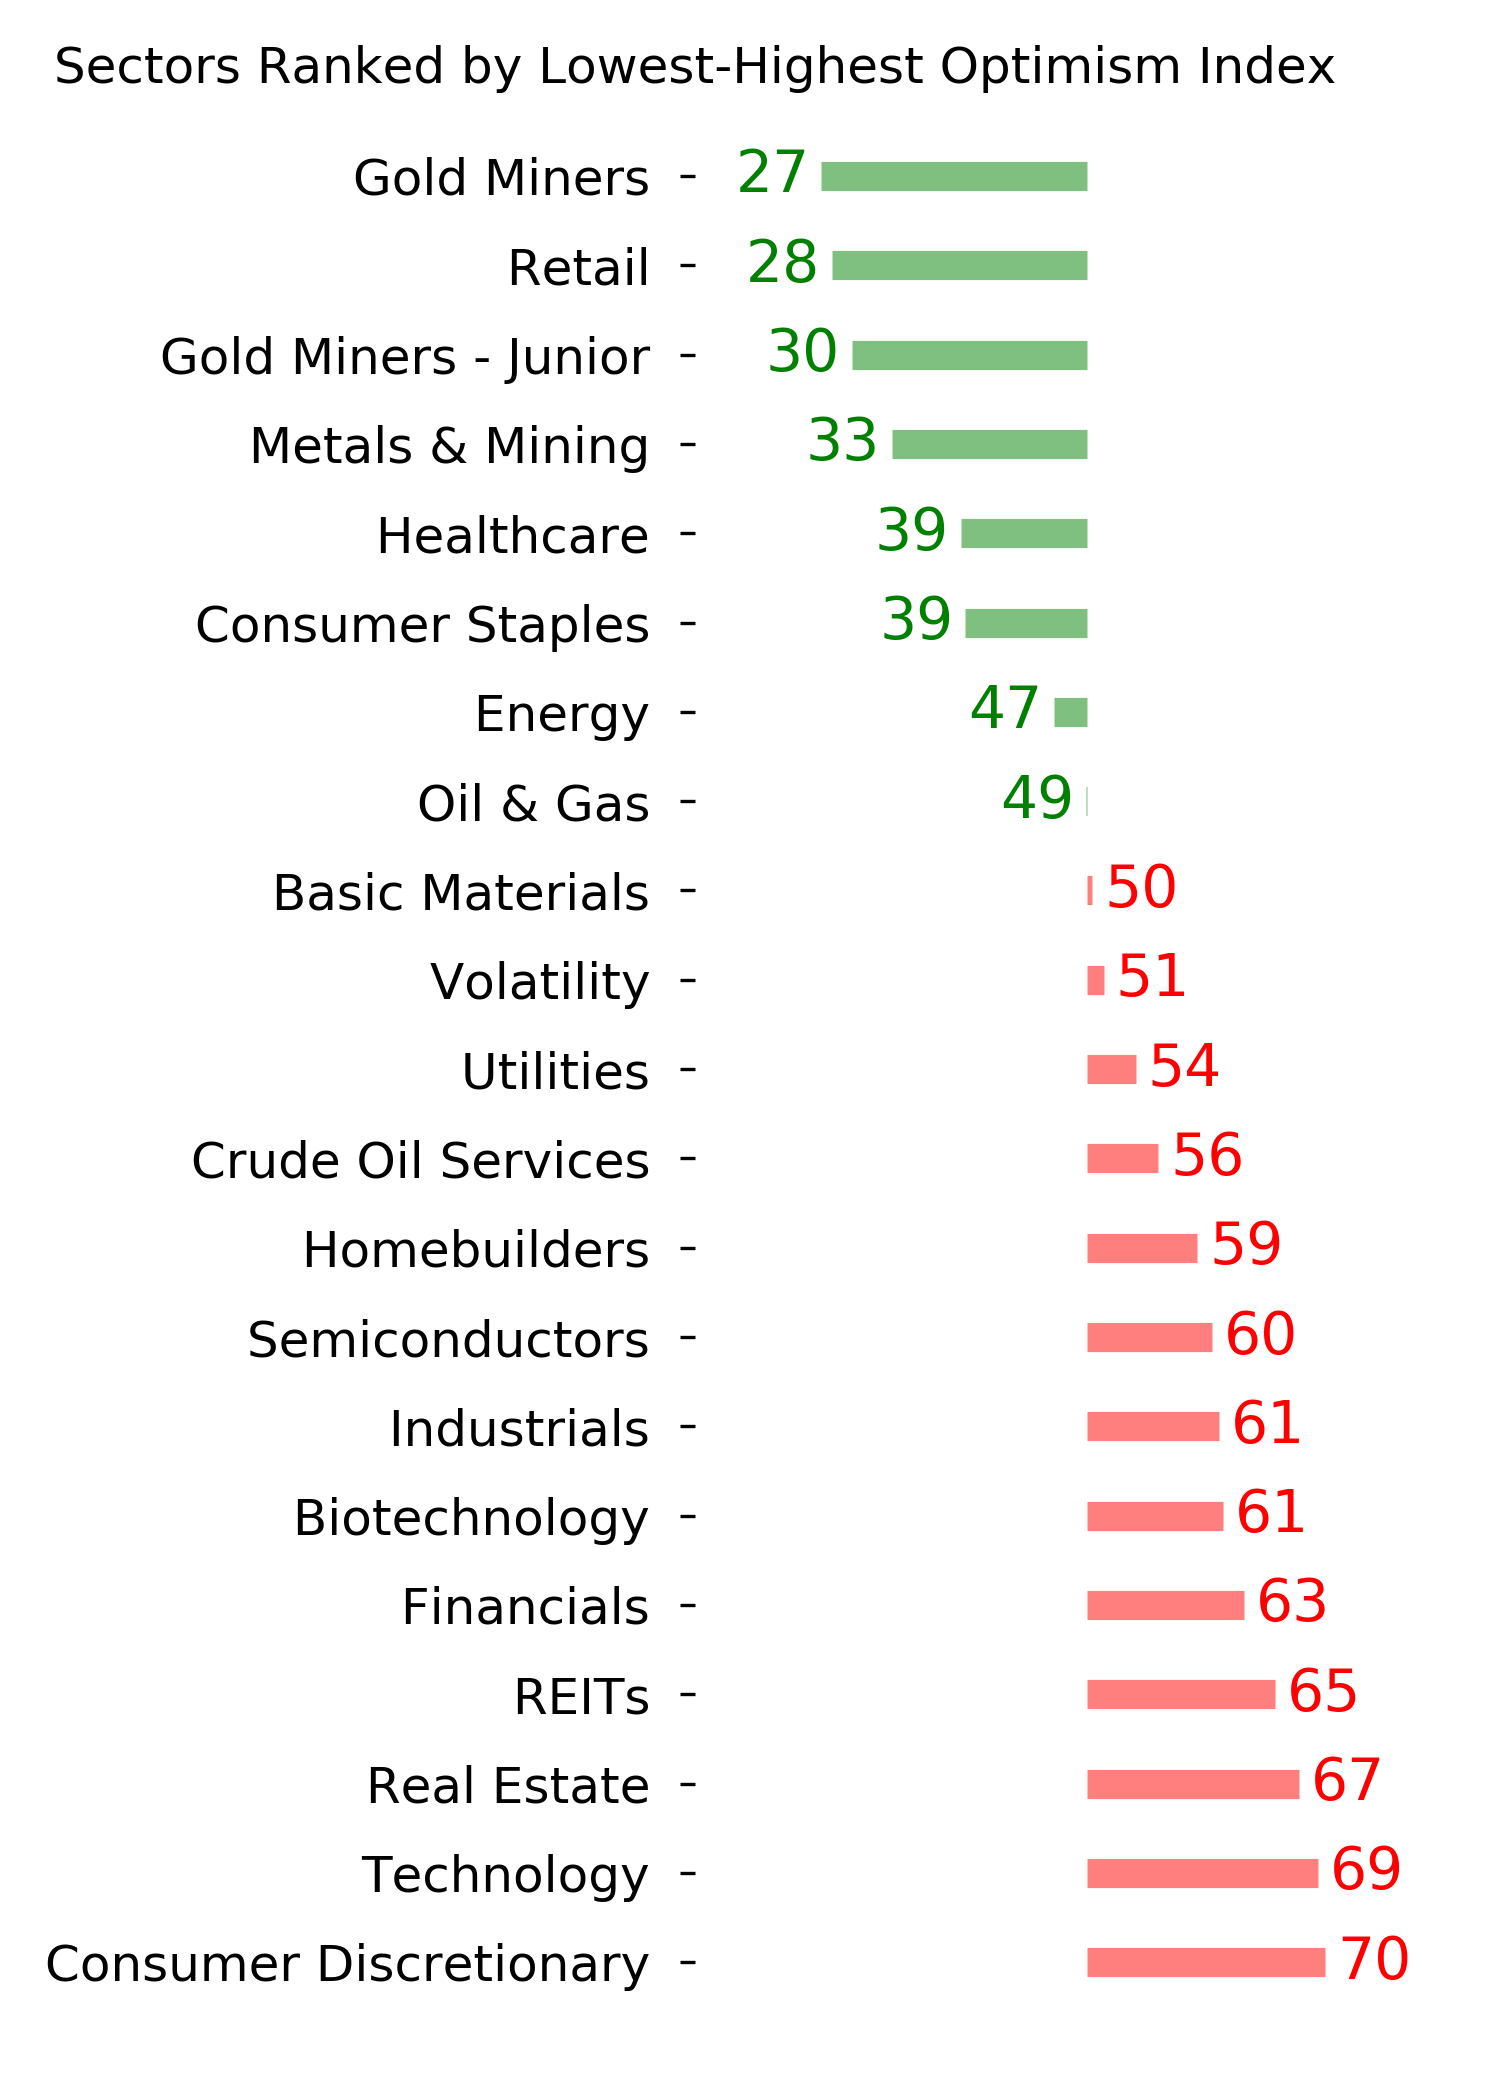
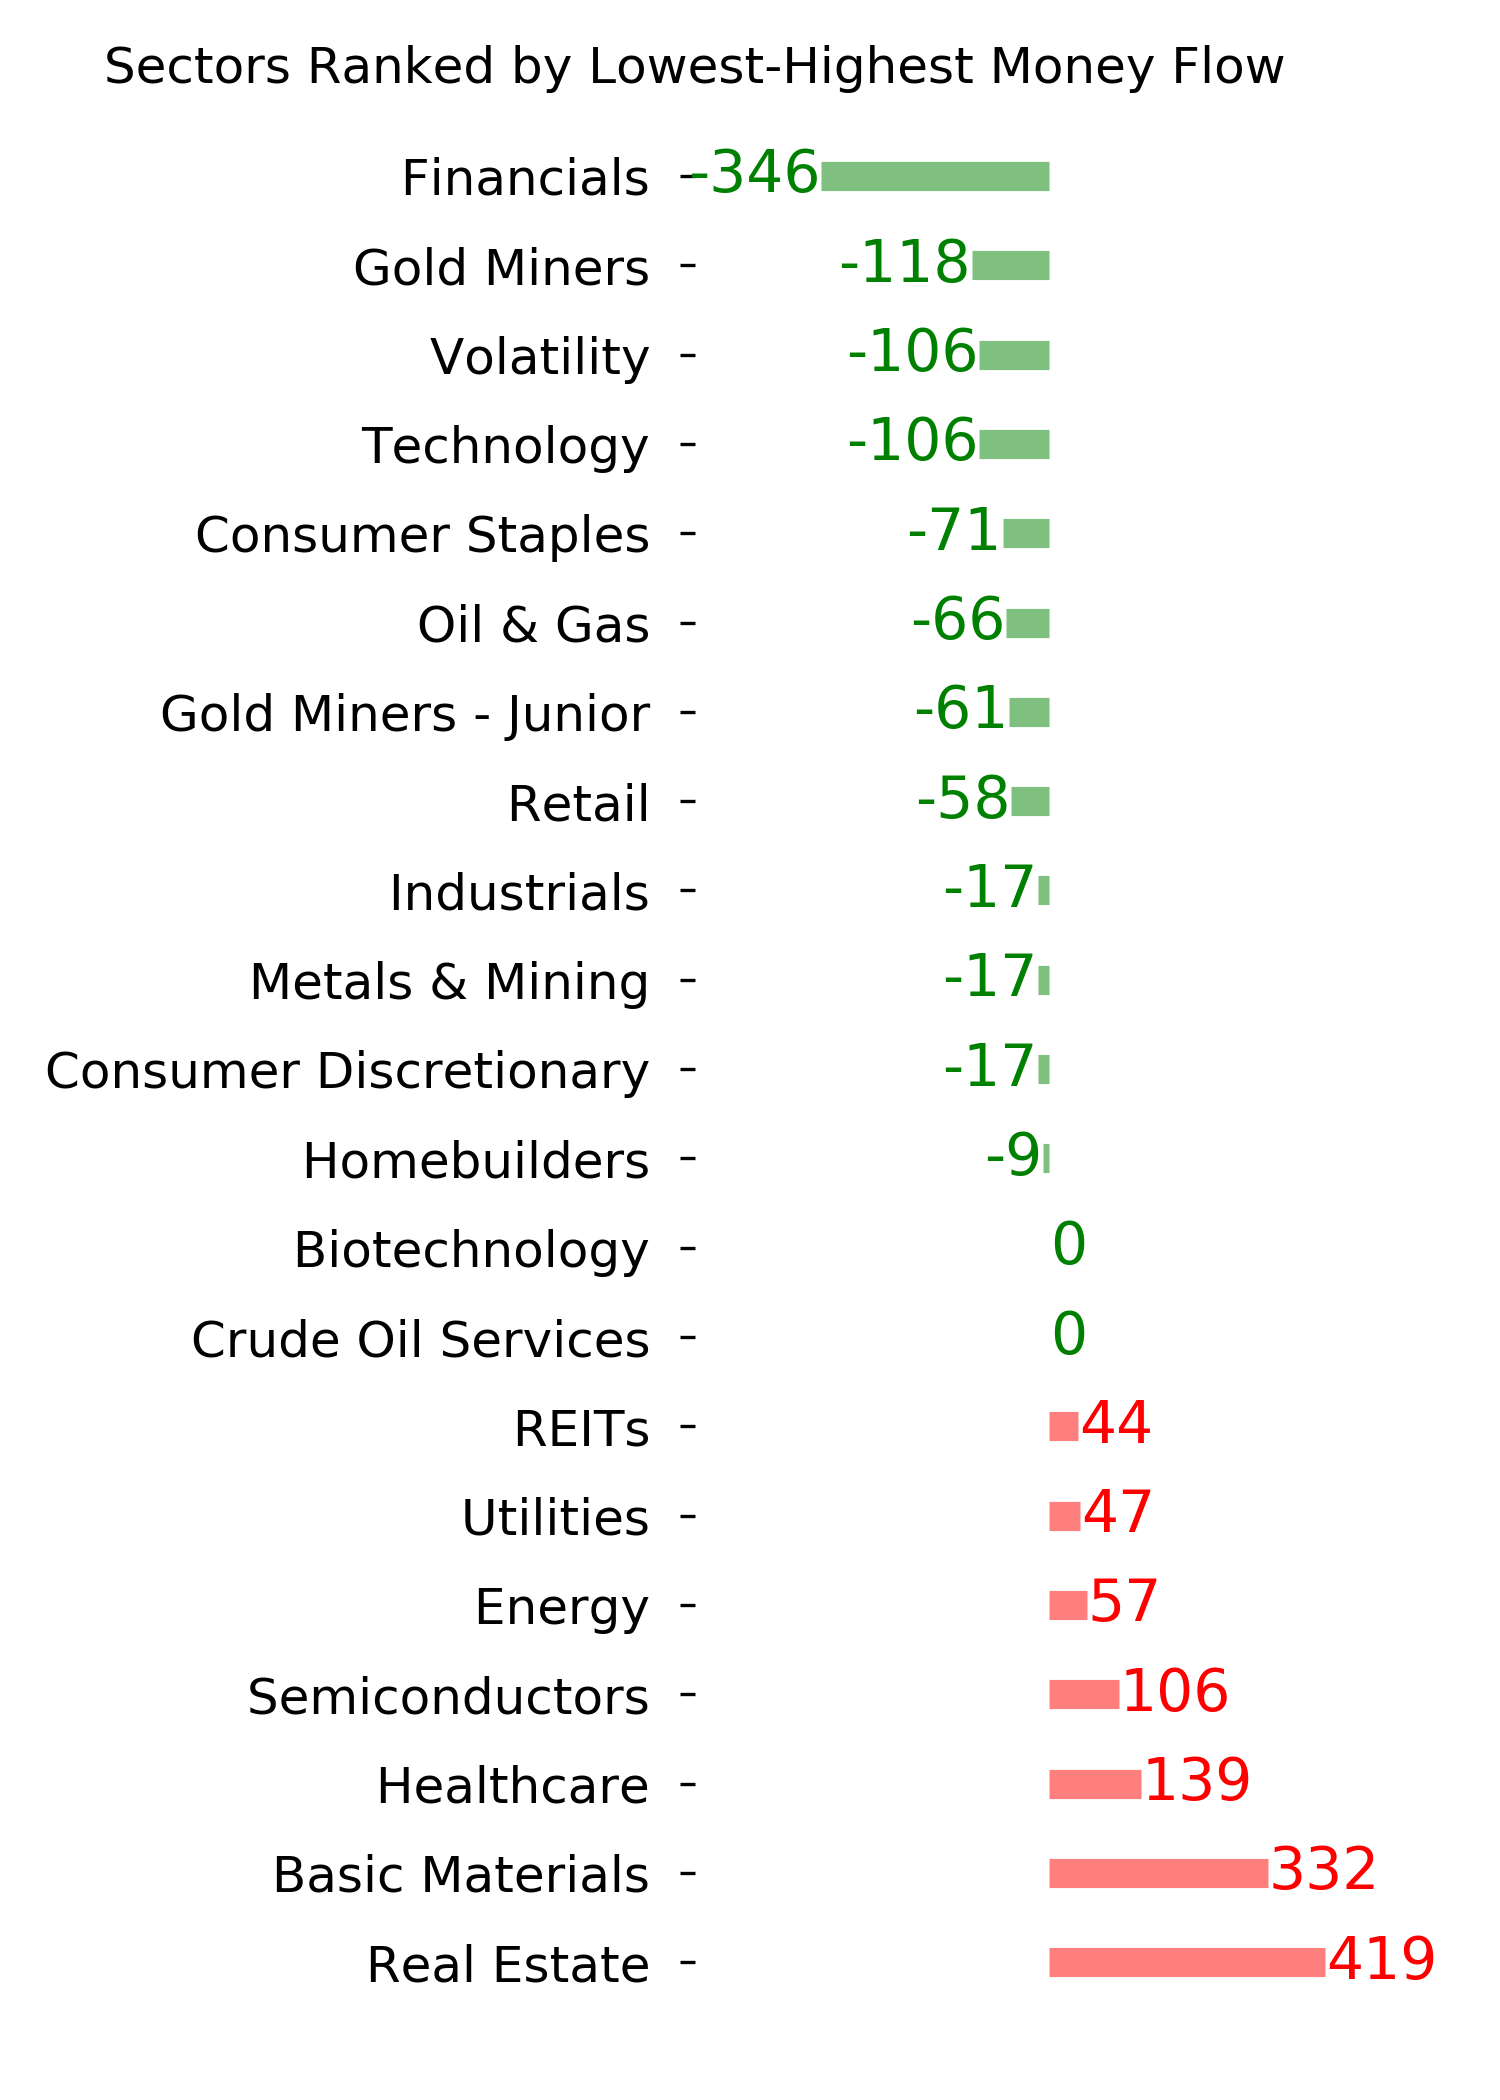
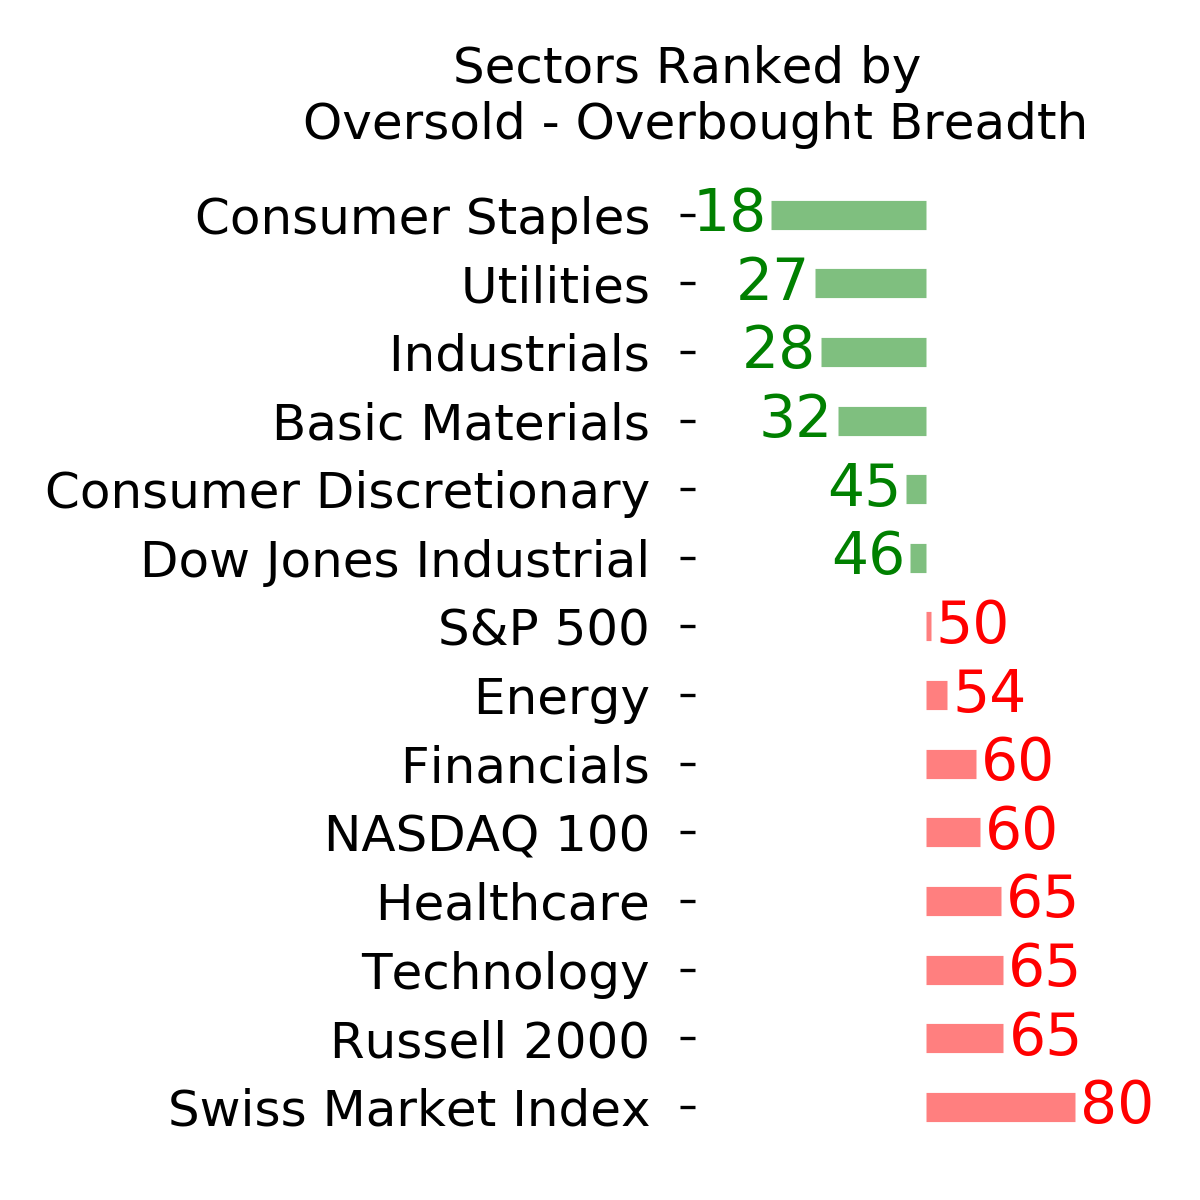
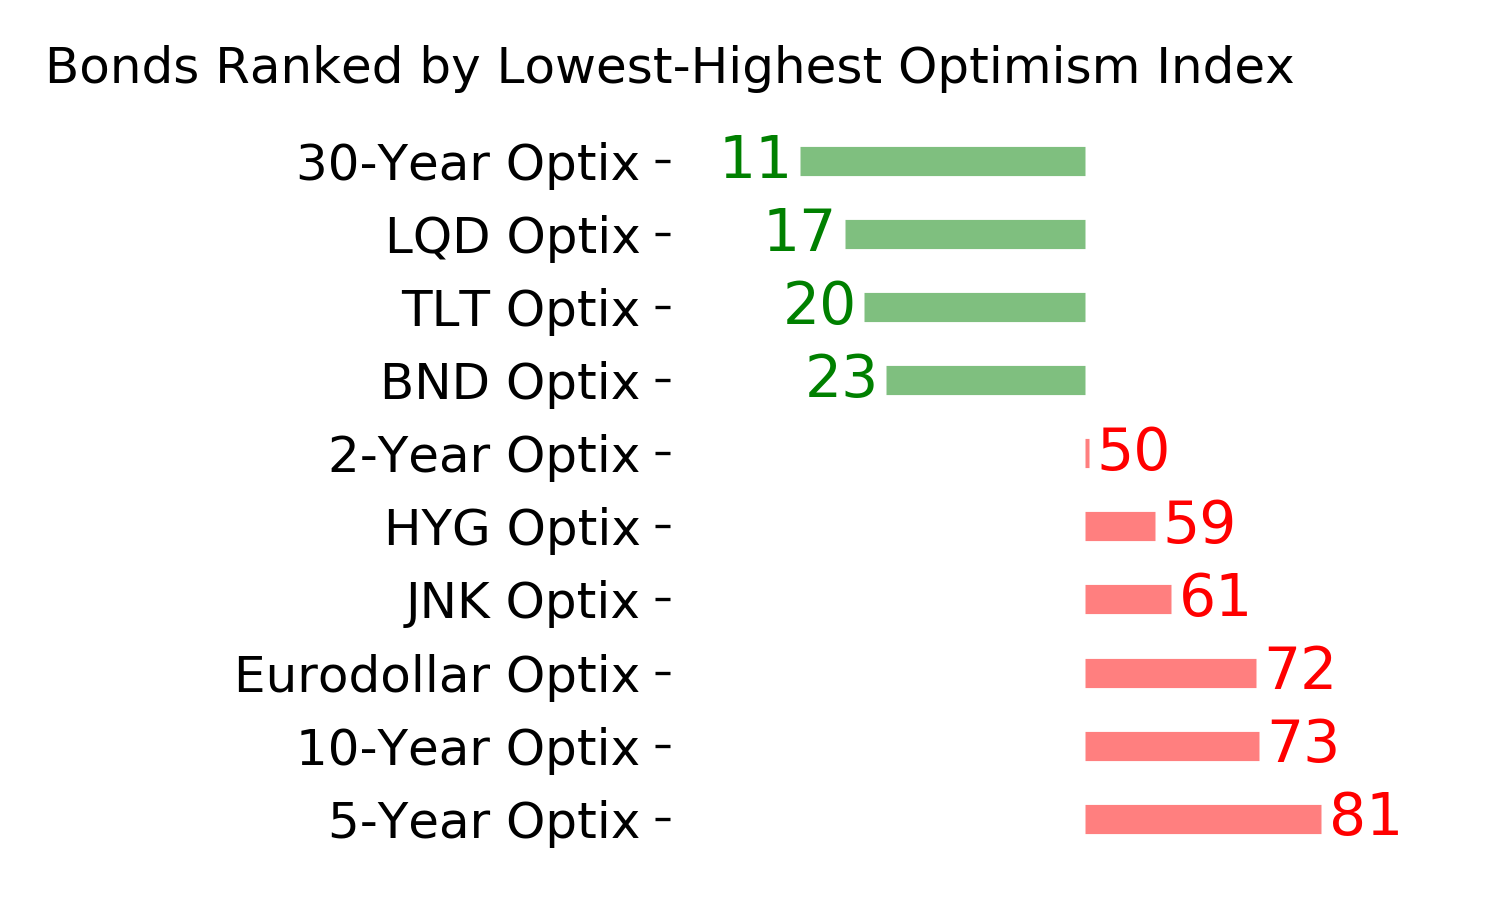
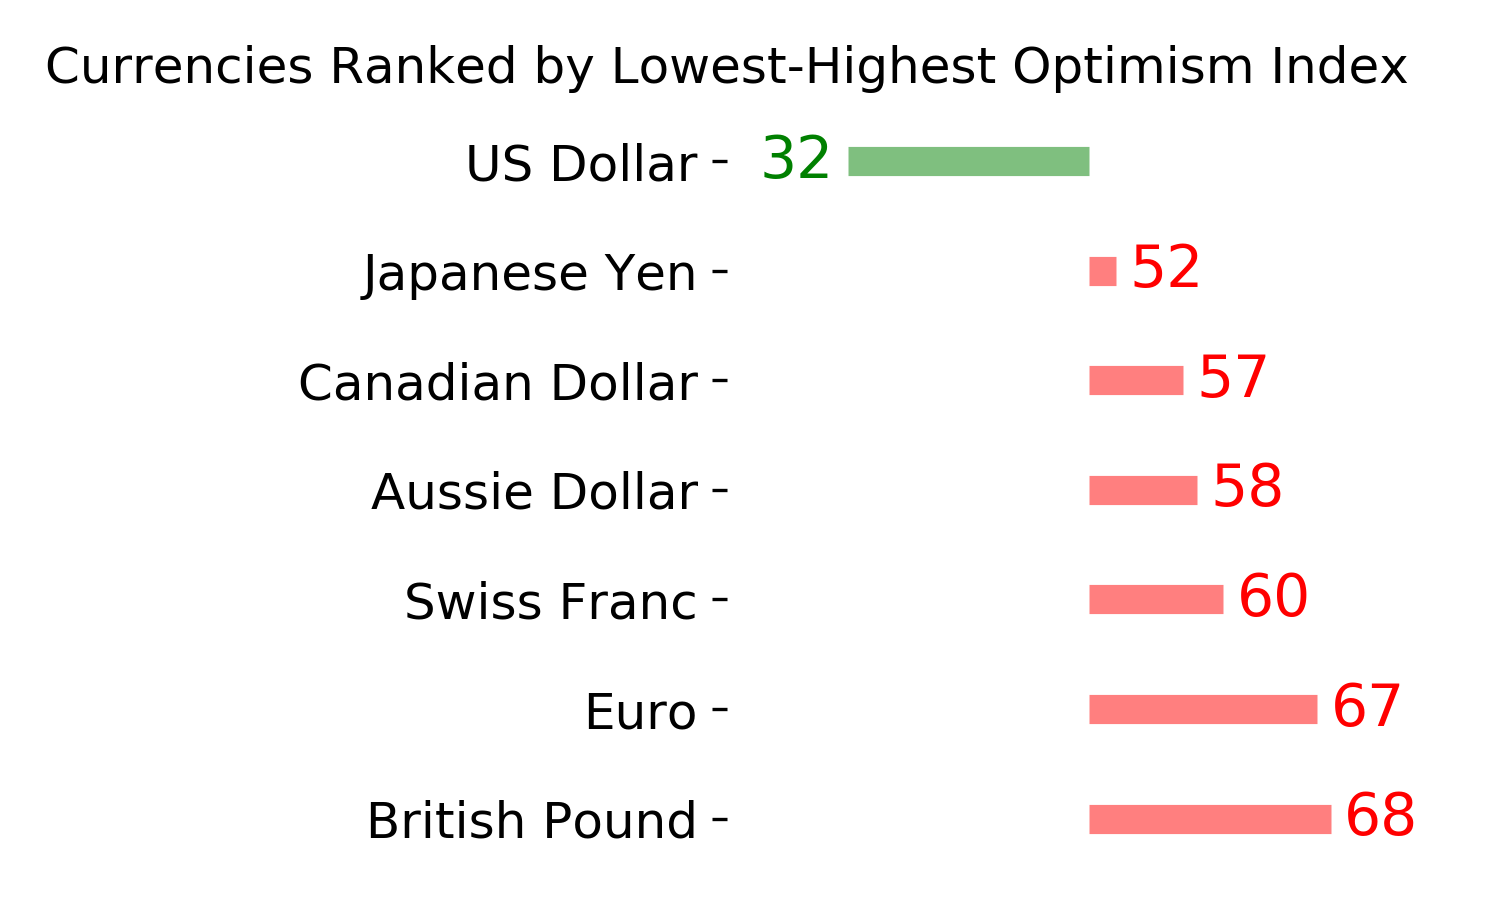
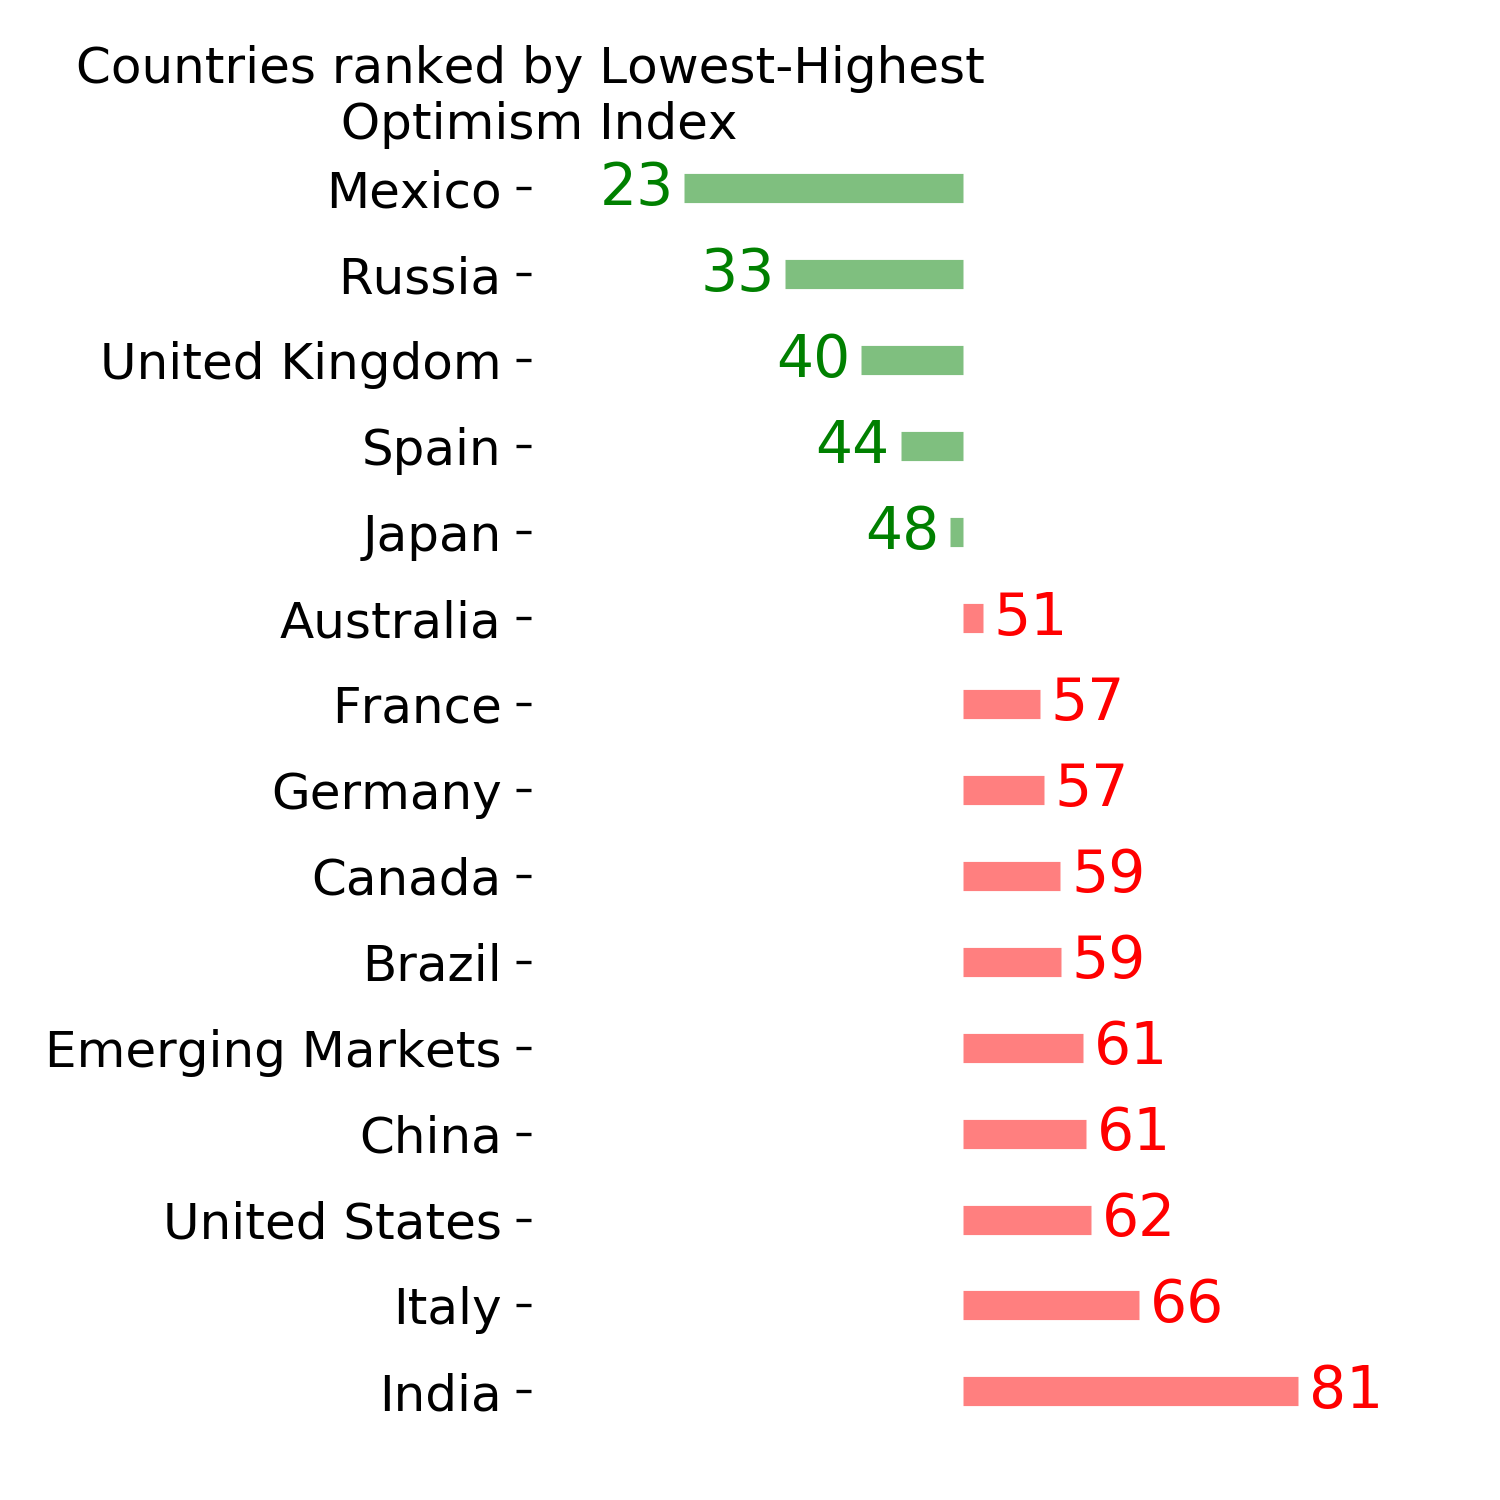
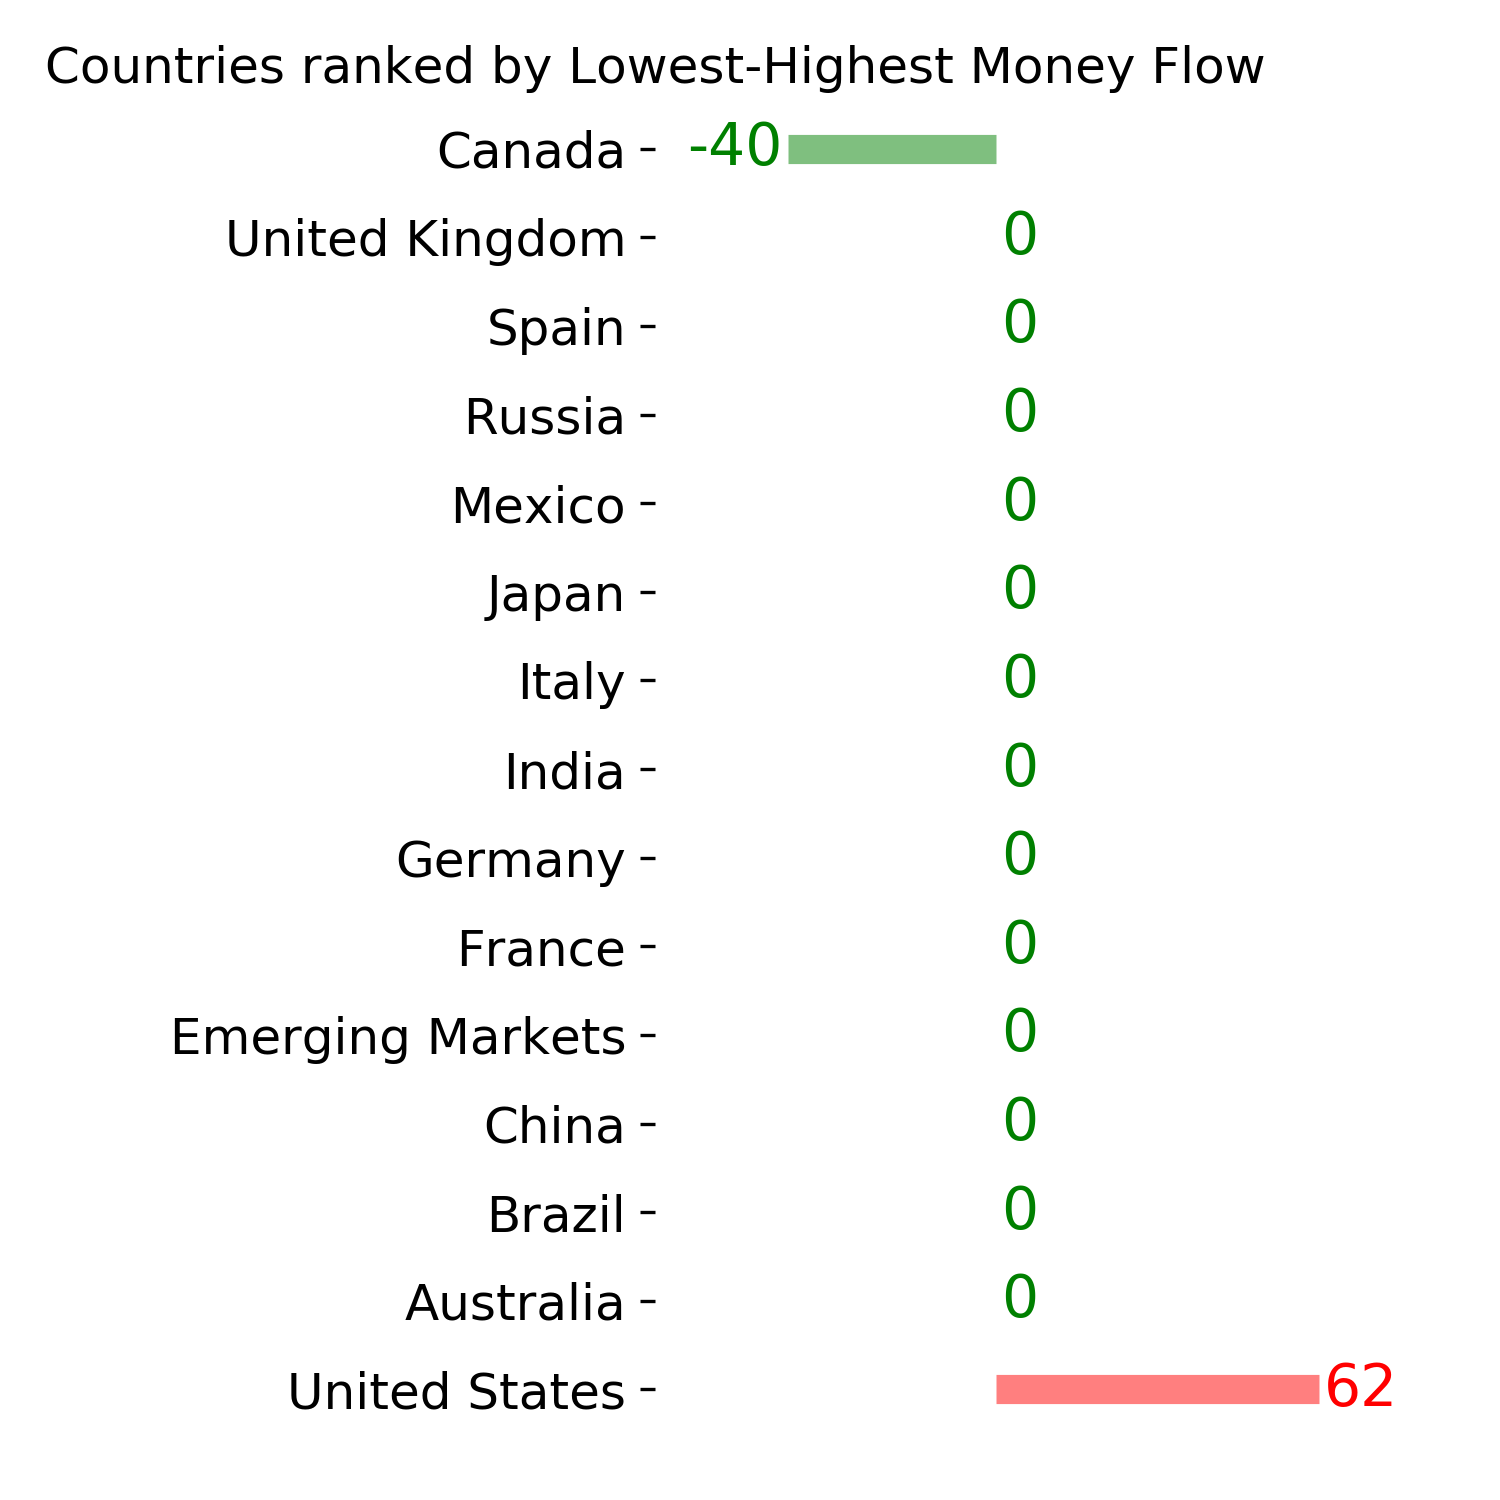
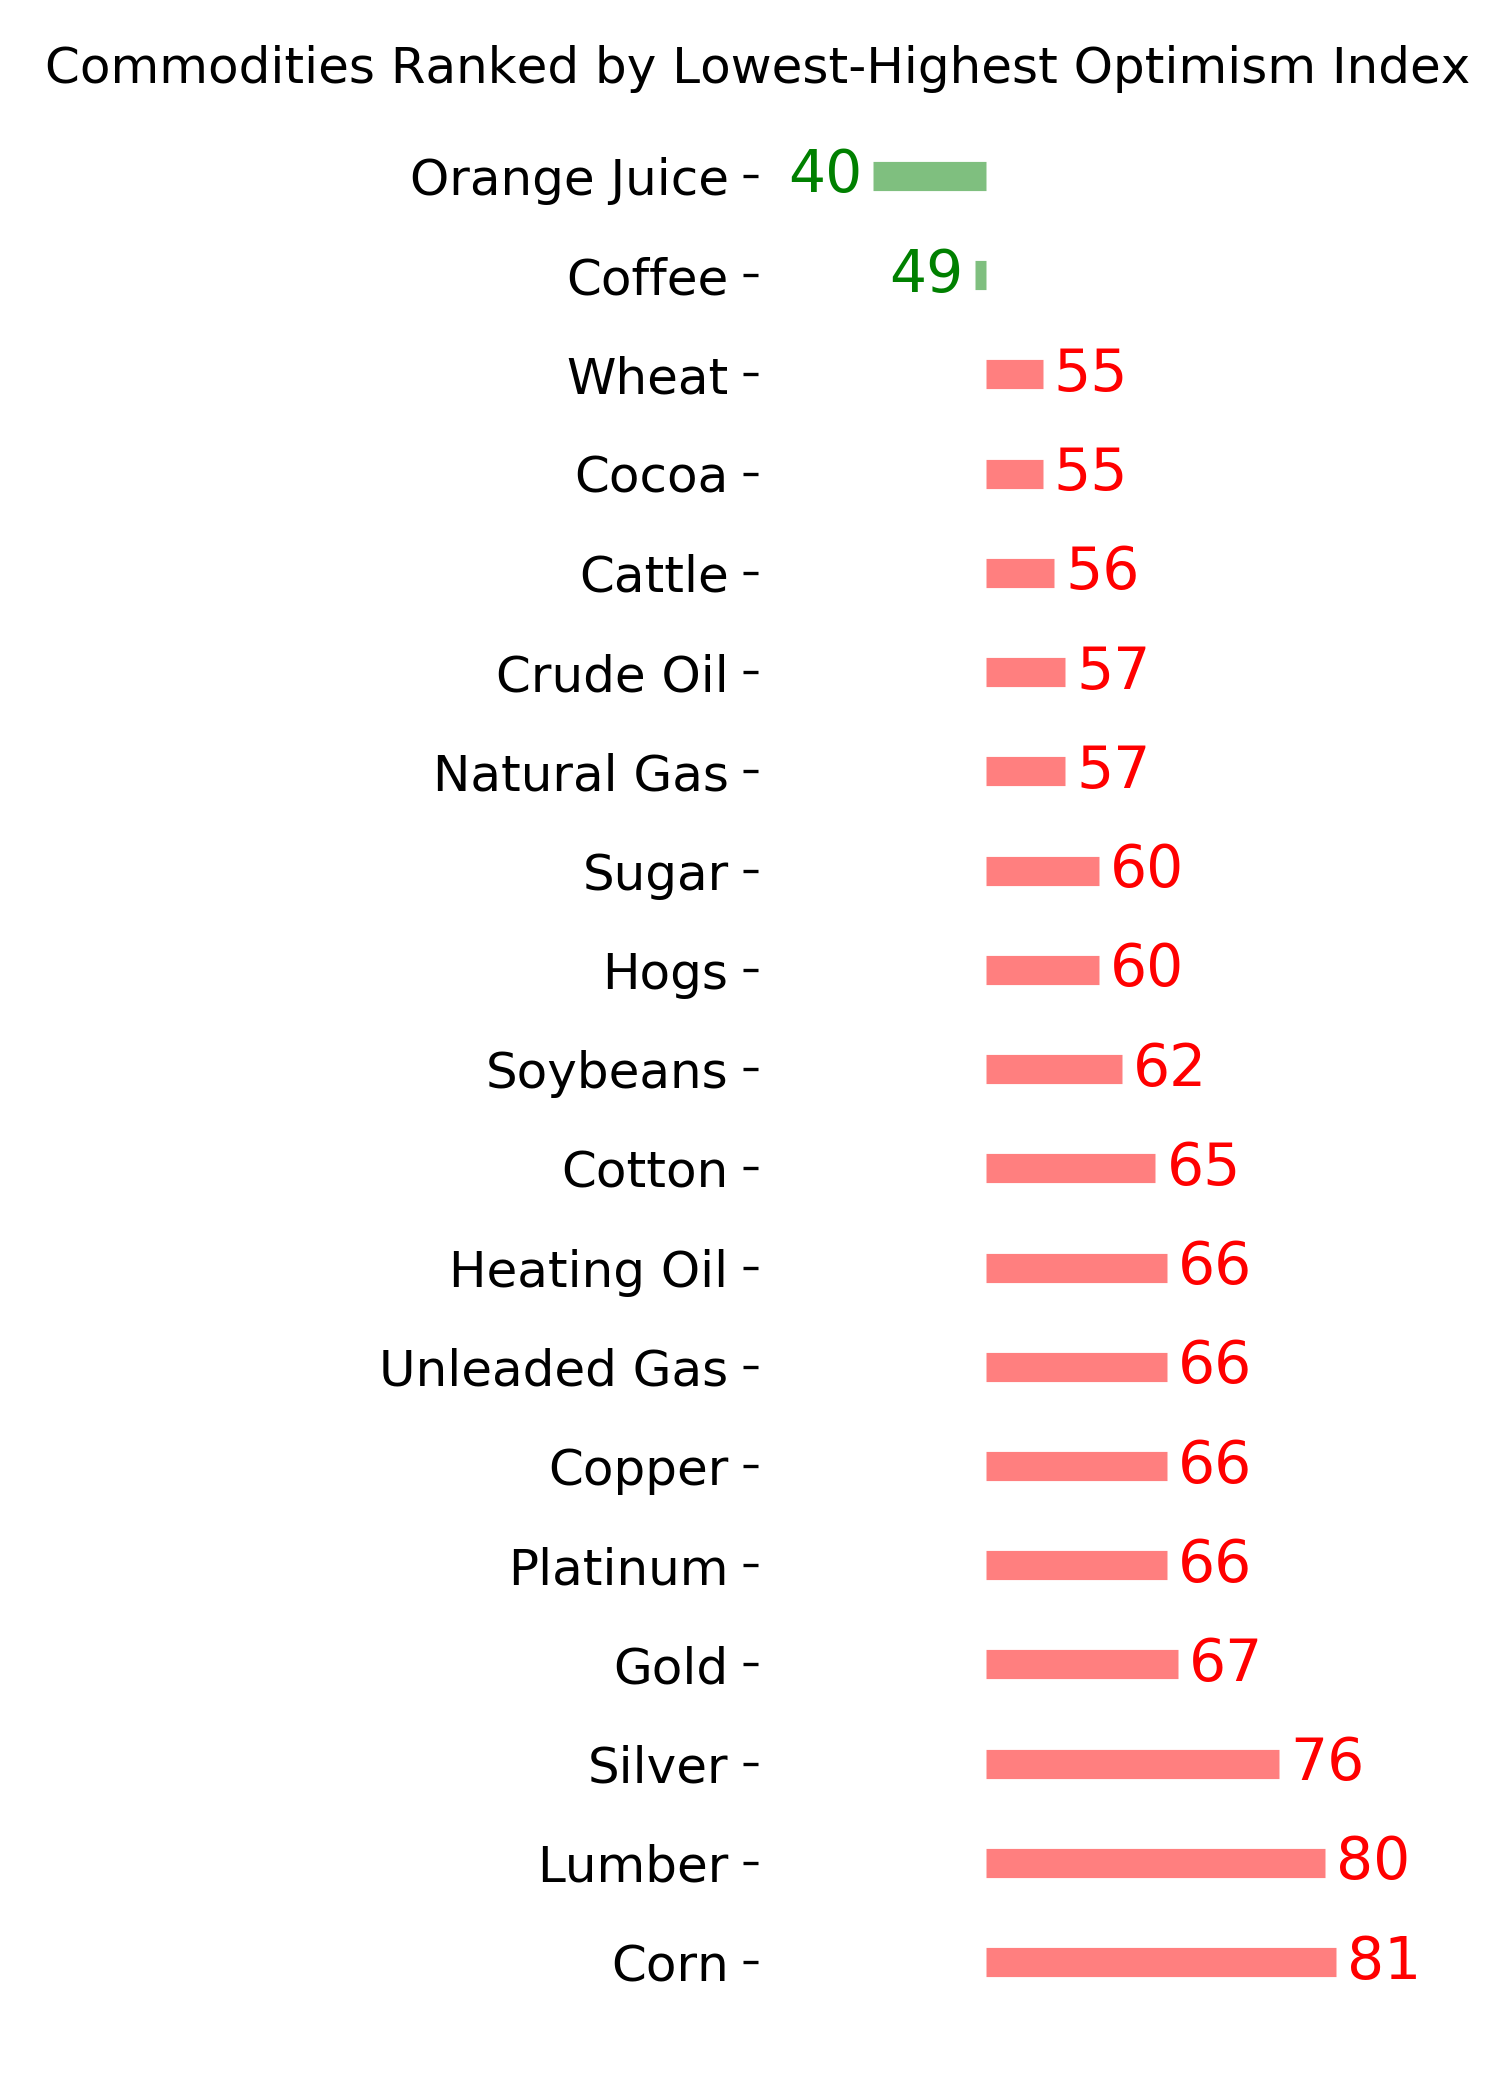
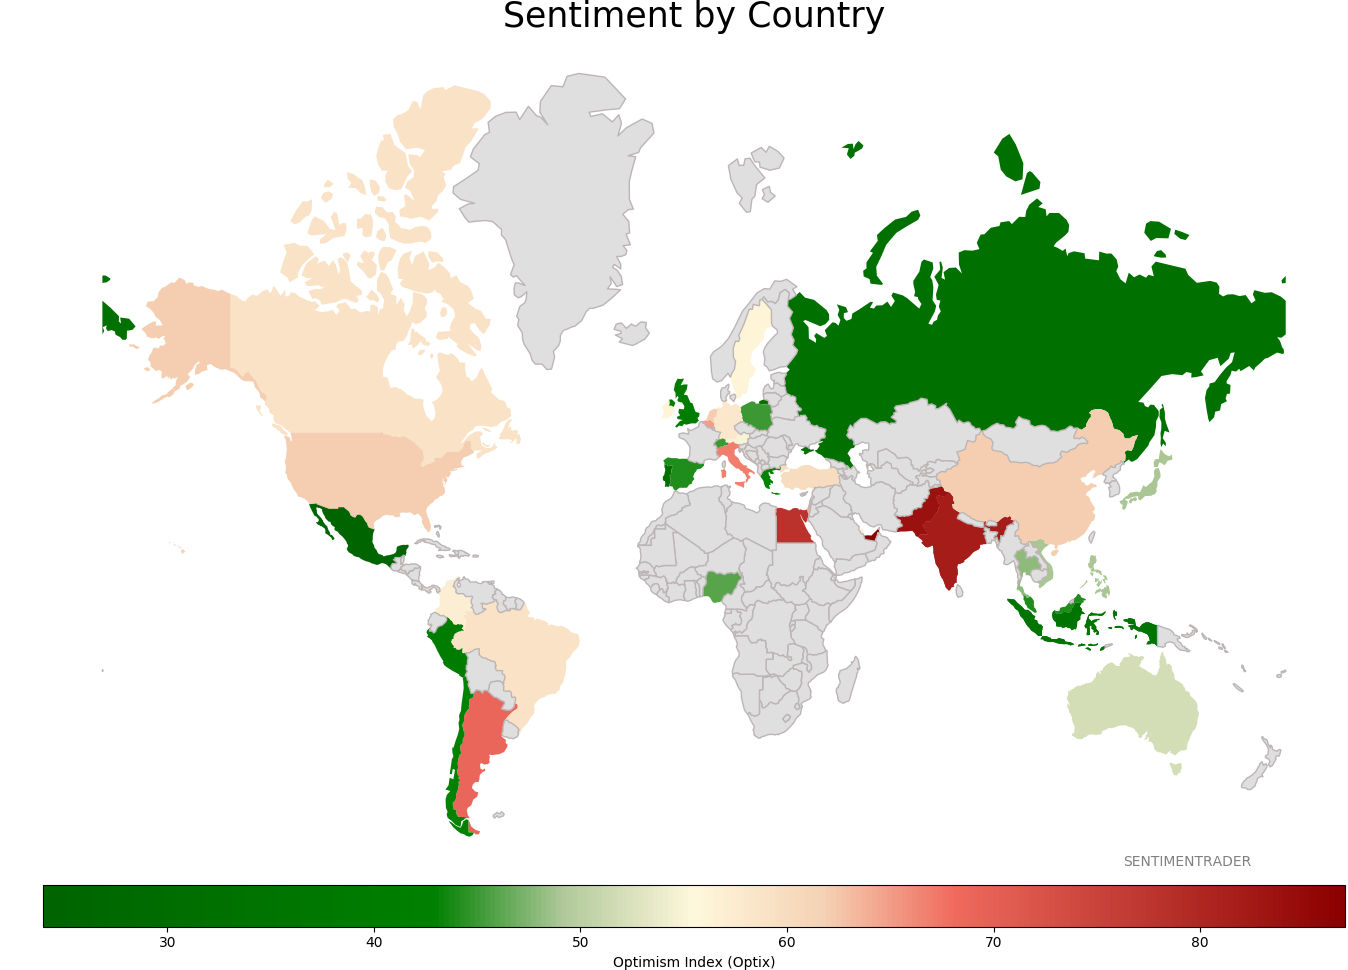
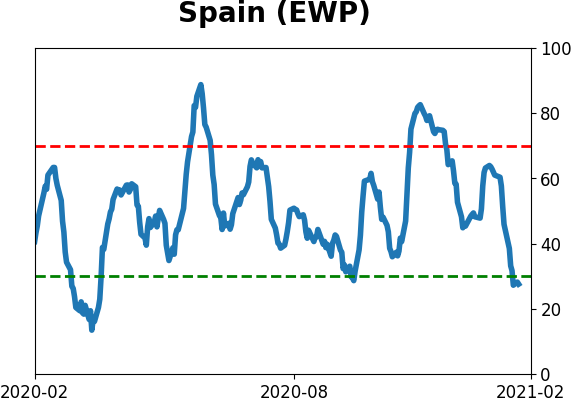
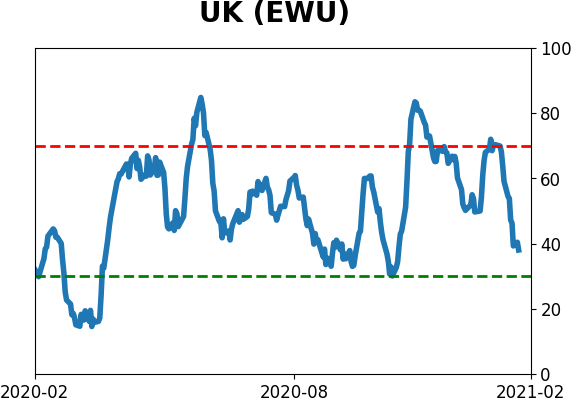
Sentiment Around The World
Optimism Index Thumbnails
|
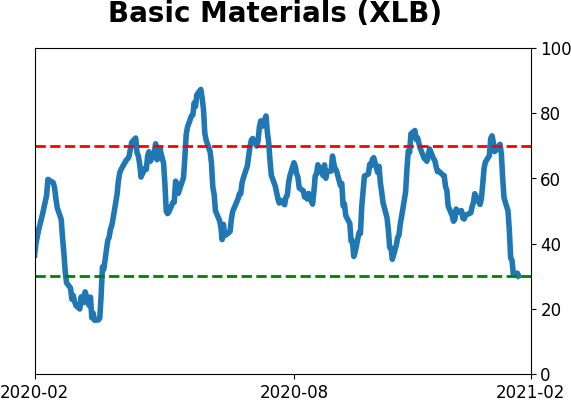
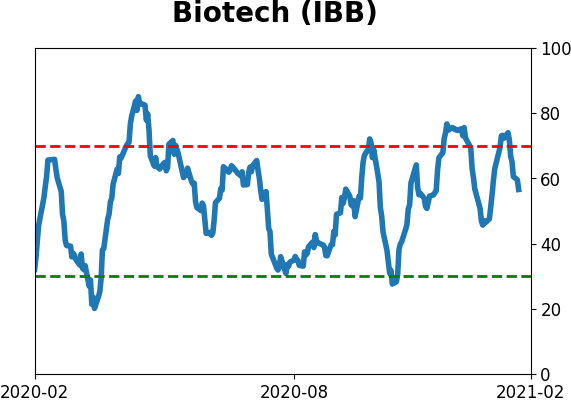
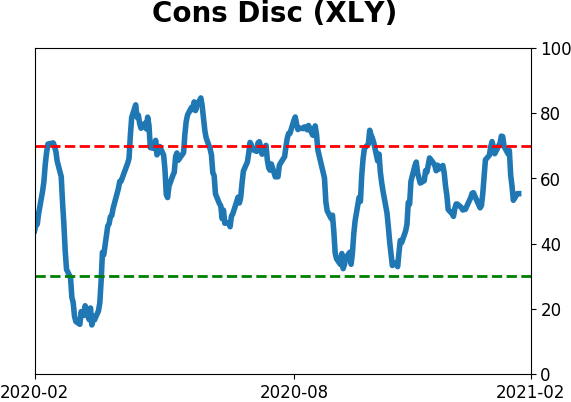
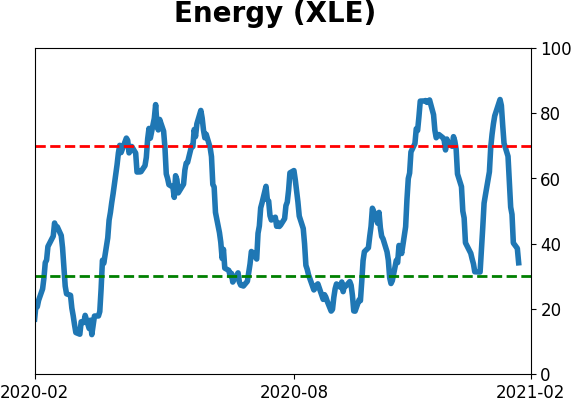
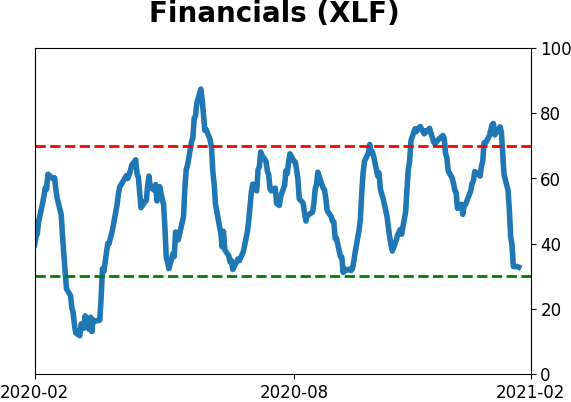
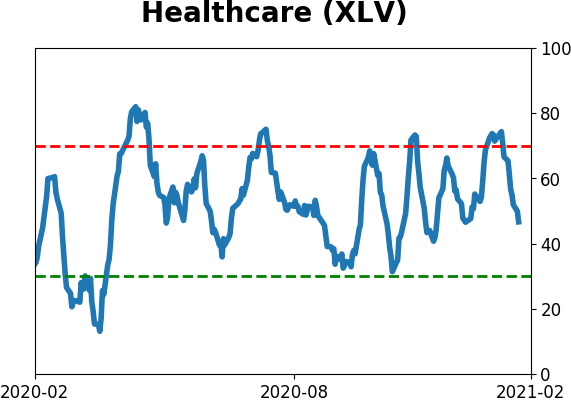
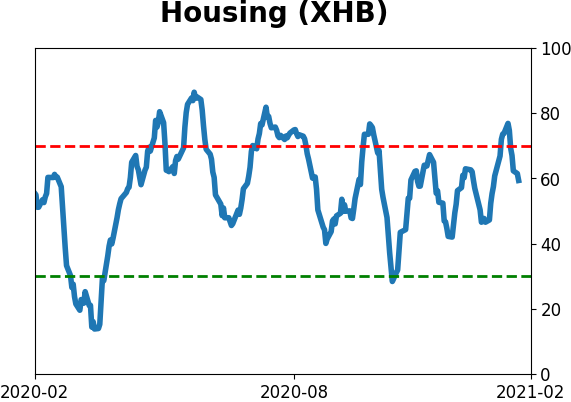
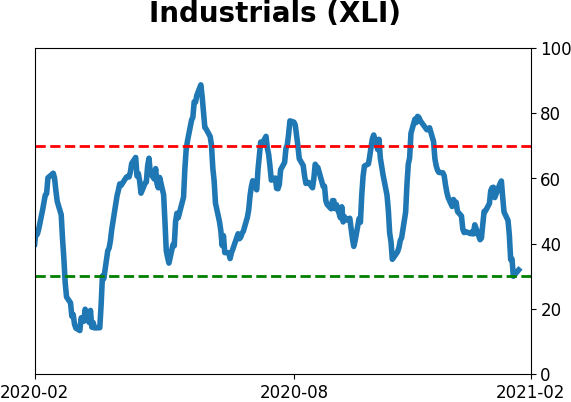
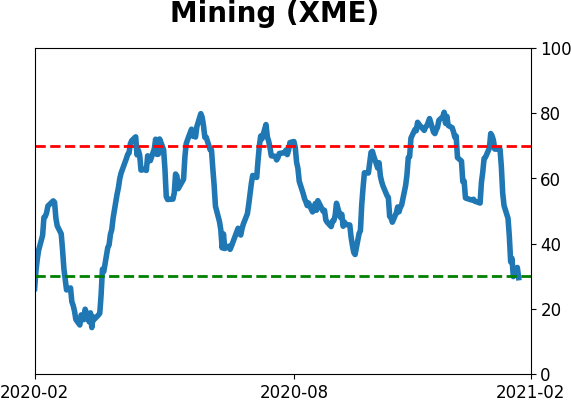
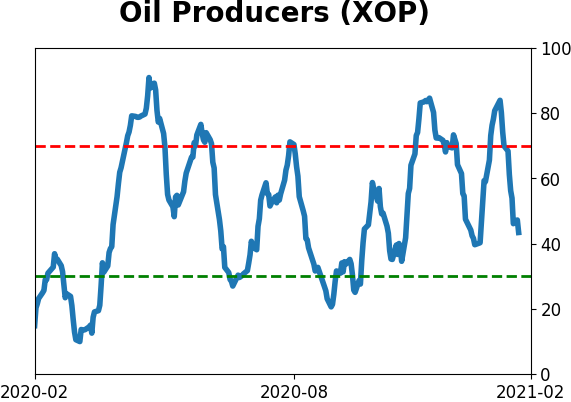
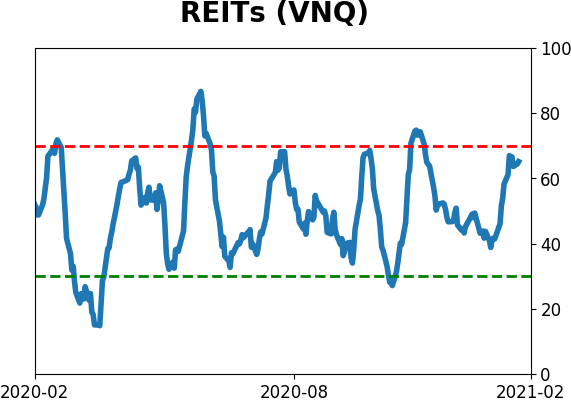
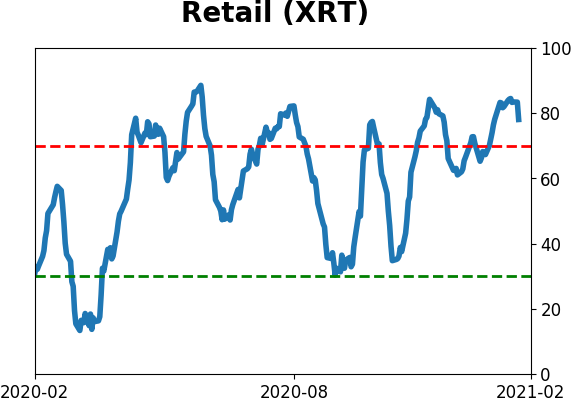
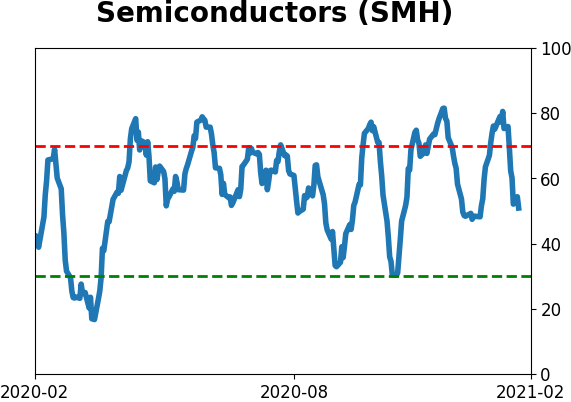
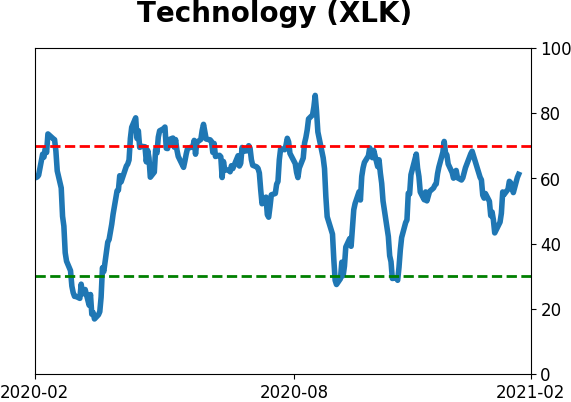
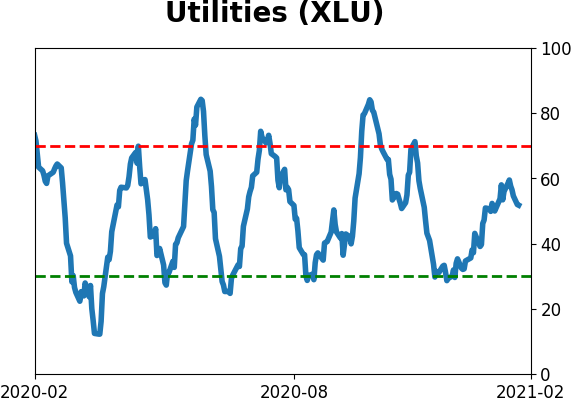
Sector ETF's - 10-Day Moving Average
|
|
|
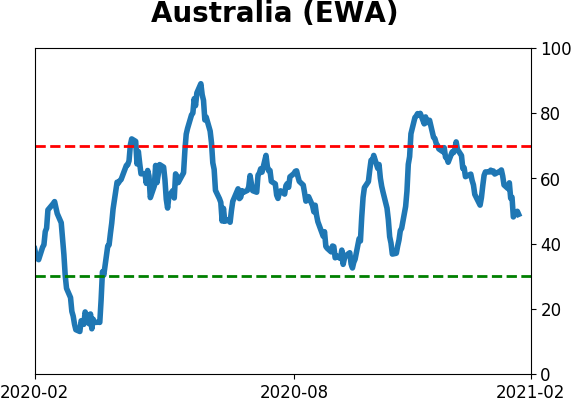
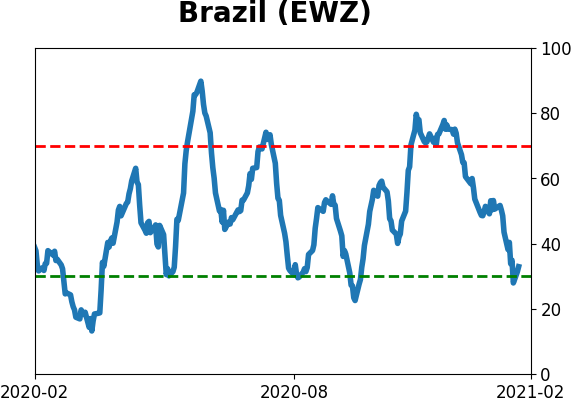
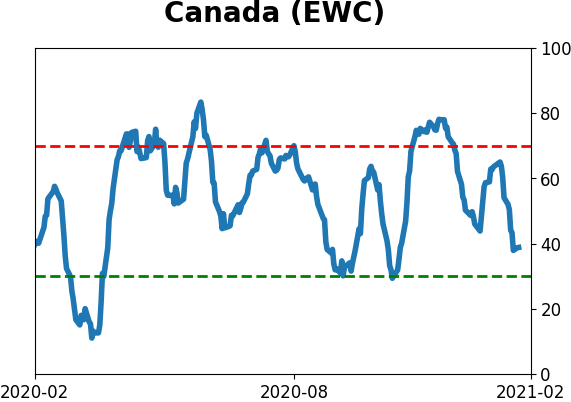
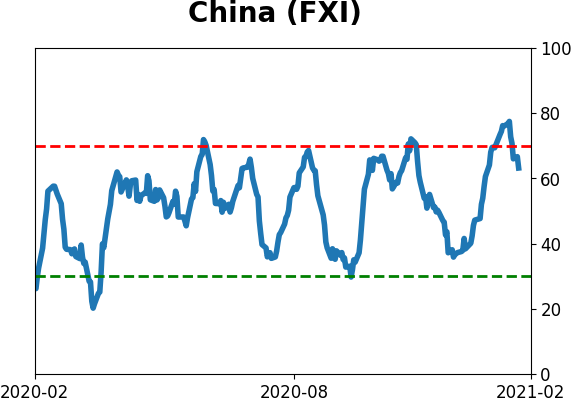
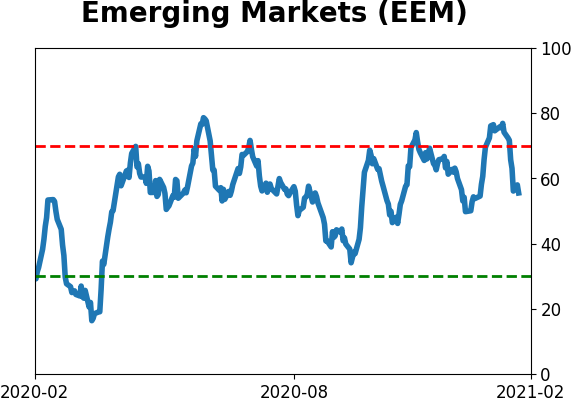
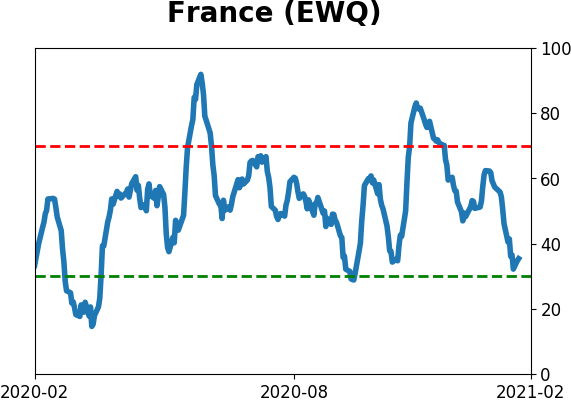
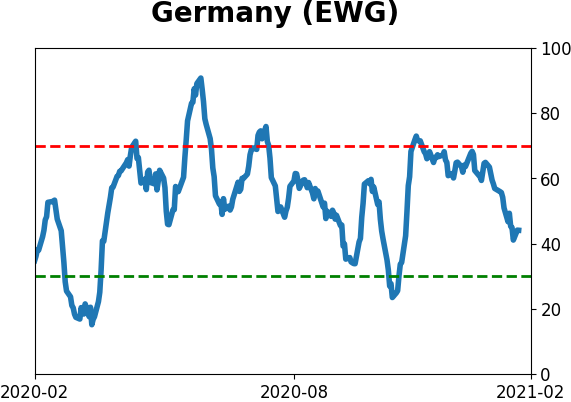
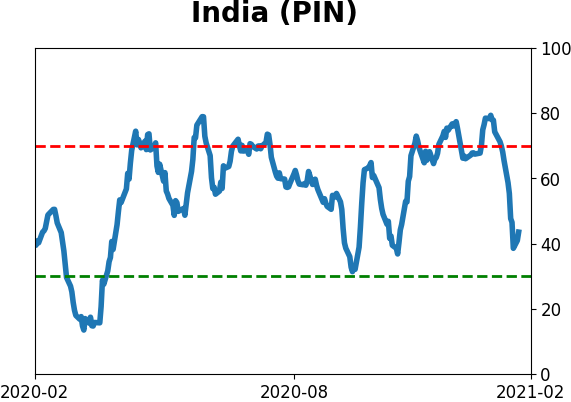
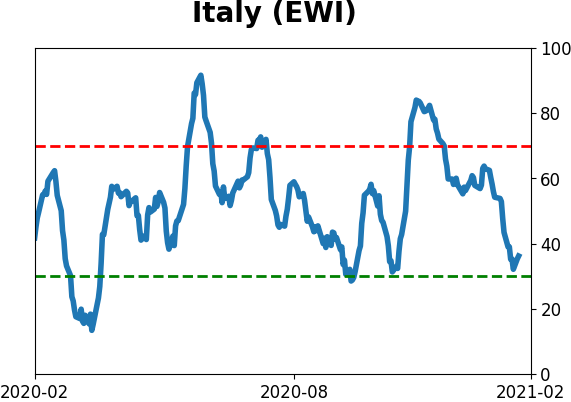
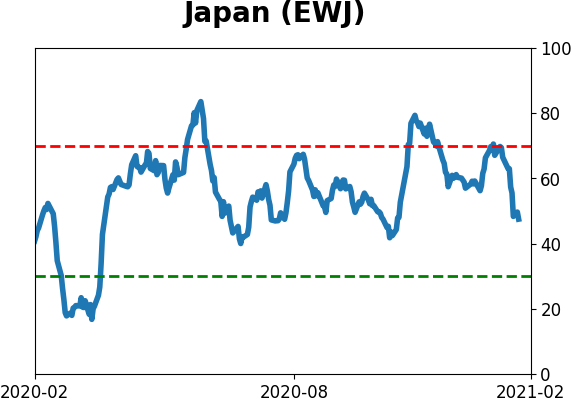
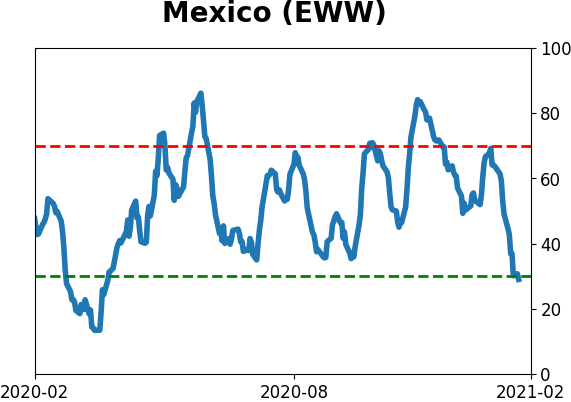
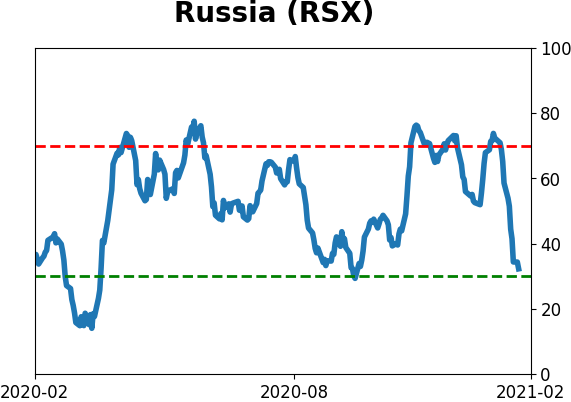
Country ETF's - 10-Day Moving Average
|
|
|
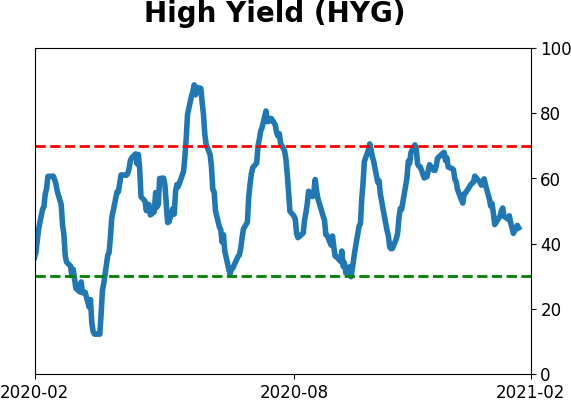
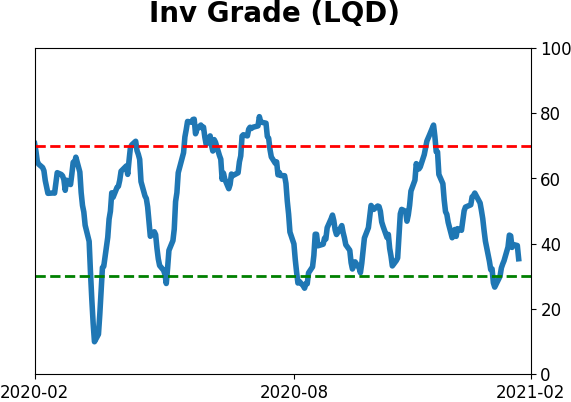
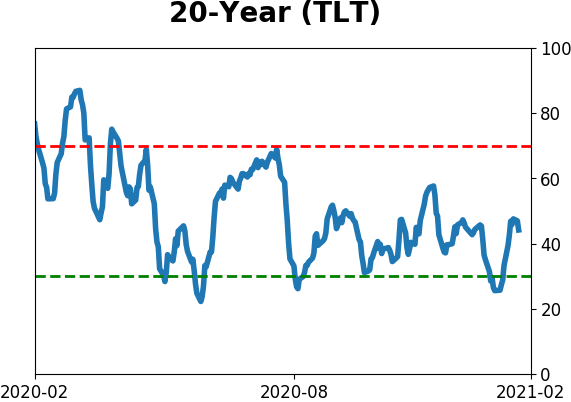
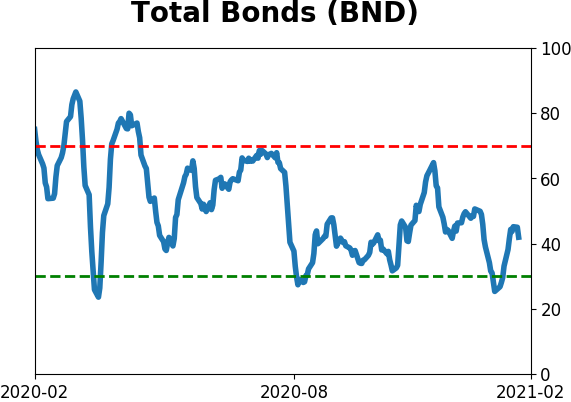
Bond ETF's - 10-Day Moving Average
|
|
|
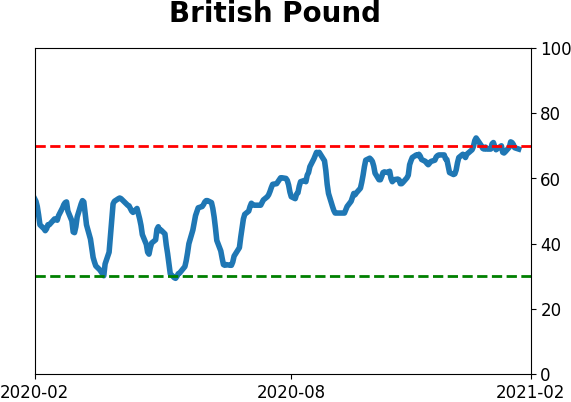
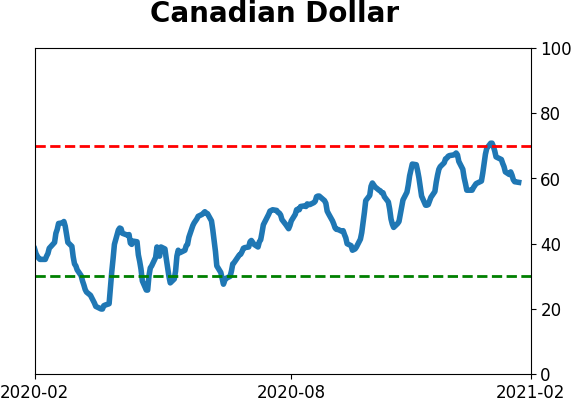
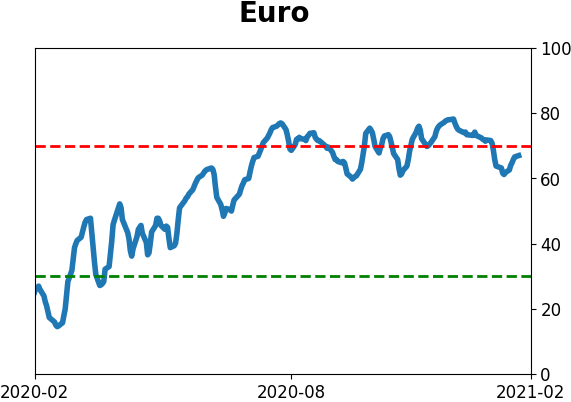
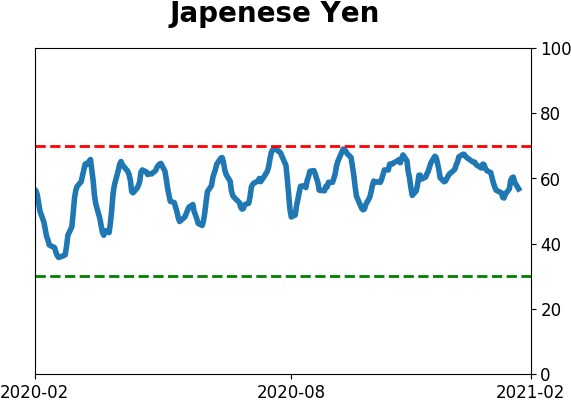
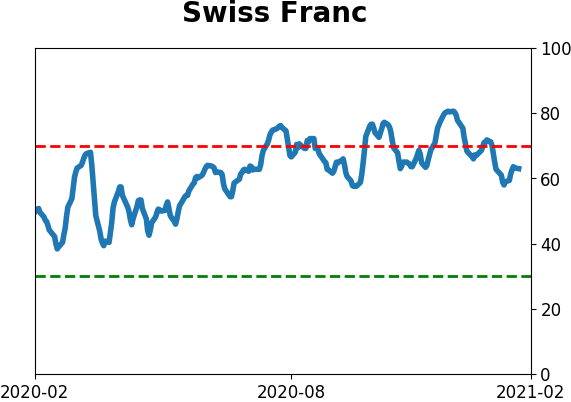
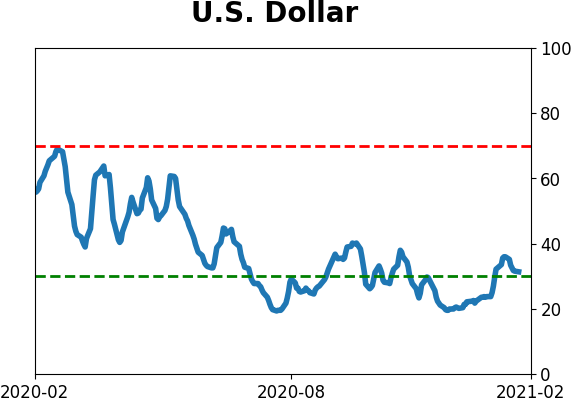
Currency ETF's - 5-Day Moving Average
|
|
|
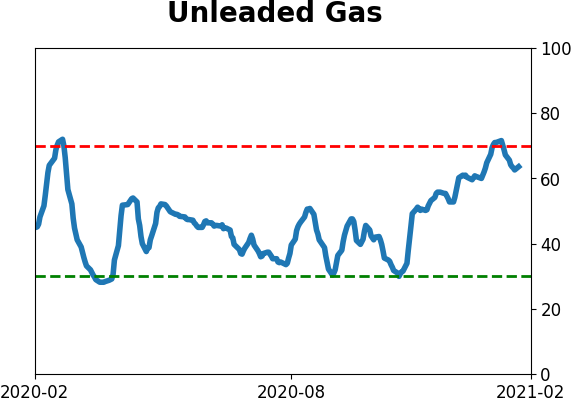
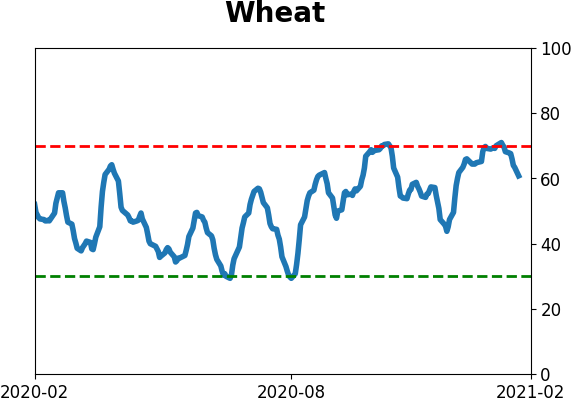
Commodity ETF's - 5-Day Moving Average
|
|