Headlines
|
|
Options mania lifts market to the level of satire:
Small options traders doubled their speculative bets last week via call options. Their net speculative activity is at record highs on both an absolute and relative basis. Market activity has gotten so extreme is has risen to the level of satire on Saturday Night Live.
Bottom Line:
See the Outlook & Allocations page for more details on these summaries STOCKS: Weak sell
We're in an extremely speculative environment that is enough to become defensive, especially with recent cracks showing in what had been pristine breadth conditions. The spike in fear on Wednesday (and again Friday) is likely not enough to offset the negatives. BONDS: Weak buy
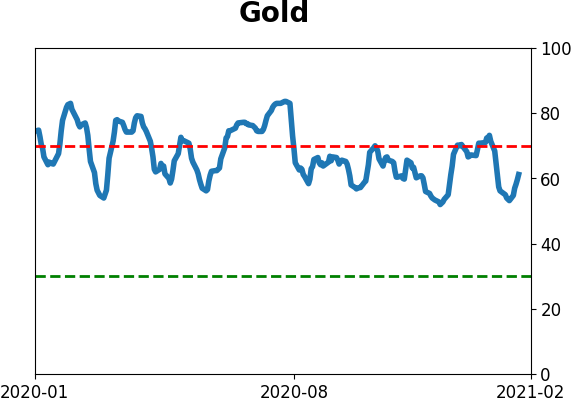
Various parts of the market have been hit in recent weeks, with mild oversold conditions that have started to reverse. GOLD: Weak buy
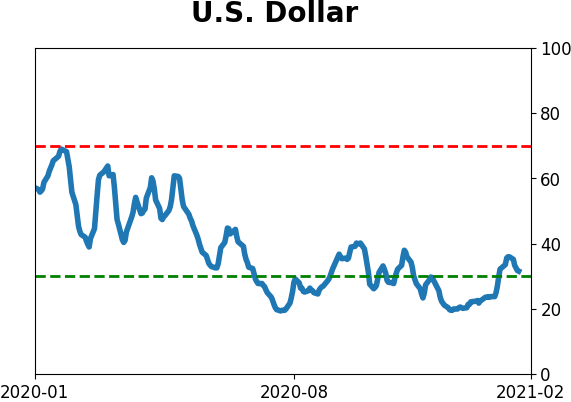
A dollar trying to rebound from a severe short position has weighed on gold and miners. The types of signals they've given in recent weeks, within the context of their recent surge, have usually resulted in higher prices.
|
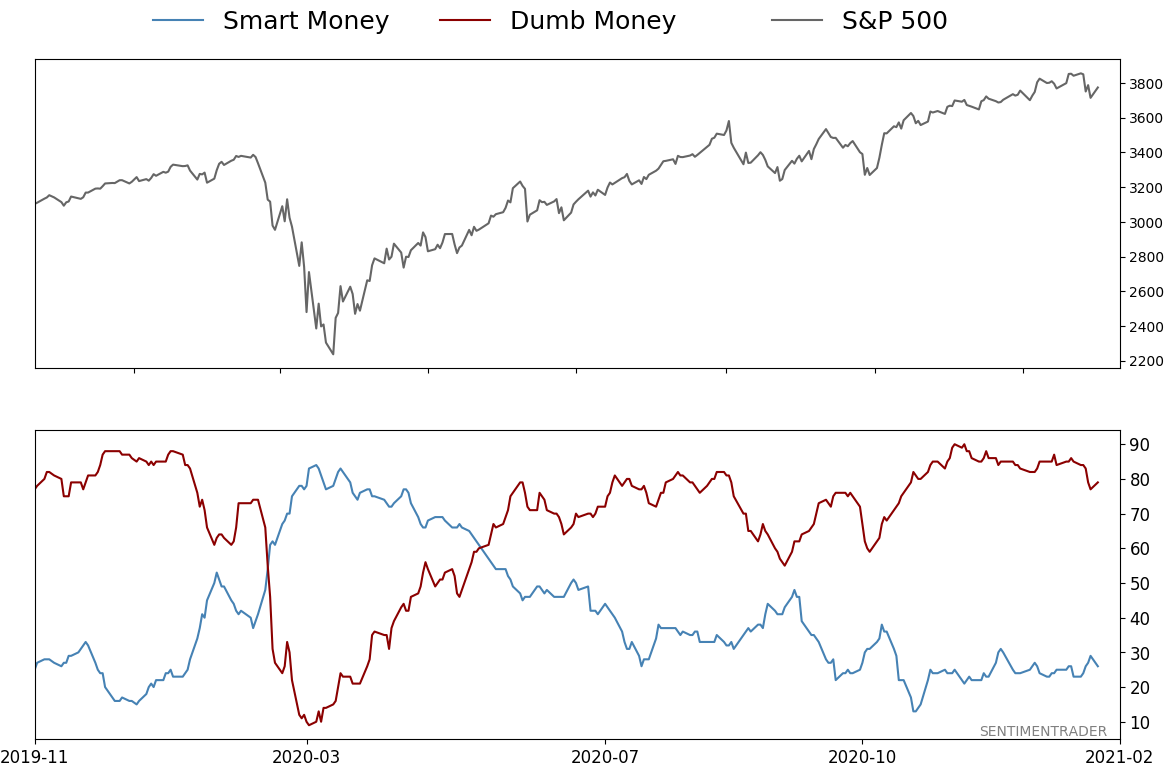
Smart / Dumb Money Confidence
|
Smart Money Confidence: 26%
Dumb Money Confidence: 79%
|
|
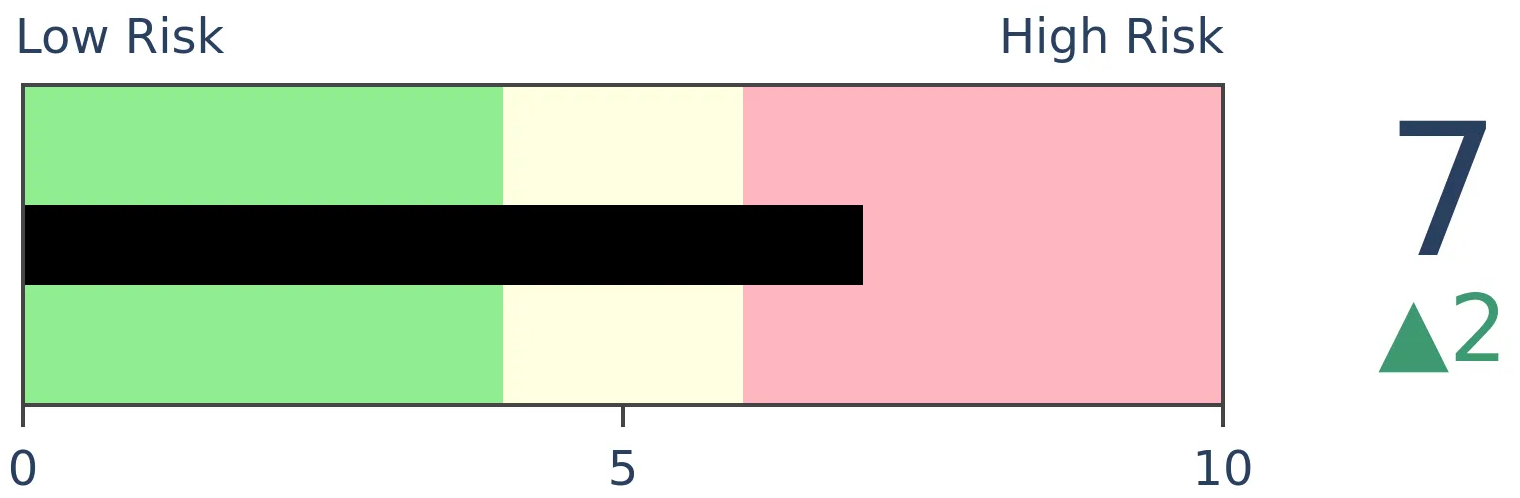
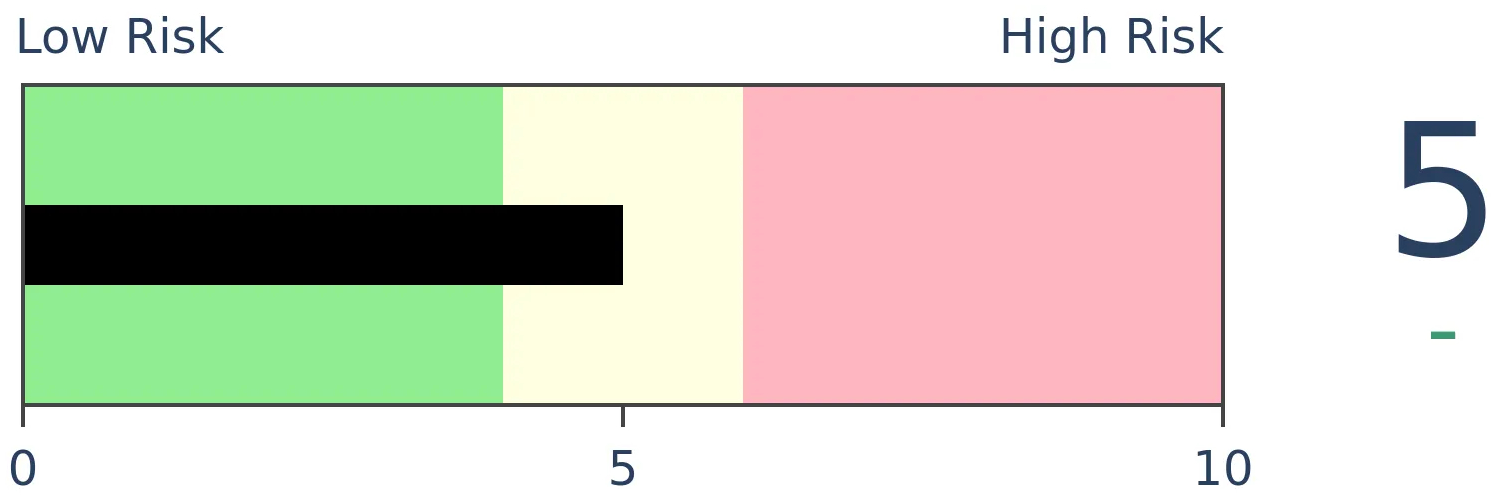
Risk Levels
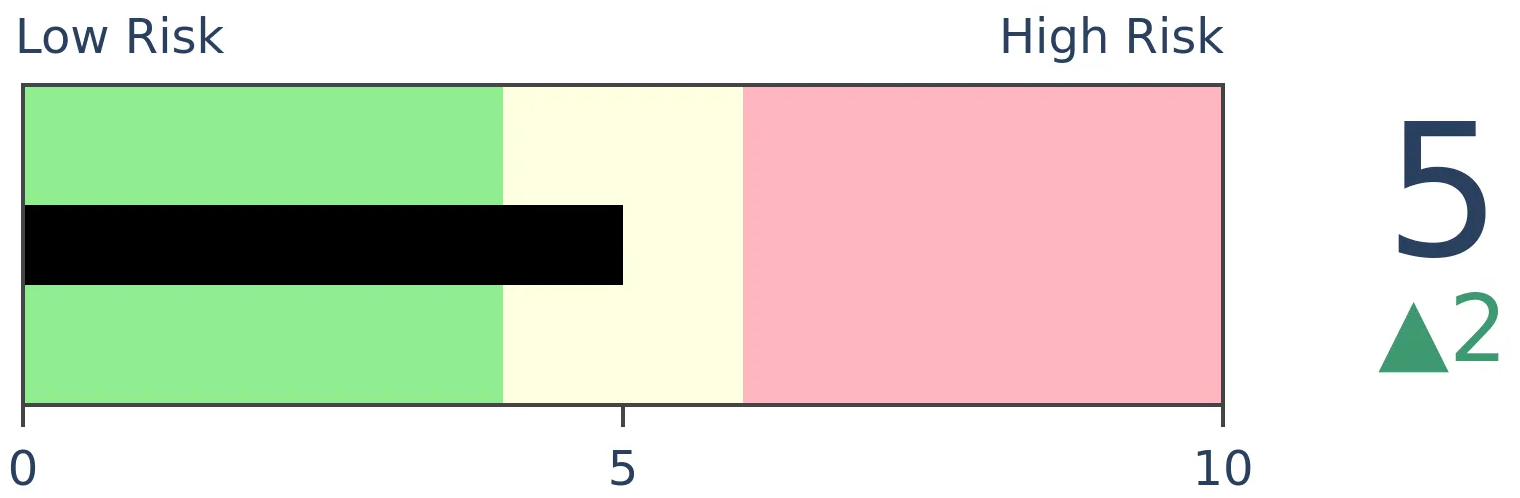
Stocks Short-Term
|
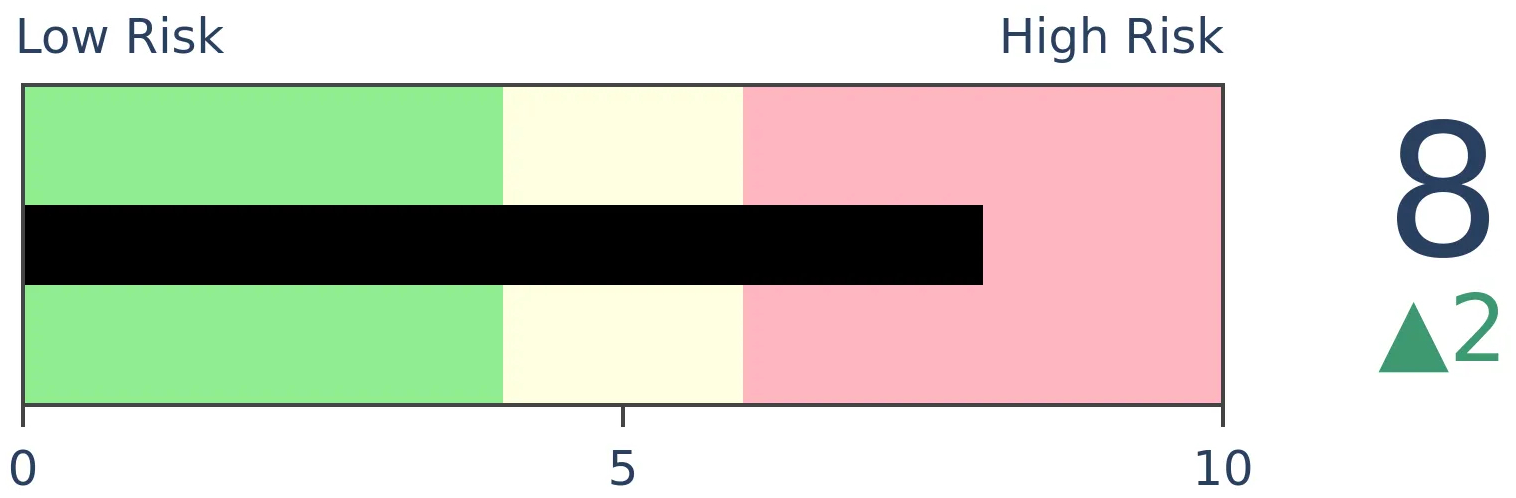
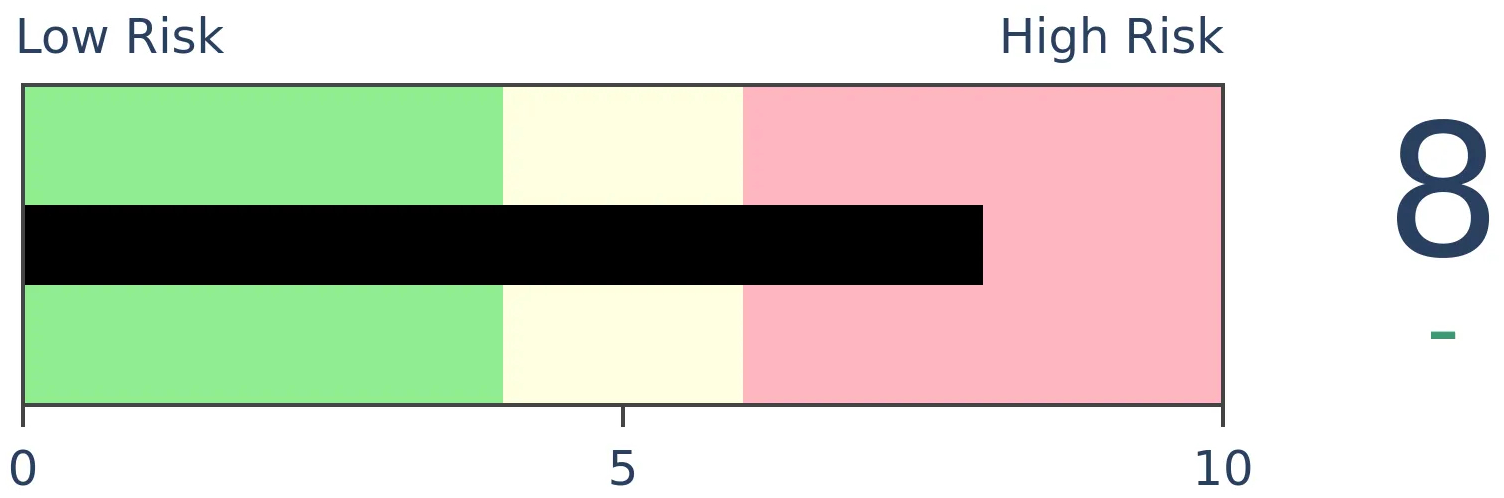
Stocks Medium-Term

|
|
Bonds
|
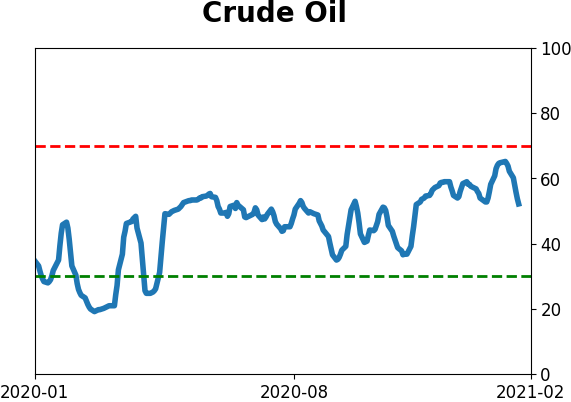
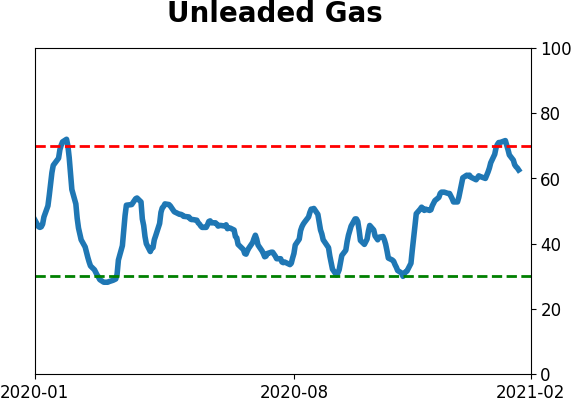
Crude Oil
|
|
Gold
|
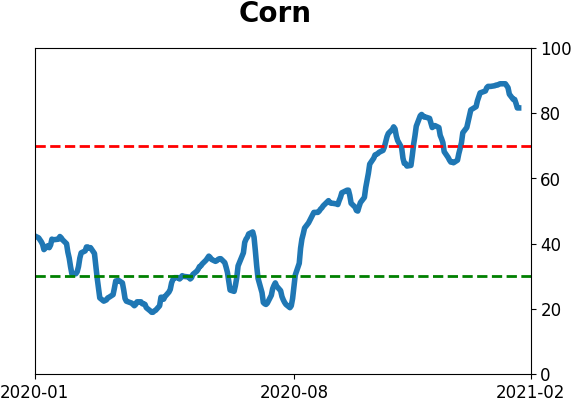
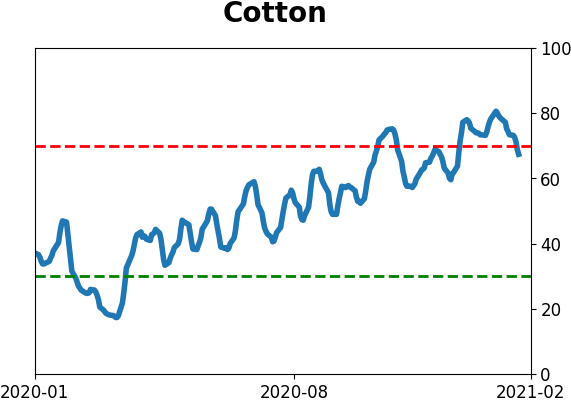
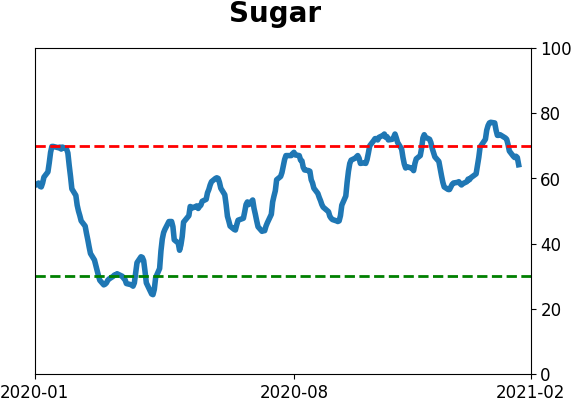
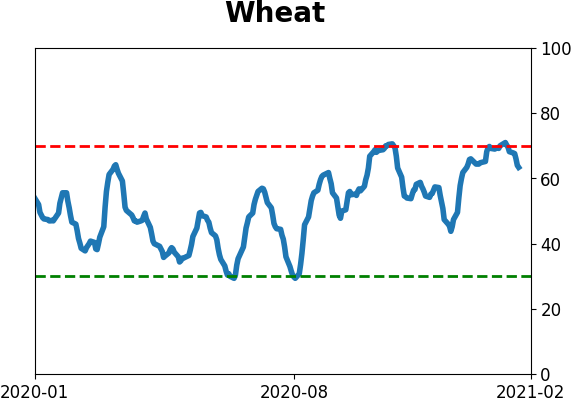
Agriculture
|
|
Research
BOTTOM LINE
Small options traders doubled their speculative bets last week via call options. Their net speculative activity is at record highs on both an absolute and relative basis. Market activity has gotten so extreme is has risen to the level of satire on Saturday Night Live.
FORECAST / TIMEFRAME
SPY -- Down, Medium-Term
|
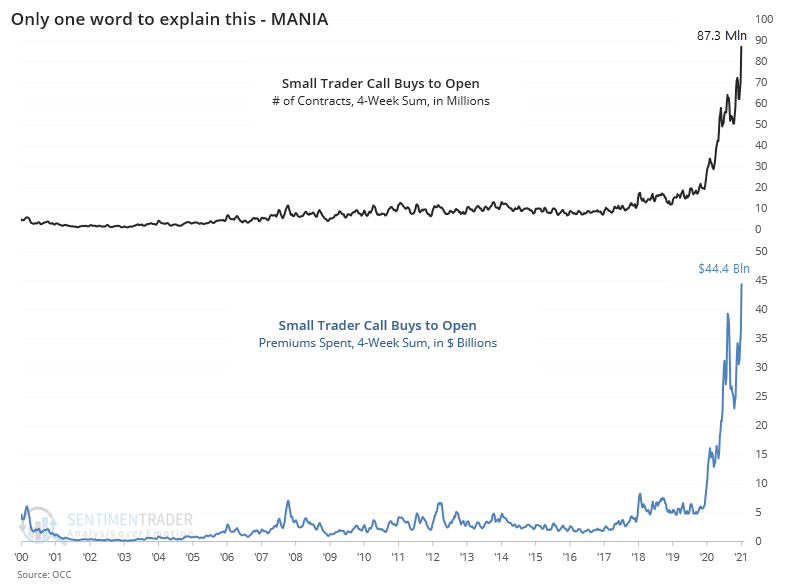
It's a mania. There's no other word for it, at least in the options market.
Speculative trading picked up last June, lasted through July, then exploded in August, preceding a 13%+ correction in many of the most active names in September. This go-round, it picked up in November, eased a bit in December, now has exploded again as we enter February.
It's occurred to such a degree it defies explanation, with record speculative activity among the smallest of traders. The 4-week sum has gone parabolic again.
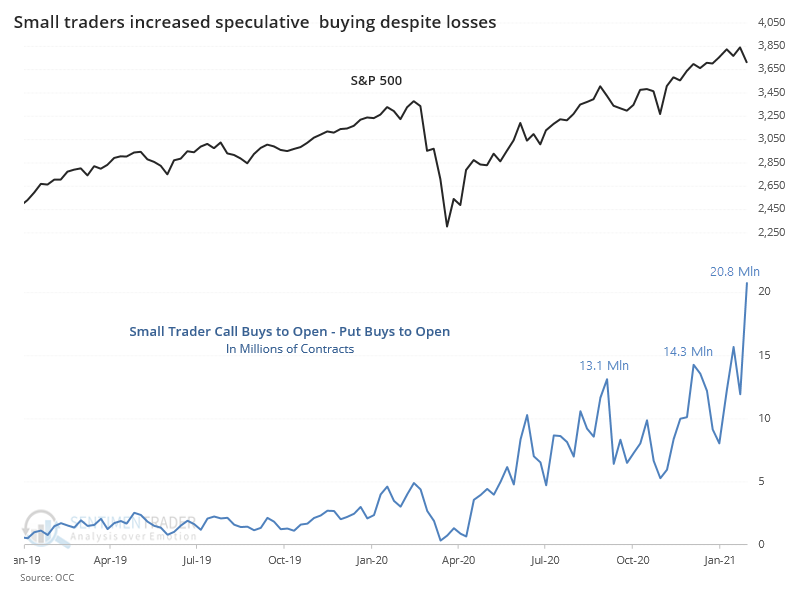
Last week alone, the smallest of options traders increased the pace of their call buying dramatically. Overall volumes increased, but call buying overwhelmed put buying.
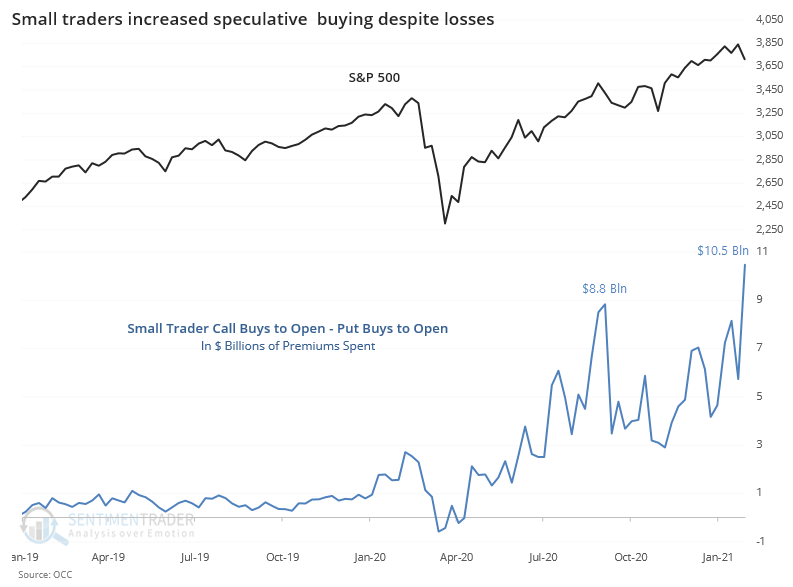
The premiums they spent on those calls were also extreme, with a net $10.5 billion difference between money spent on buying calls to open versus puts.
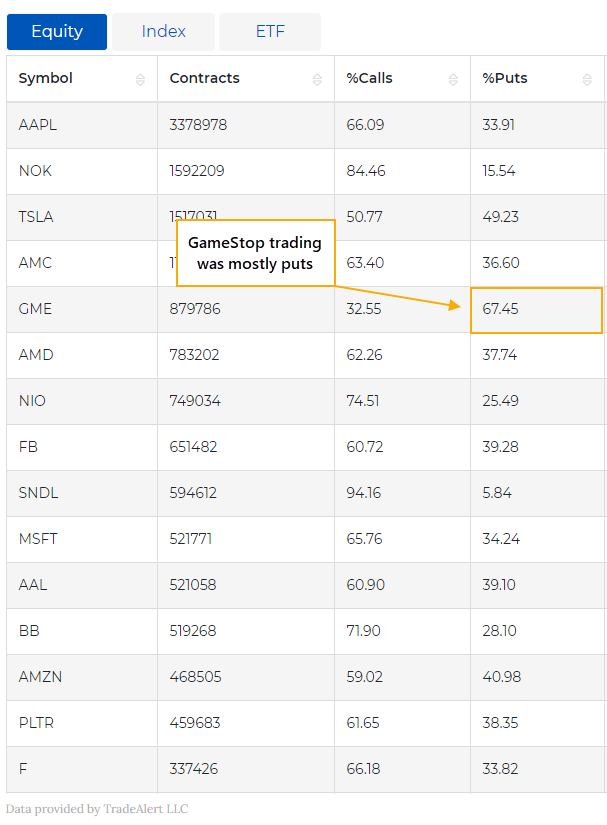
It would be easy to dismiss this a relatively small number of traders playing around in super-speculative names. But that would be entirely false. The most active options were in the largest names. In GameStop, more than two-thirds of the activity was in puts, not calls.
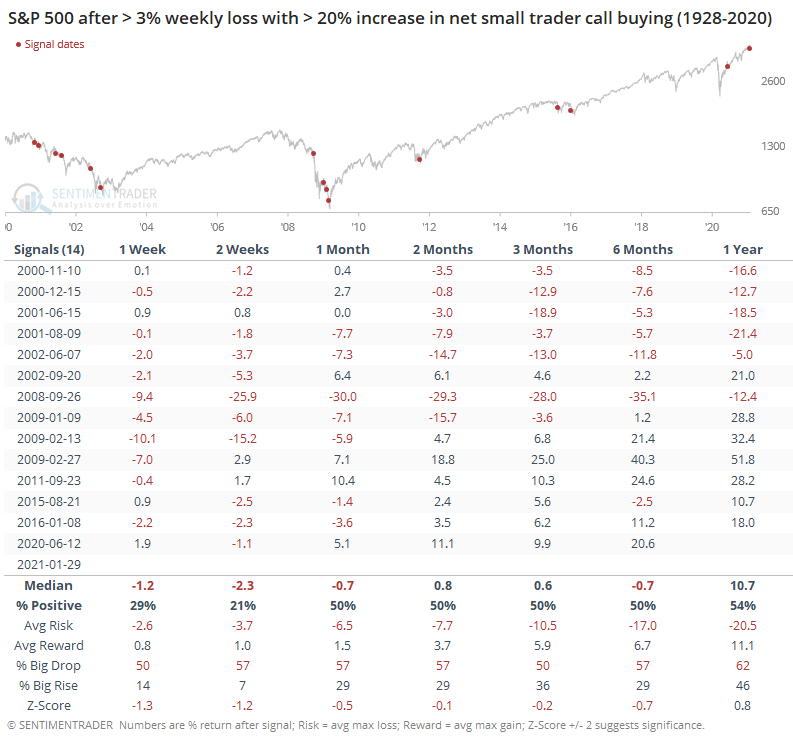
Because these traders increased their call buying during a week that saw some of the worst losses in months among many stocks, we could consider it to be "irrational" speculation. Other times we saw this kind of behavior mostly occurred during bear markets.
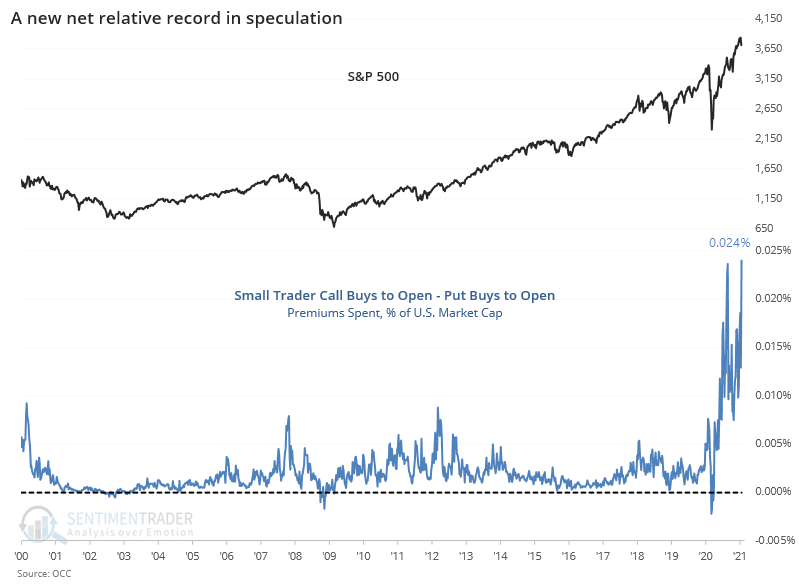
The most comprehensive and objective way we can express this is the net premiums spent on calls minus premiums spent on puts relative to the total market cap of U.S. stocks. It's a tiny fraction, but that's ignoring all the knock-on effects that call buying has on the underlying market. And once again, this is at a record high.
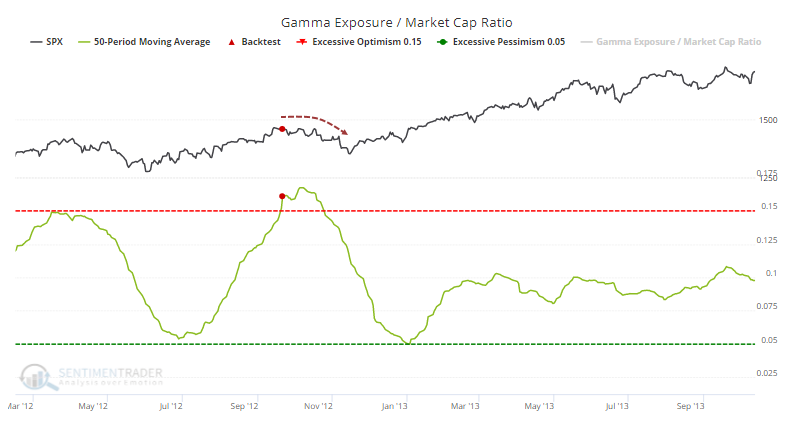
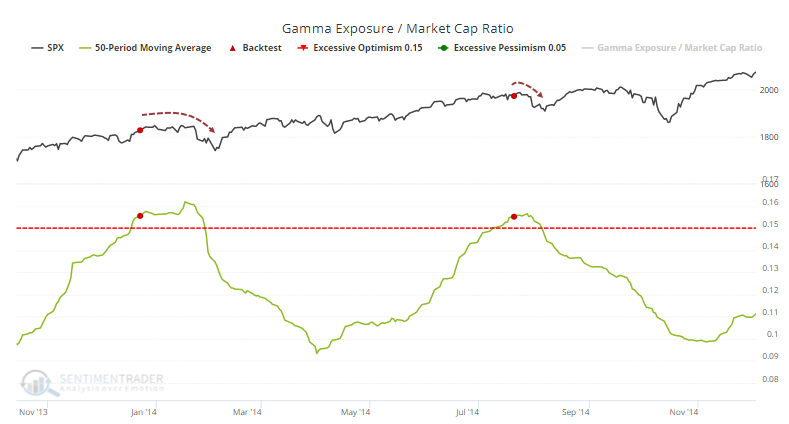
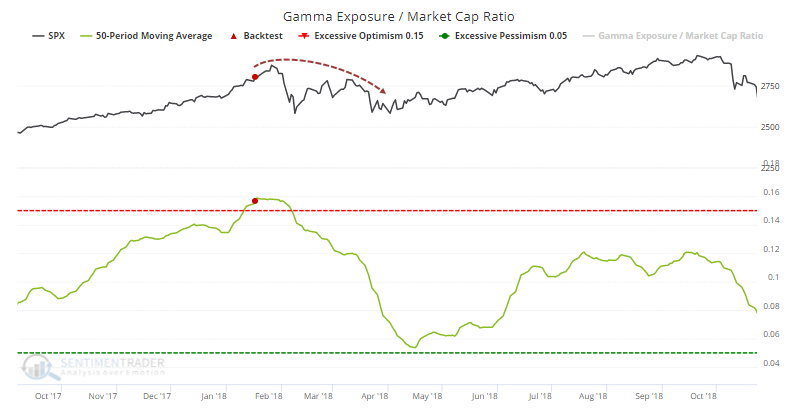
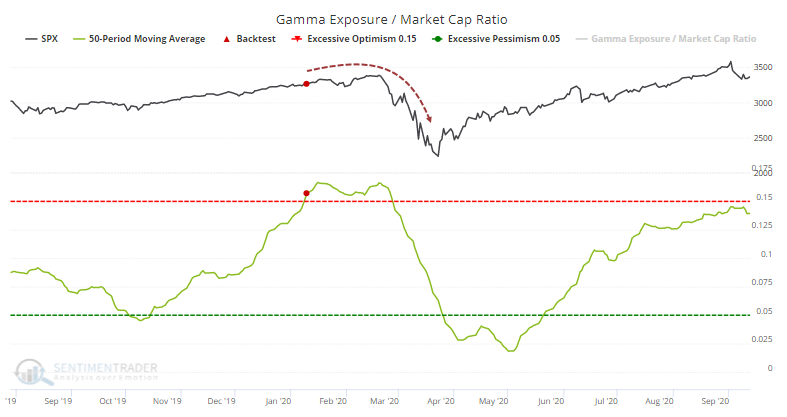
We've looked at the importance of this call activity before, in terms of the impact on dealer positions. Someone has to take the other side of these long call options by selling them, and they hedge their exposure by buying the underlying stock. Their sensitivity to this exposure is estimated by Gamma Exposure.
As a percentage of the market cap of all U.S. stocks, it has now been elevated for 50 days and is nearing a record. This ain't your Grandma's Gamma. The Backtest Engine shows that the S&P 500 struggled after it crossed lesser thresholds.
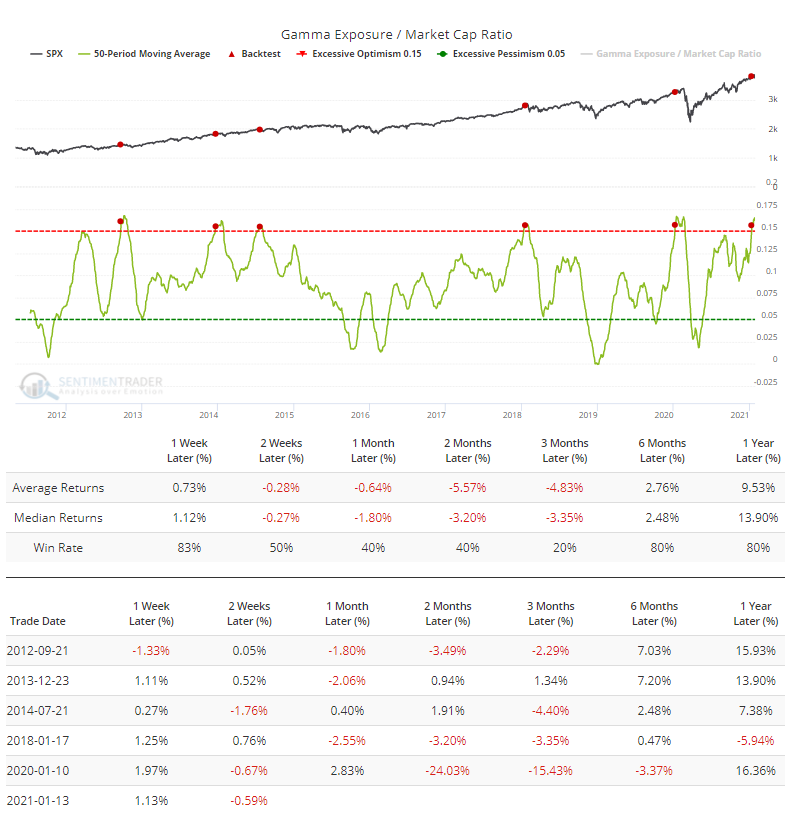
Individually, they all showed losses at some point between 1-3 months later.
The rally, and the craziness last week, has reached the level of satire, epitomized by Saturday Night Live (SNL). It's interesting when some aspect of the stock market reaches a level of consciousness so much that it's a leading topic on national news or, even better, comedy.
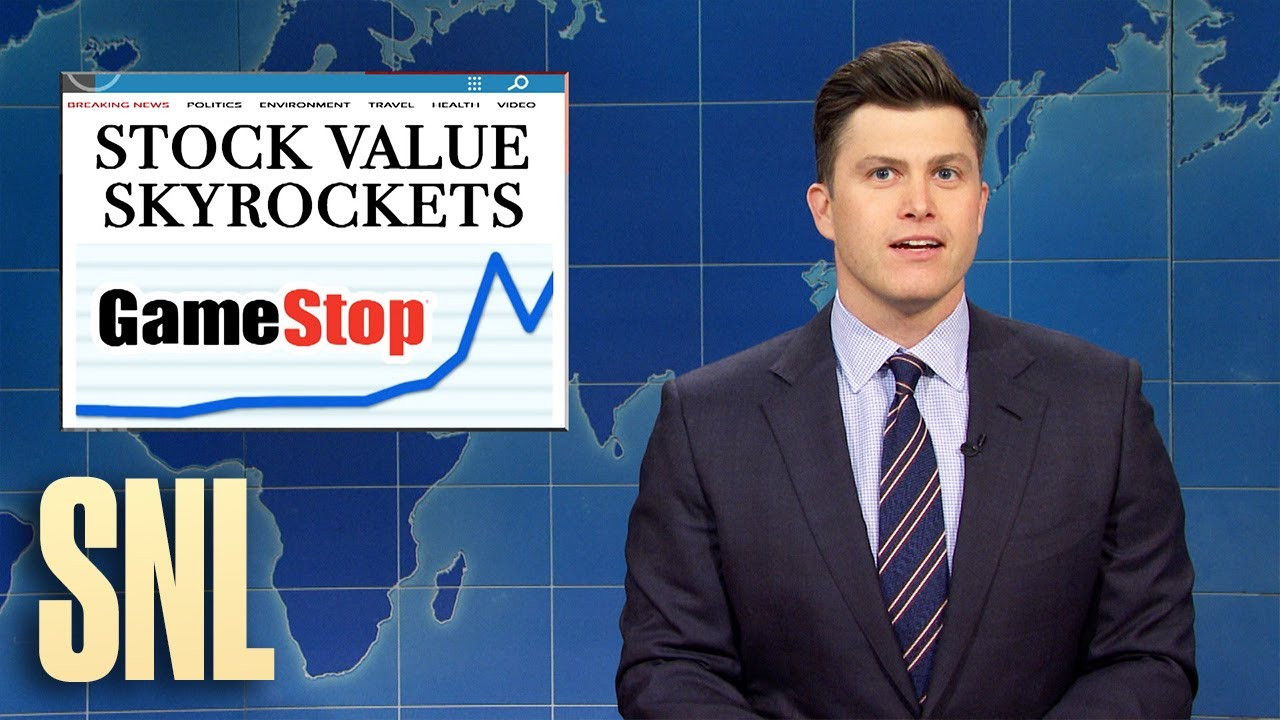
Below, we can see an admittedly rough tally of positive (red arrow) and negative (green arrow) skits about the stock market on SNL. This is a compendium of mentions about "stocks", "stock market", "dow" and any other term I could think of, going back about 50 years.
In 1977, SNL ran skits about the stock market being closed for good, and then what investors should do after sustaining record losses. In 1999, the joke was about Martha Stewart taking herself public. By 2003, the joke was, "We're entering the fourth year of a down stock market. Is it time to sell yet?".
People never change.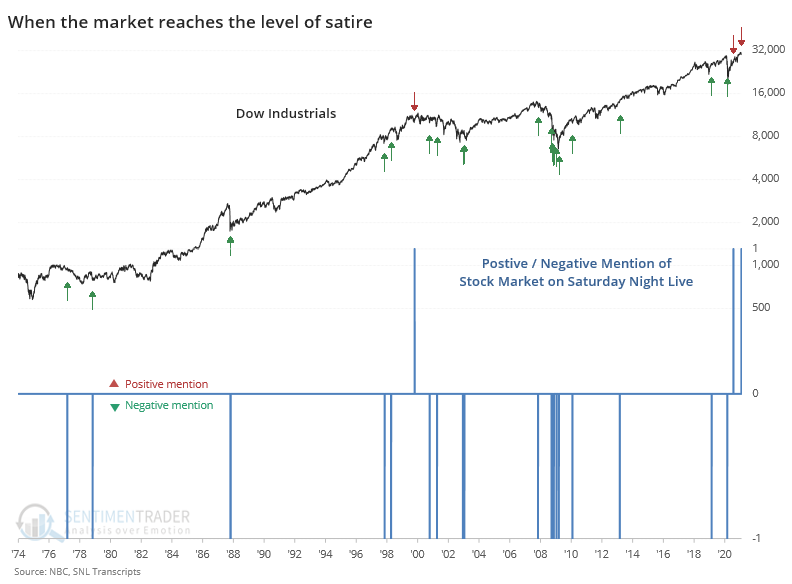
The evidence of where we are in the sentiment cycle is clear, and it's damning. Anecdotally, we're seeing precisely the same types of headlines about regime change due to the rush of individual investors that we saw in 1999. Rarely does history rhyme so well.
The biggest issue up until the last couple of weeks had been a pristine internal environment, with many stocks rising and buying interest impressively "thrusty." That is absolutely not what happened in 1999 - 2000, so that's a stark difference. This started to change very recently, with more internal divergences that we hadn't been seeing up until now. It's still not a major factor, but if stocks gyrate here and recover a bit, we'll very likely be seeing more and more risk-off signals start to fire. Coupled with a supercharged speculative environment, that would be a very bad sign indeed.
Active Studies
| Time Frame | Bullish | Bearish | | Short-Term | 0 | 0 | | Medium-Term | 2 | 4 | | Long-Term | 15 | 2 |
|
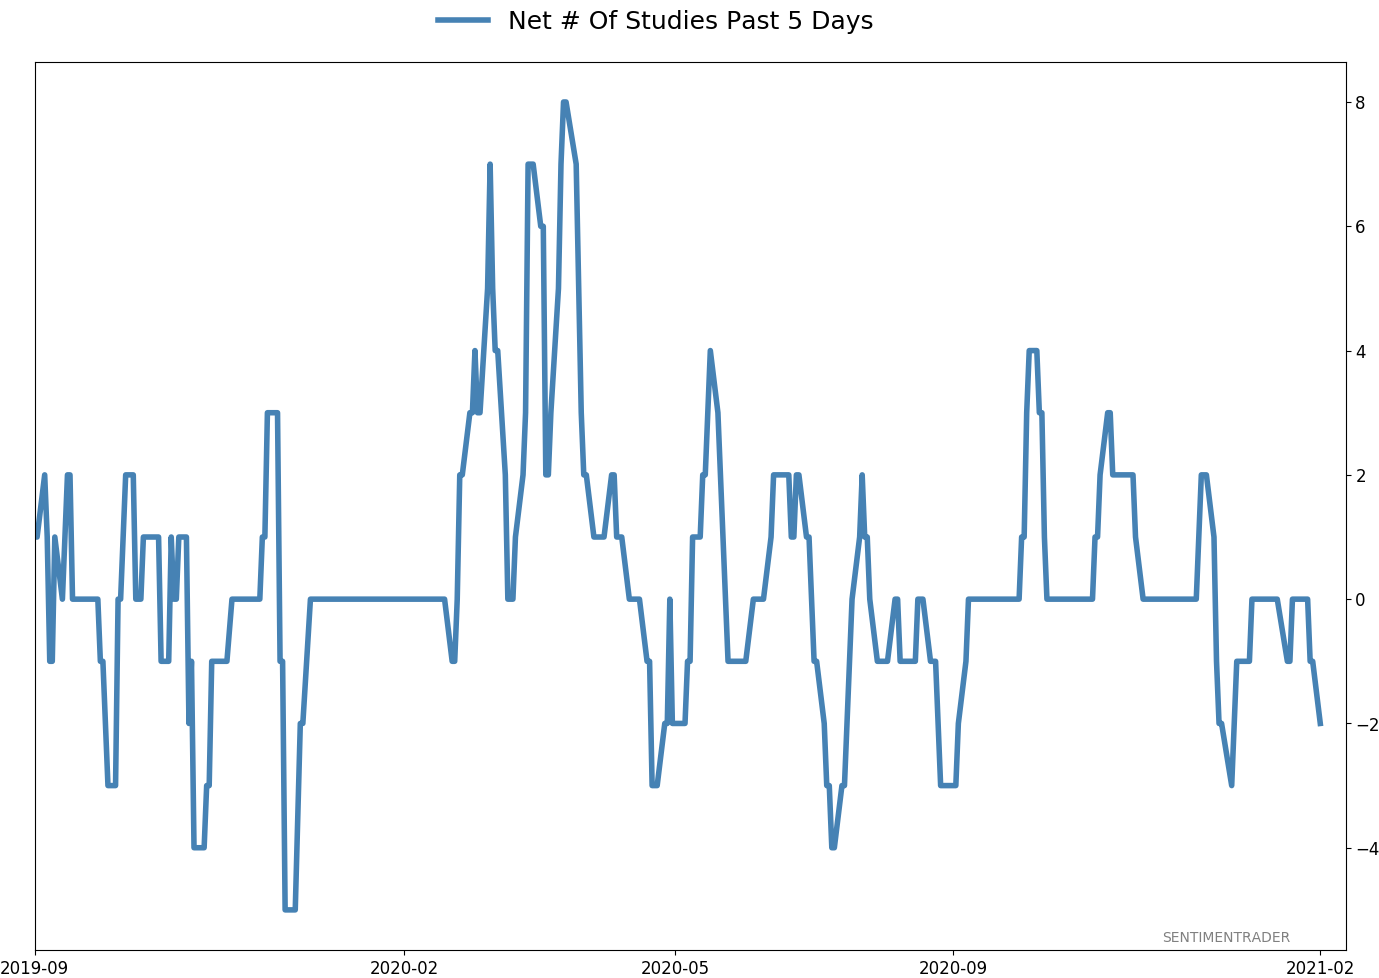
Indicators at Extremes
Portfolio
| Position | Description | Weight % | Added / Reduced | Date | | Stocks | 8.7% RSP | 8.7 | Reduced 28.8% | 2021-01-26 | | Bonds | 9.5% ANGL, 9.1% SCHP, 9.0% BND | 27.6 | Reduced 0.2% | 2021-01-26 | | Commodities | GCC | 2.3 | Reduced 2.1%
| 2020-09-04 | | Precious Metals | GDX | 8.9 | Added 4.8% | 2020-12-01 | | Special Situations | 10.3% XLE, 8.9% PSCE | 19.2 | Added 19.2% | 2021-01-26 | | Cash | | 33.4 | | |
|
Updates (Changes made today are underlined)
With a market that has seen the kinds of broad participation and big breath thrusts like we did in the fall, it's hard to become too negative. Those kinds of conditions have consistently preceded higher returns over the next 6-12 months. It's the interim that's more of an issue. Even conditions like that haven't prevented some shorter-term pullbacks. And when we combine an environment where speculation is rampant and recent days have seen an increase in cracks under the surface of the indexes, it's enough to become more defensive over a short- to medium-term time frame. We still don't have much confirmation from the price action in the indexes, so those who are more conservative would likely wait before increasing cash levels. In a bid to more closely align the portfolio with what most of our members consider "stocks", we have moved any sector-specific investments to the "special situations" category instead of "stocks." This way, the "stocks" category is essentially the most benchmarked index in the world, the S&P 500. RETURN YTD: 2.6% 2020: 8.1%, 2019: 12.6%, 2018: 0.6%, 2017: 3.8%, 2016: 17.1%, 2015: 9.2%, 2014: 14.5%, 2013: 2.2%, 2012: 10.8%, 2011: 16.5%, 2010: 15.3%, 2009: 23.9%, 2008: 16.2%, 2007: 7.8%
|
|
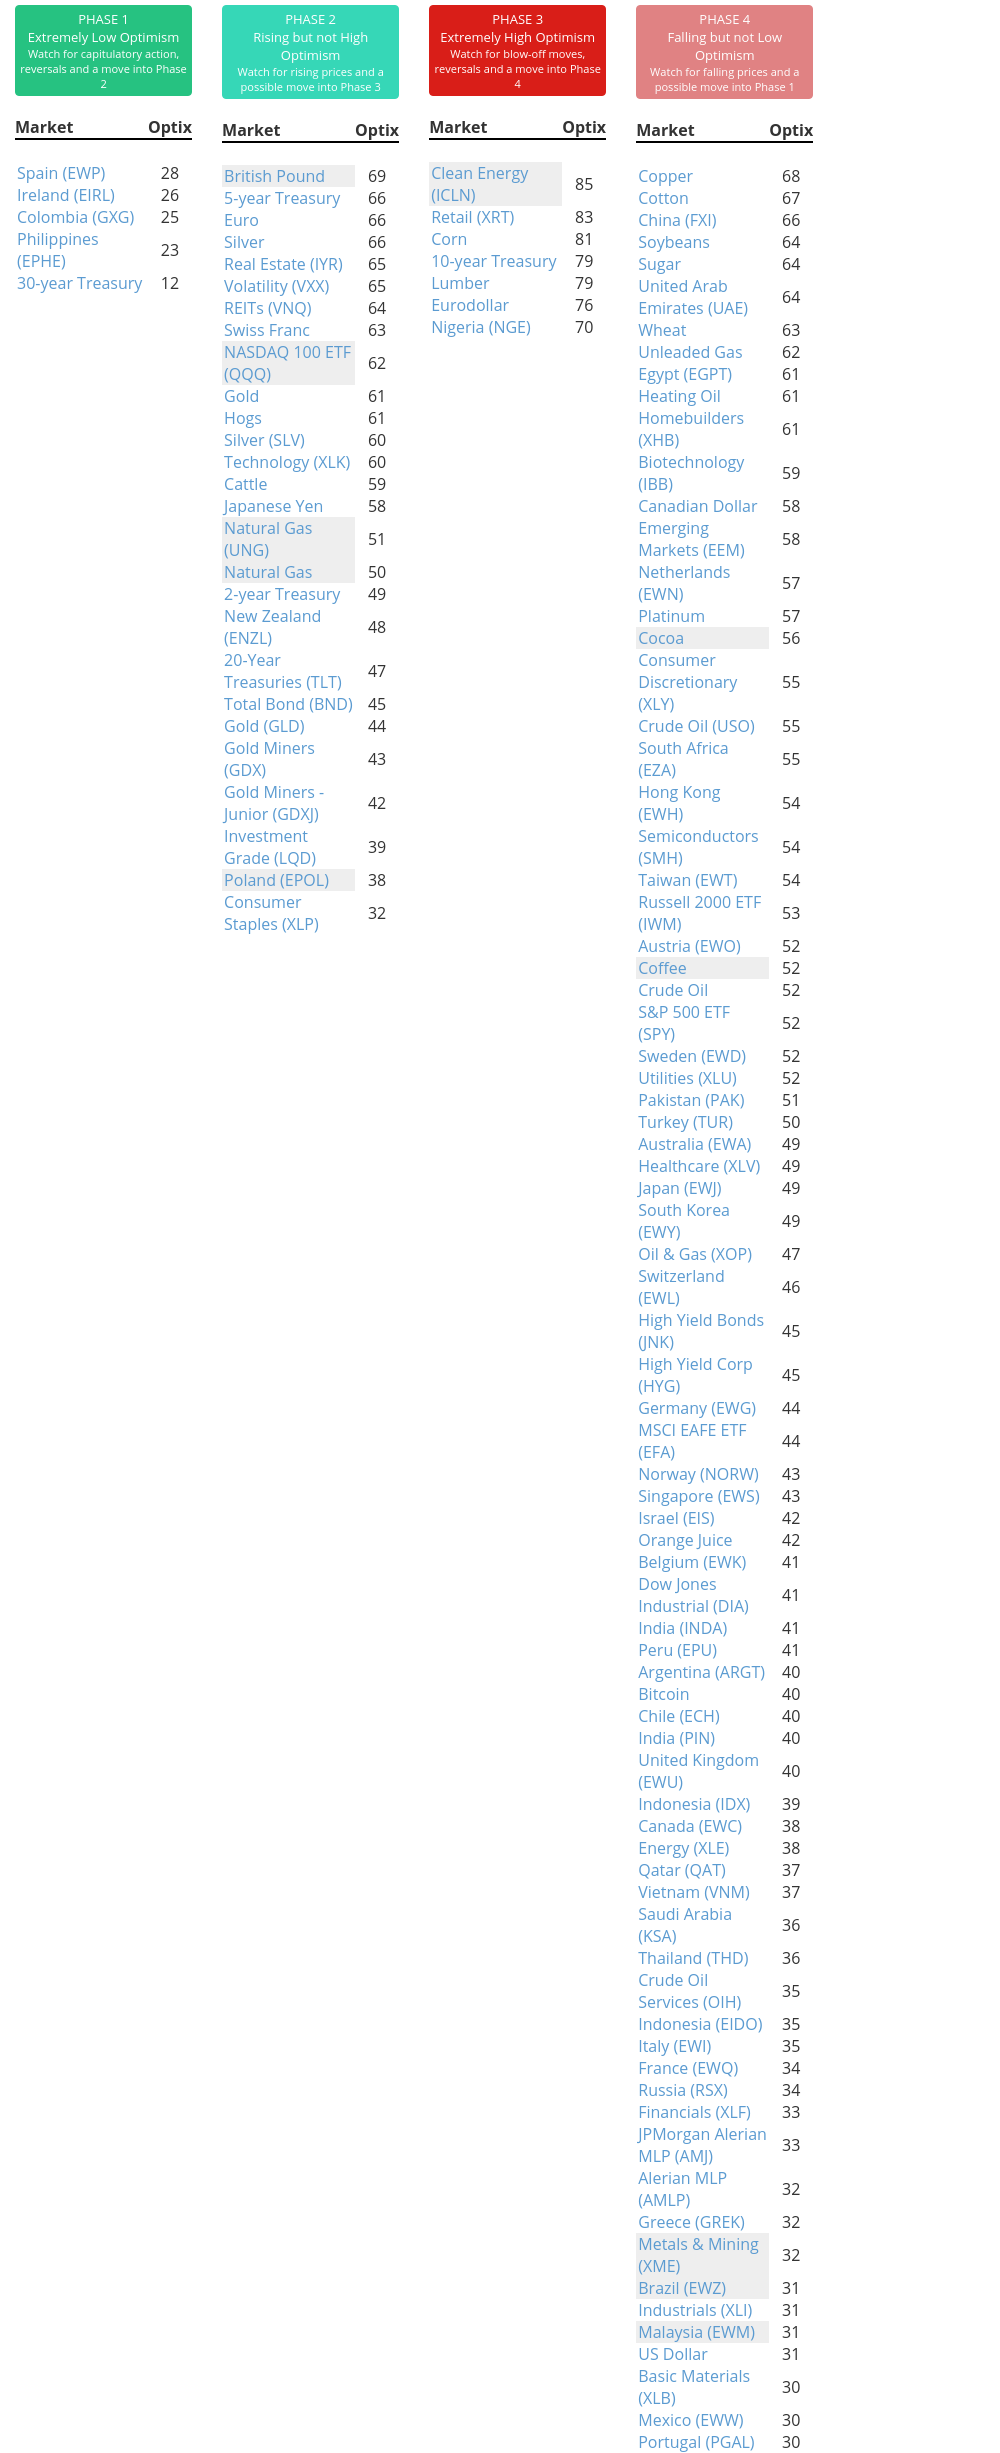
Phase Table
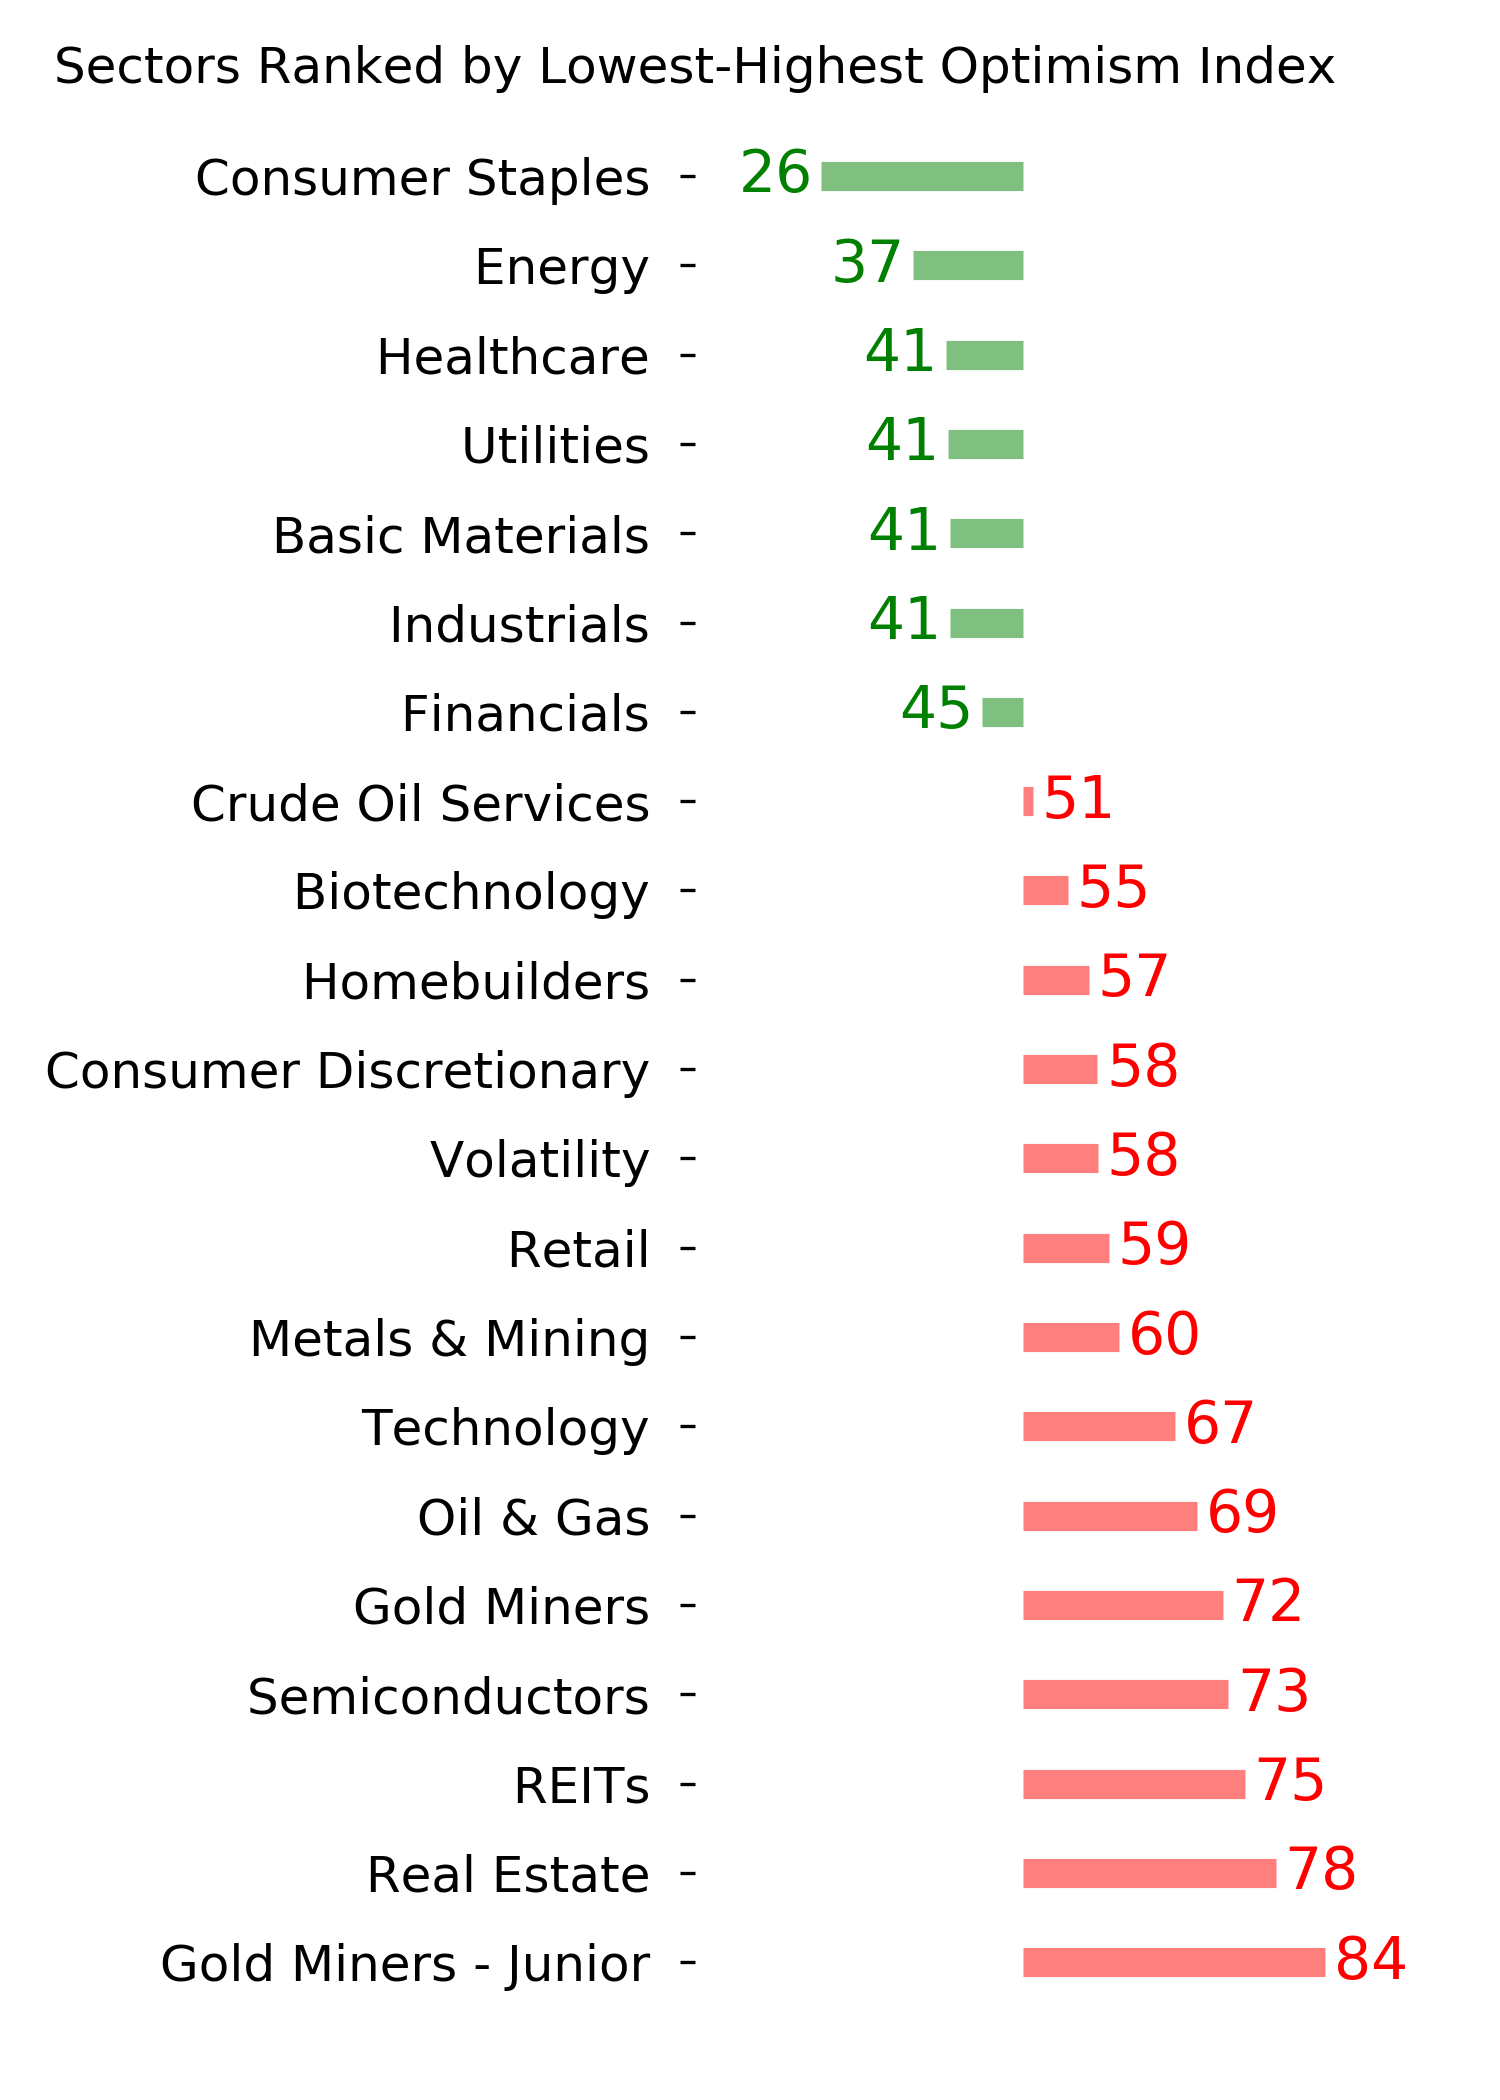
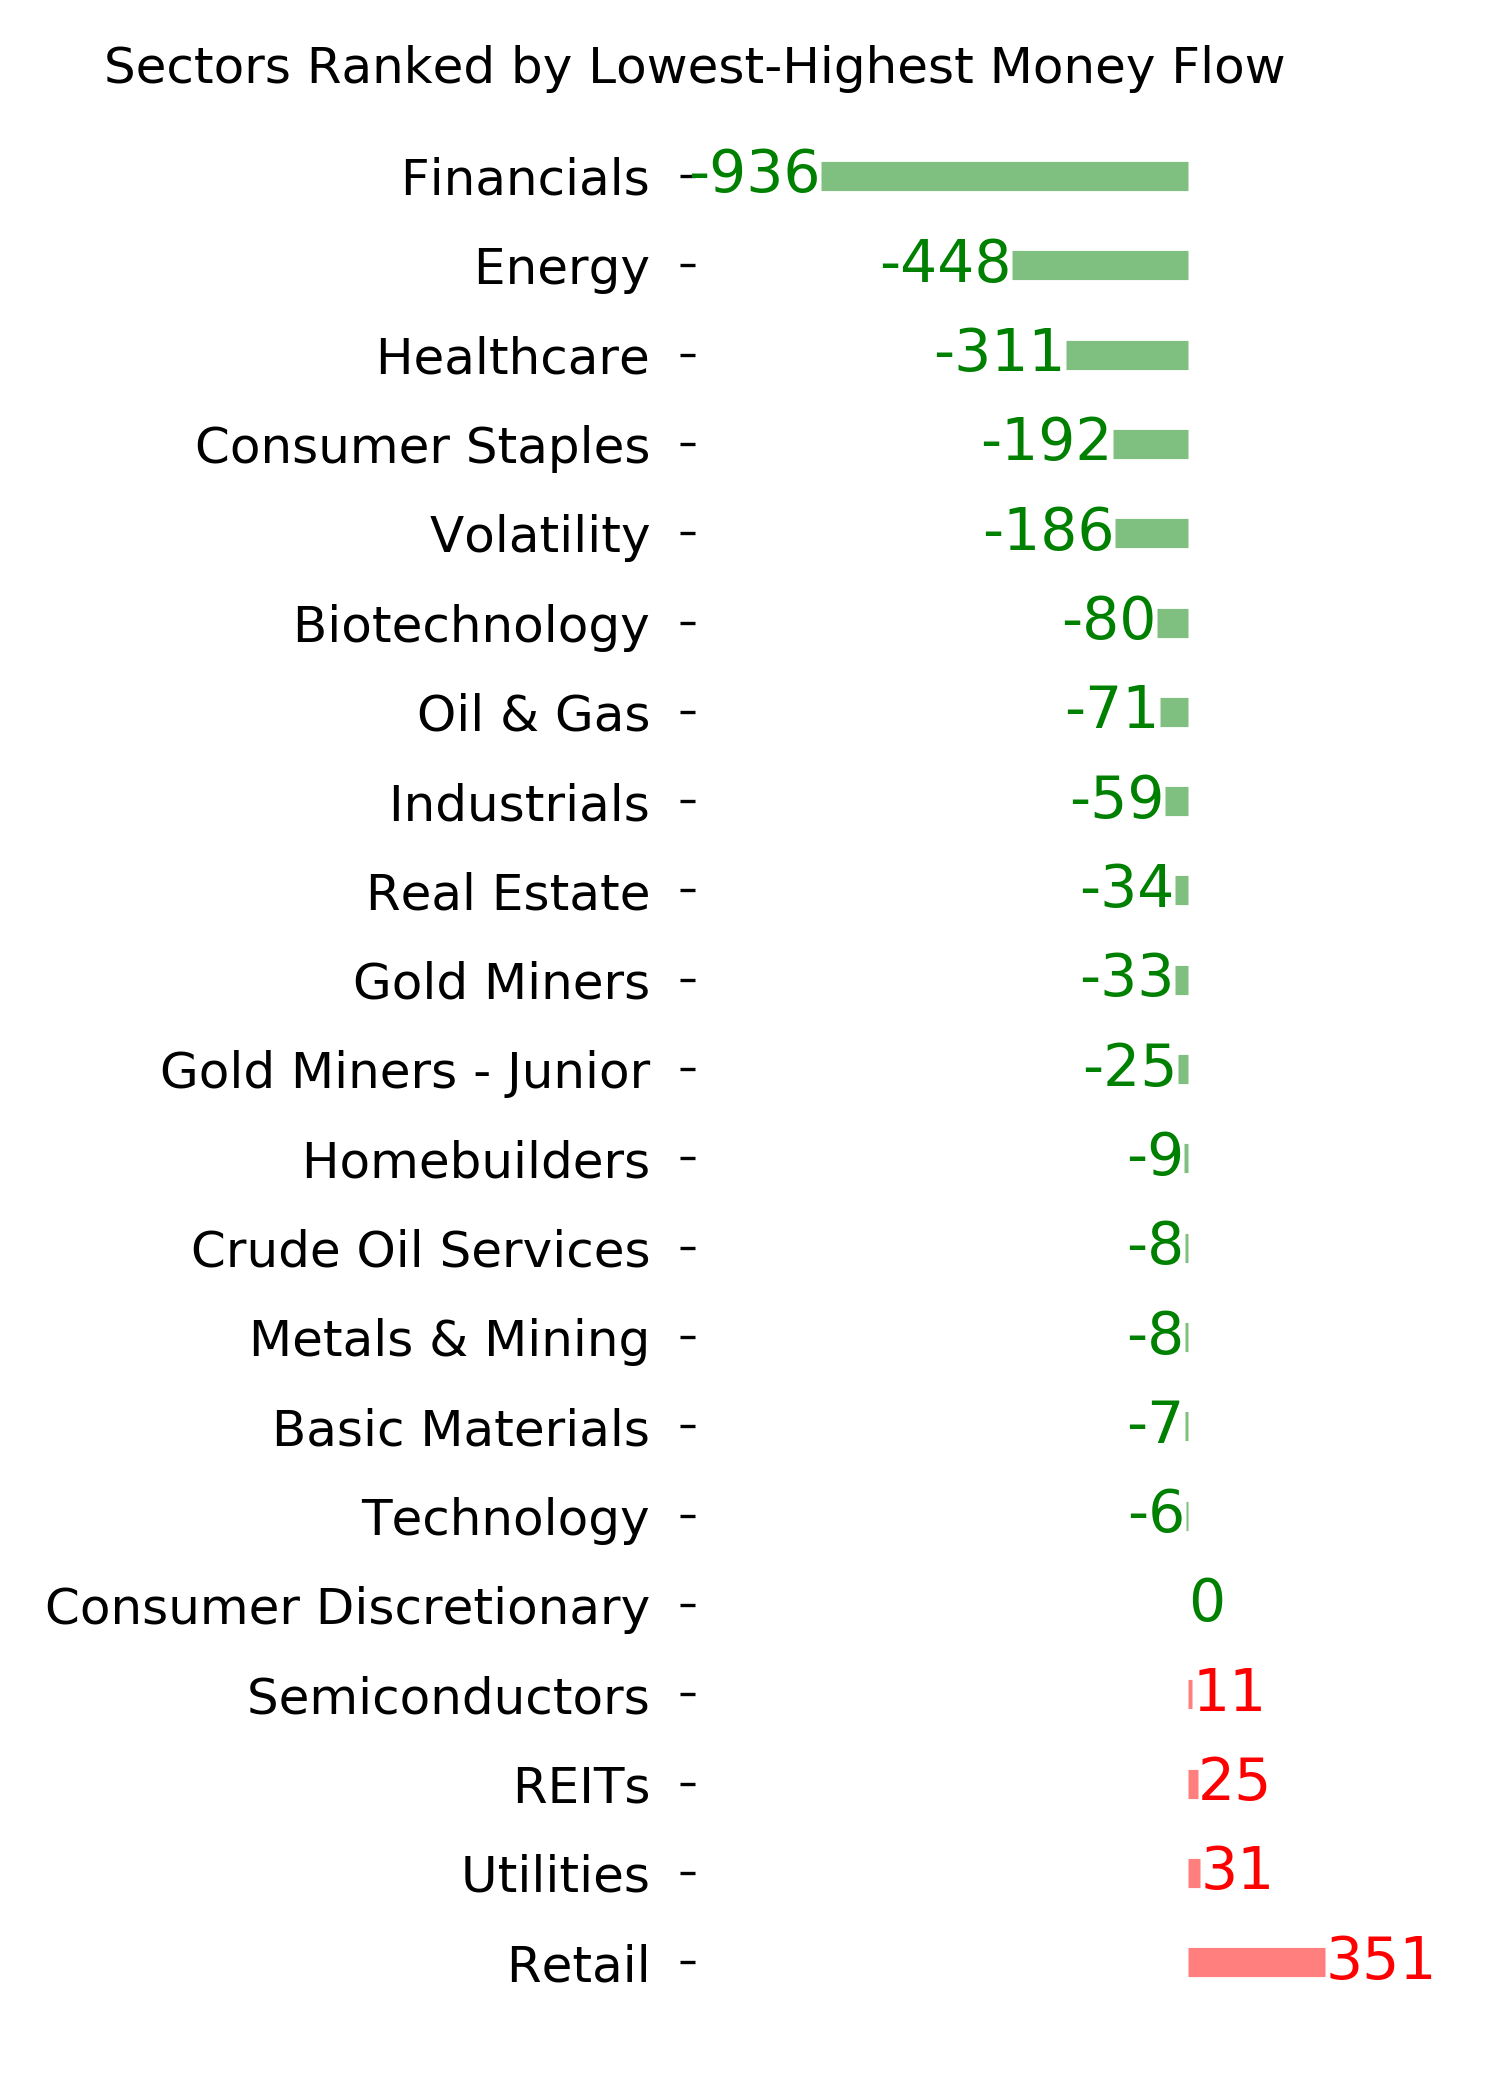
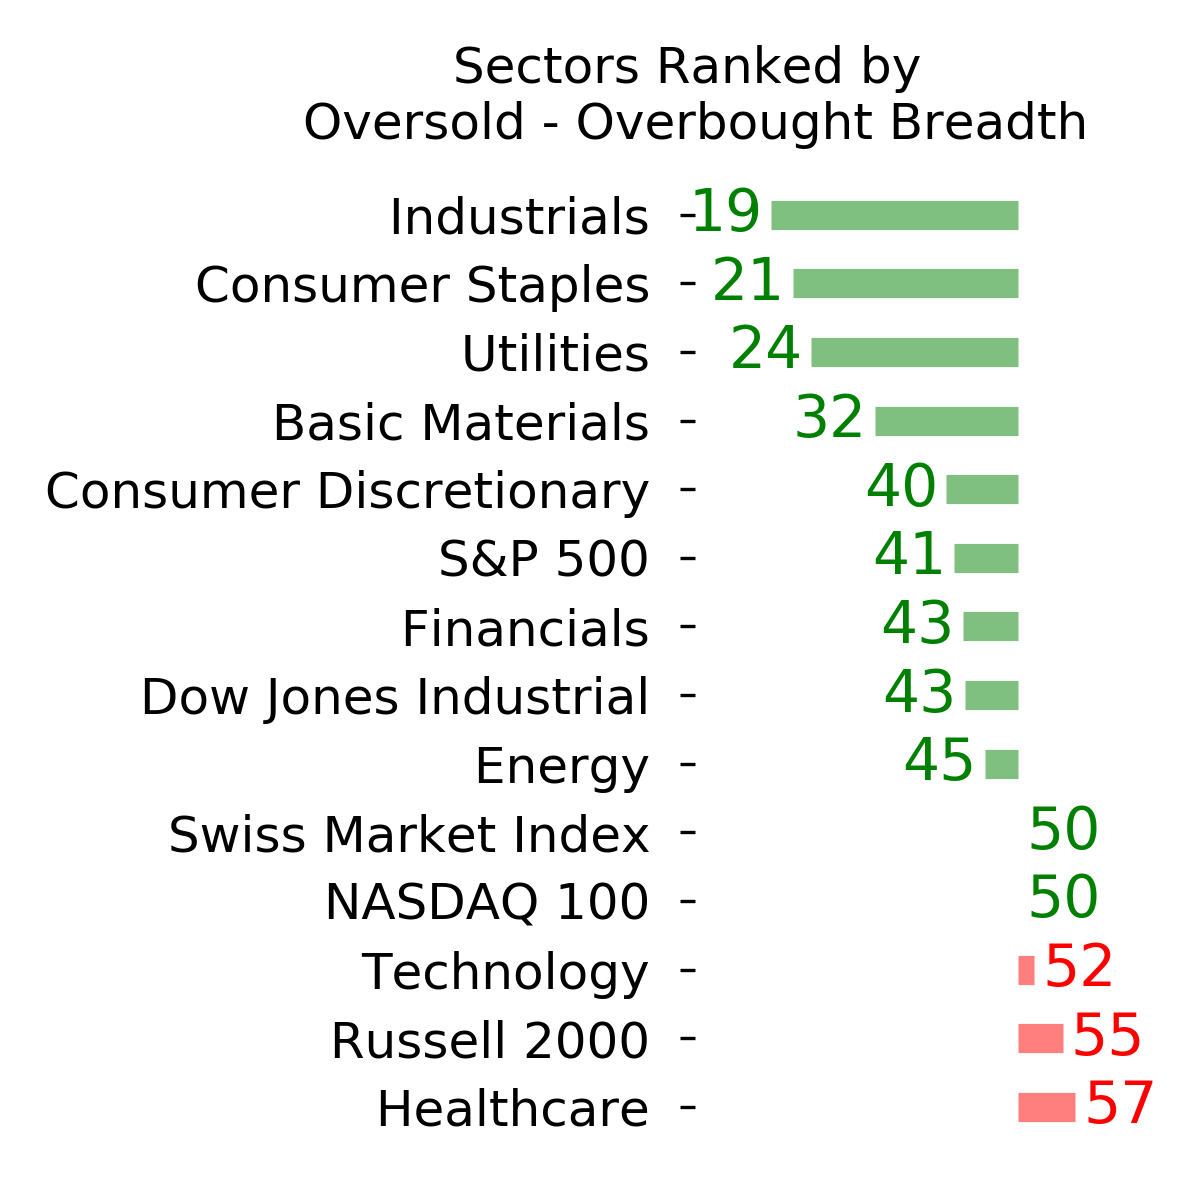
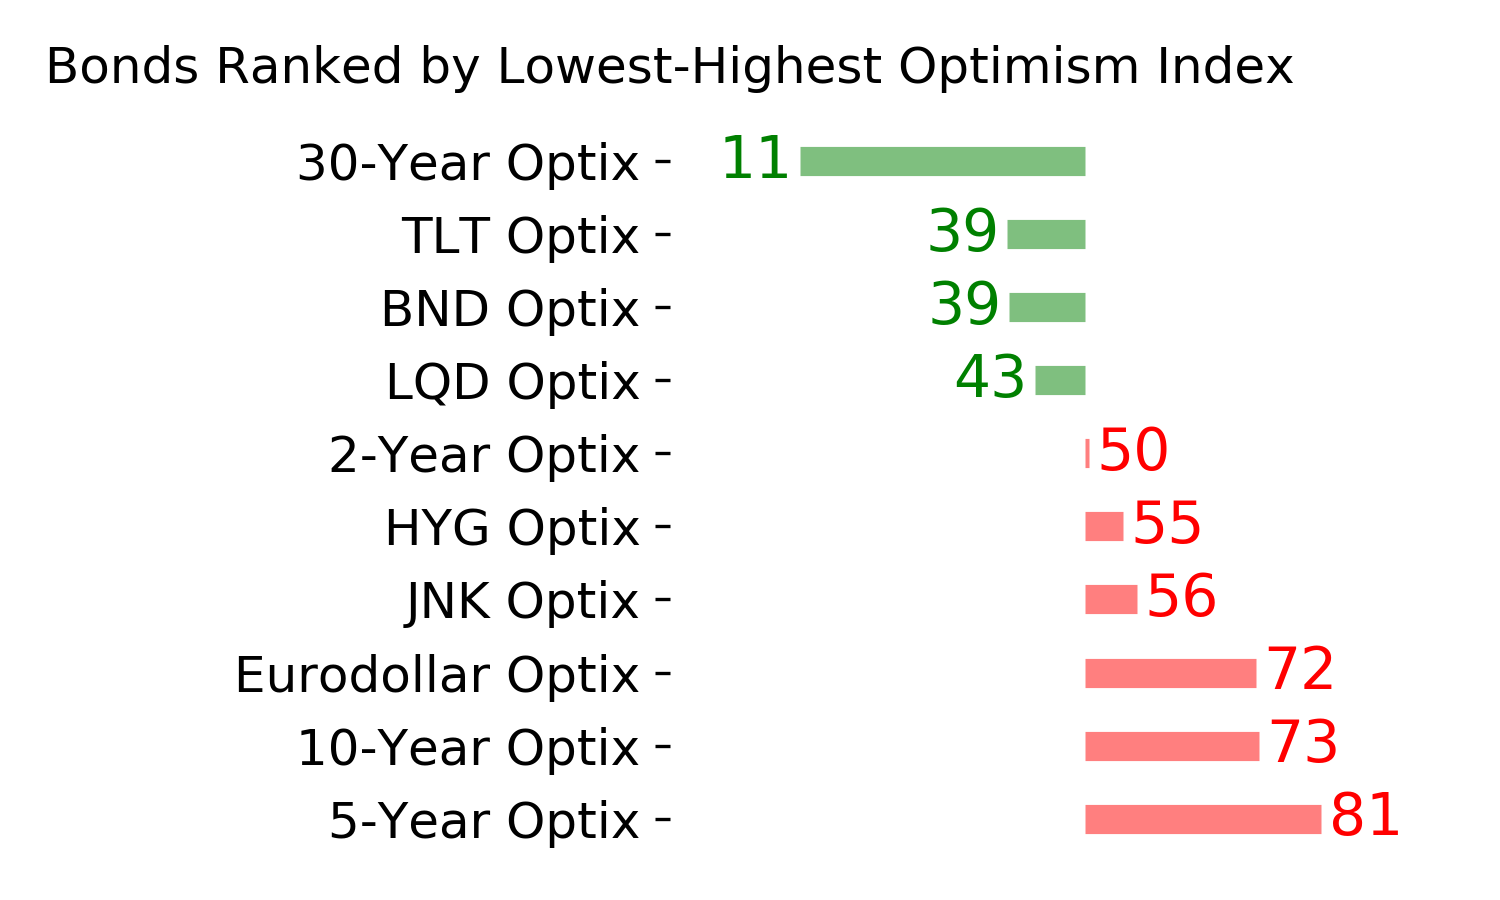
Ranks
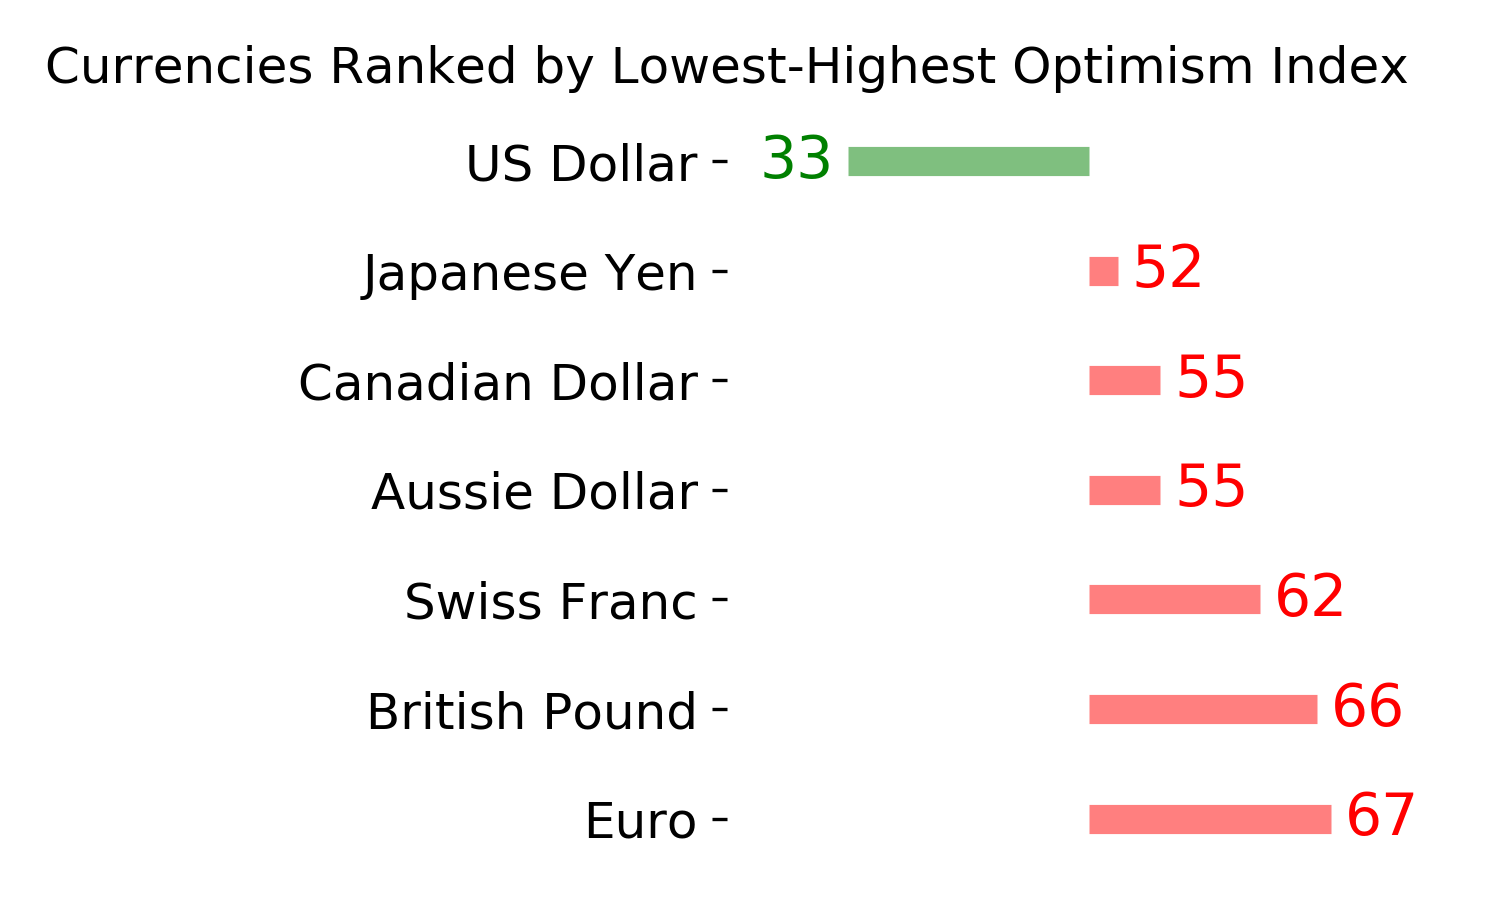
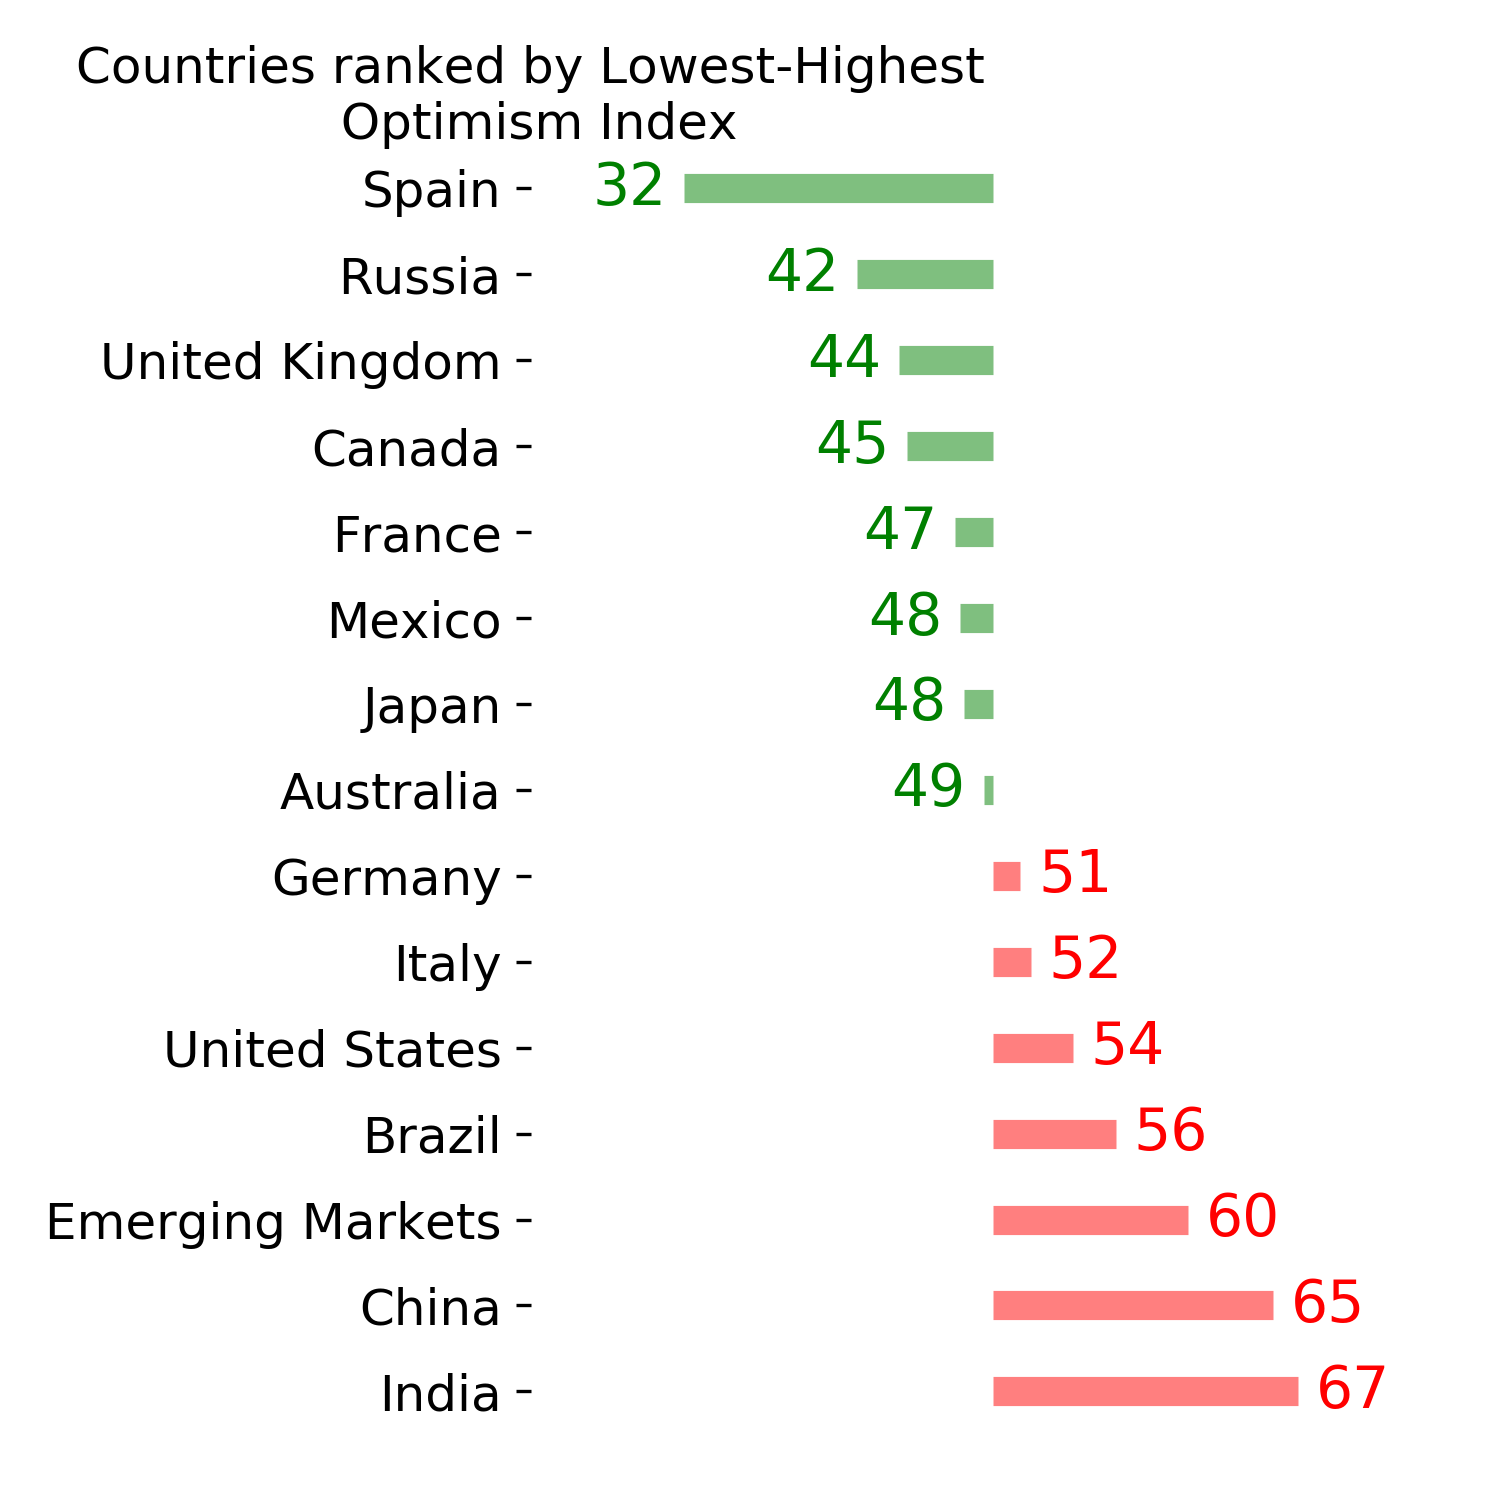
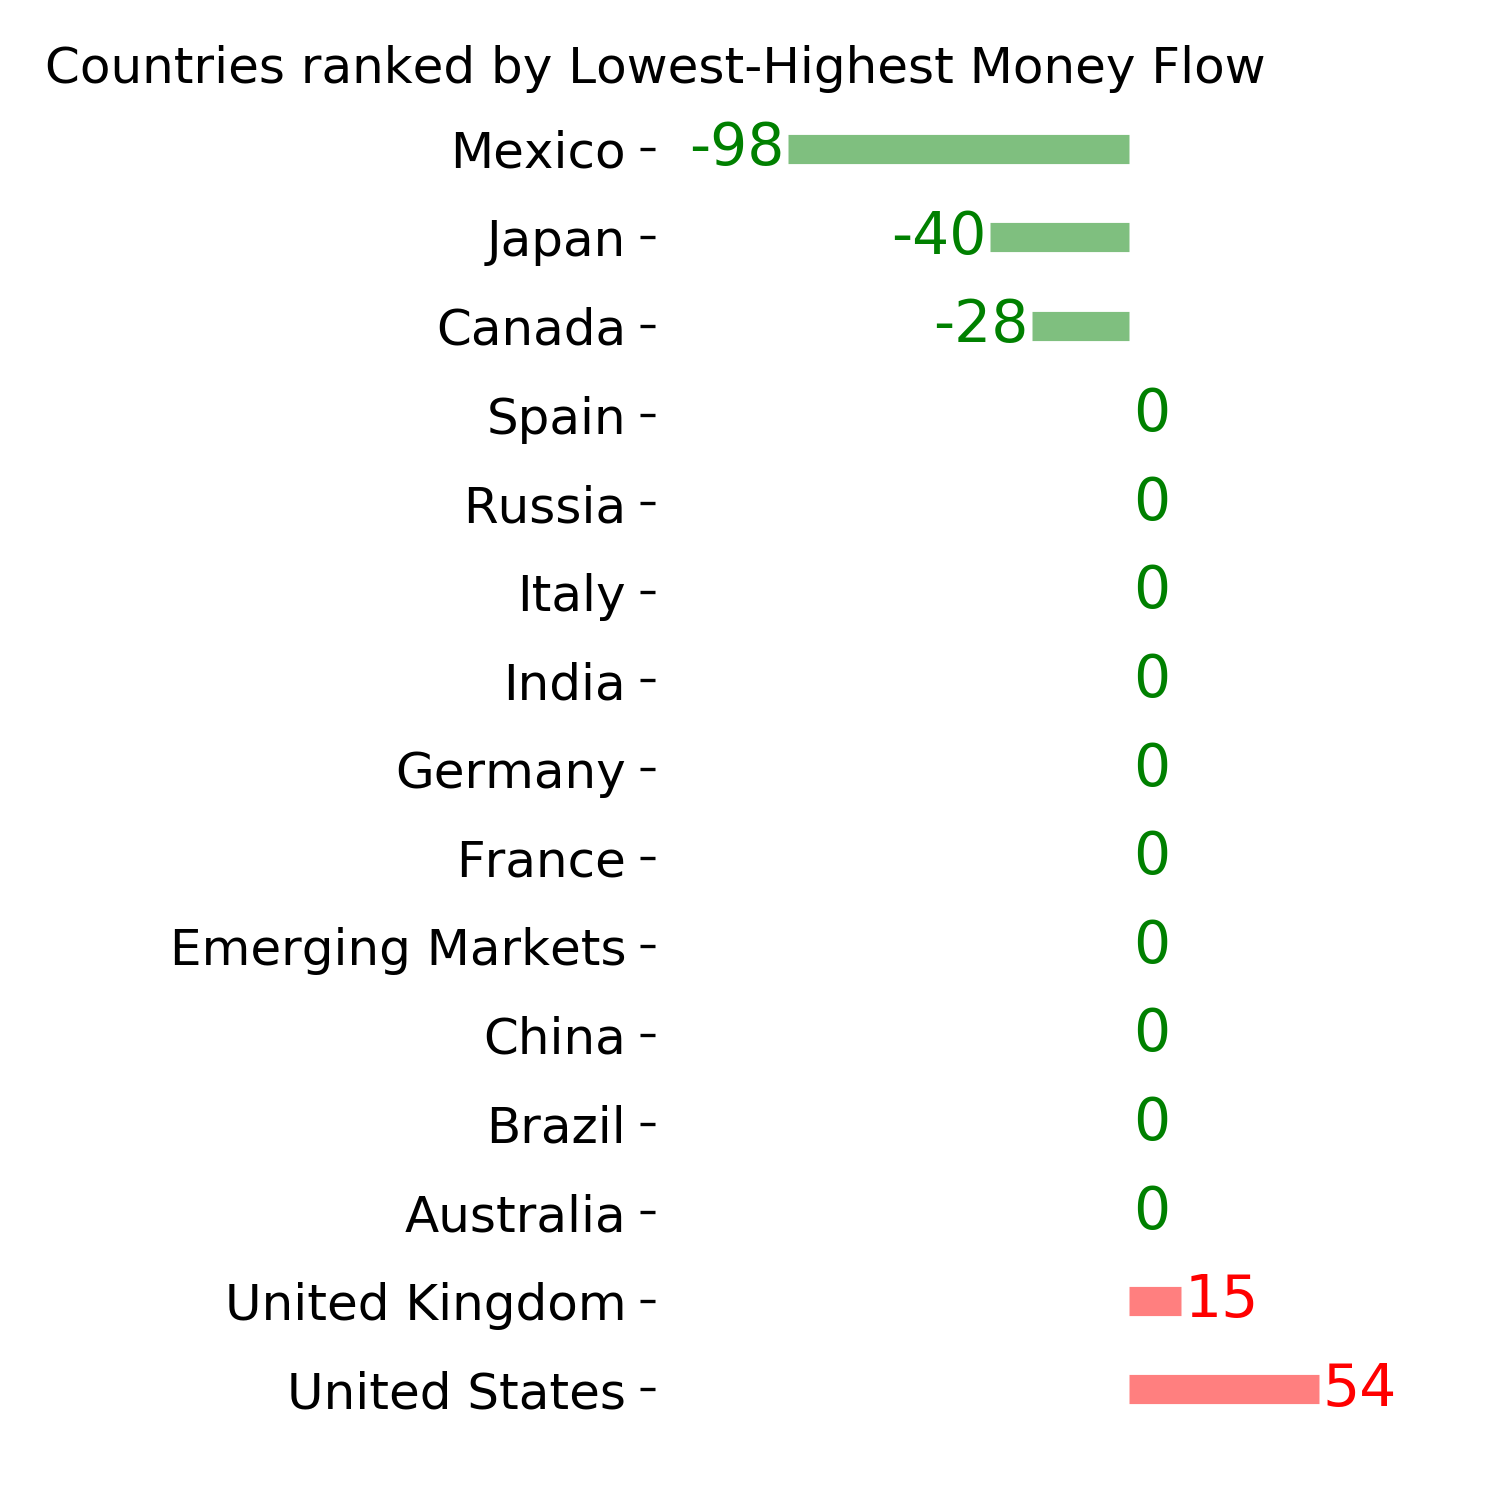
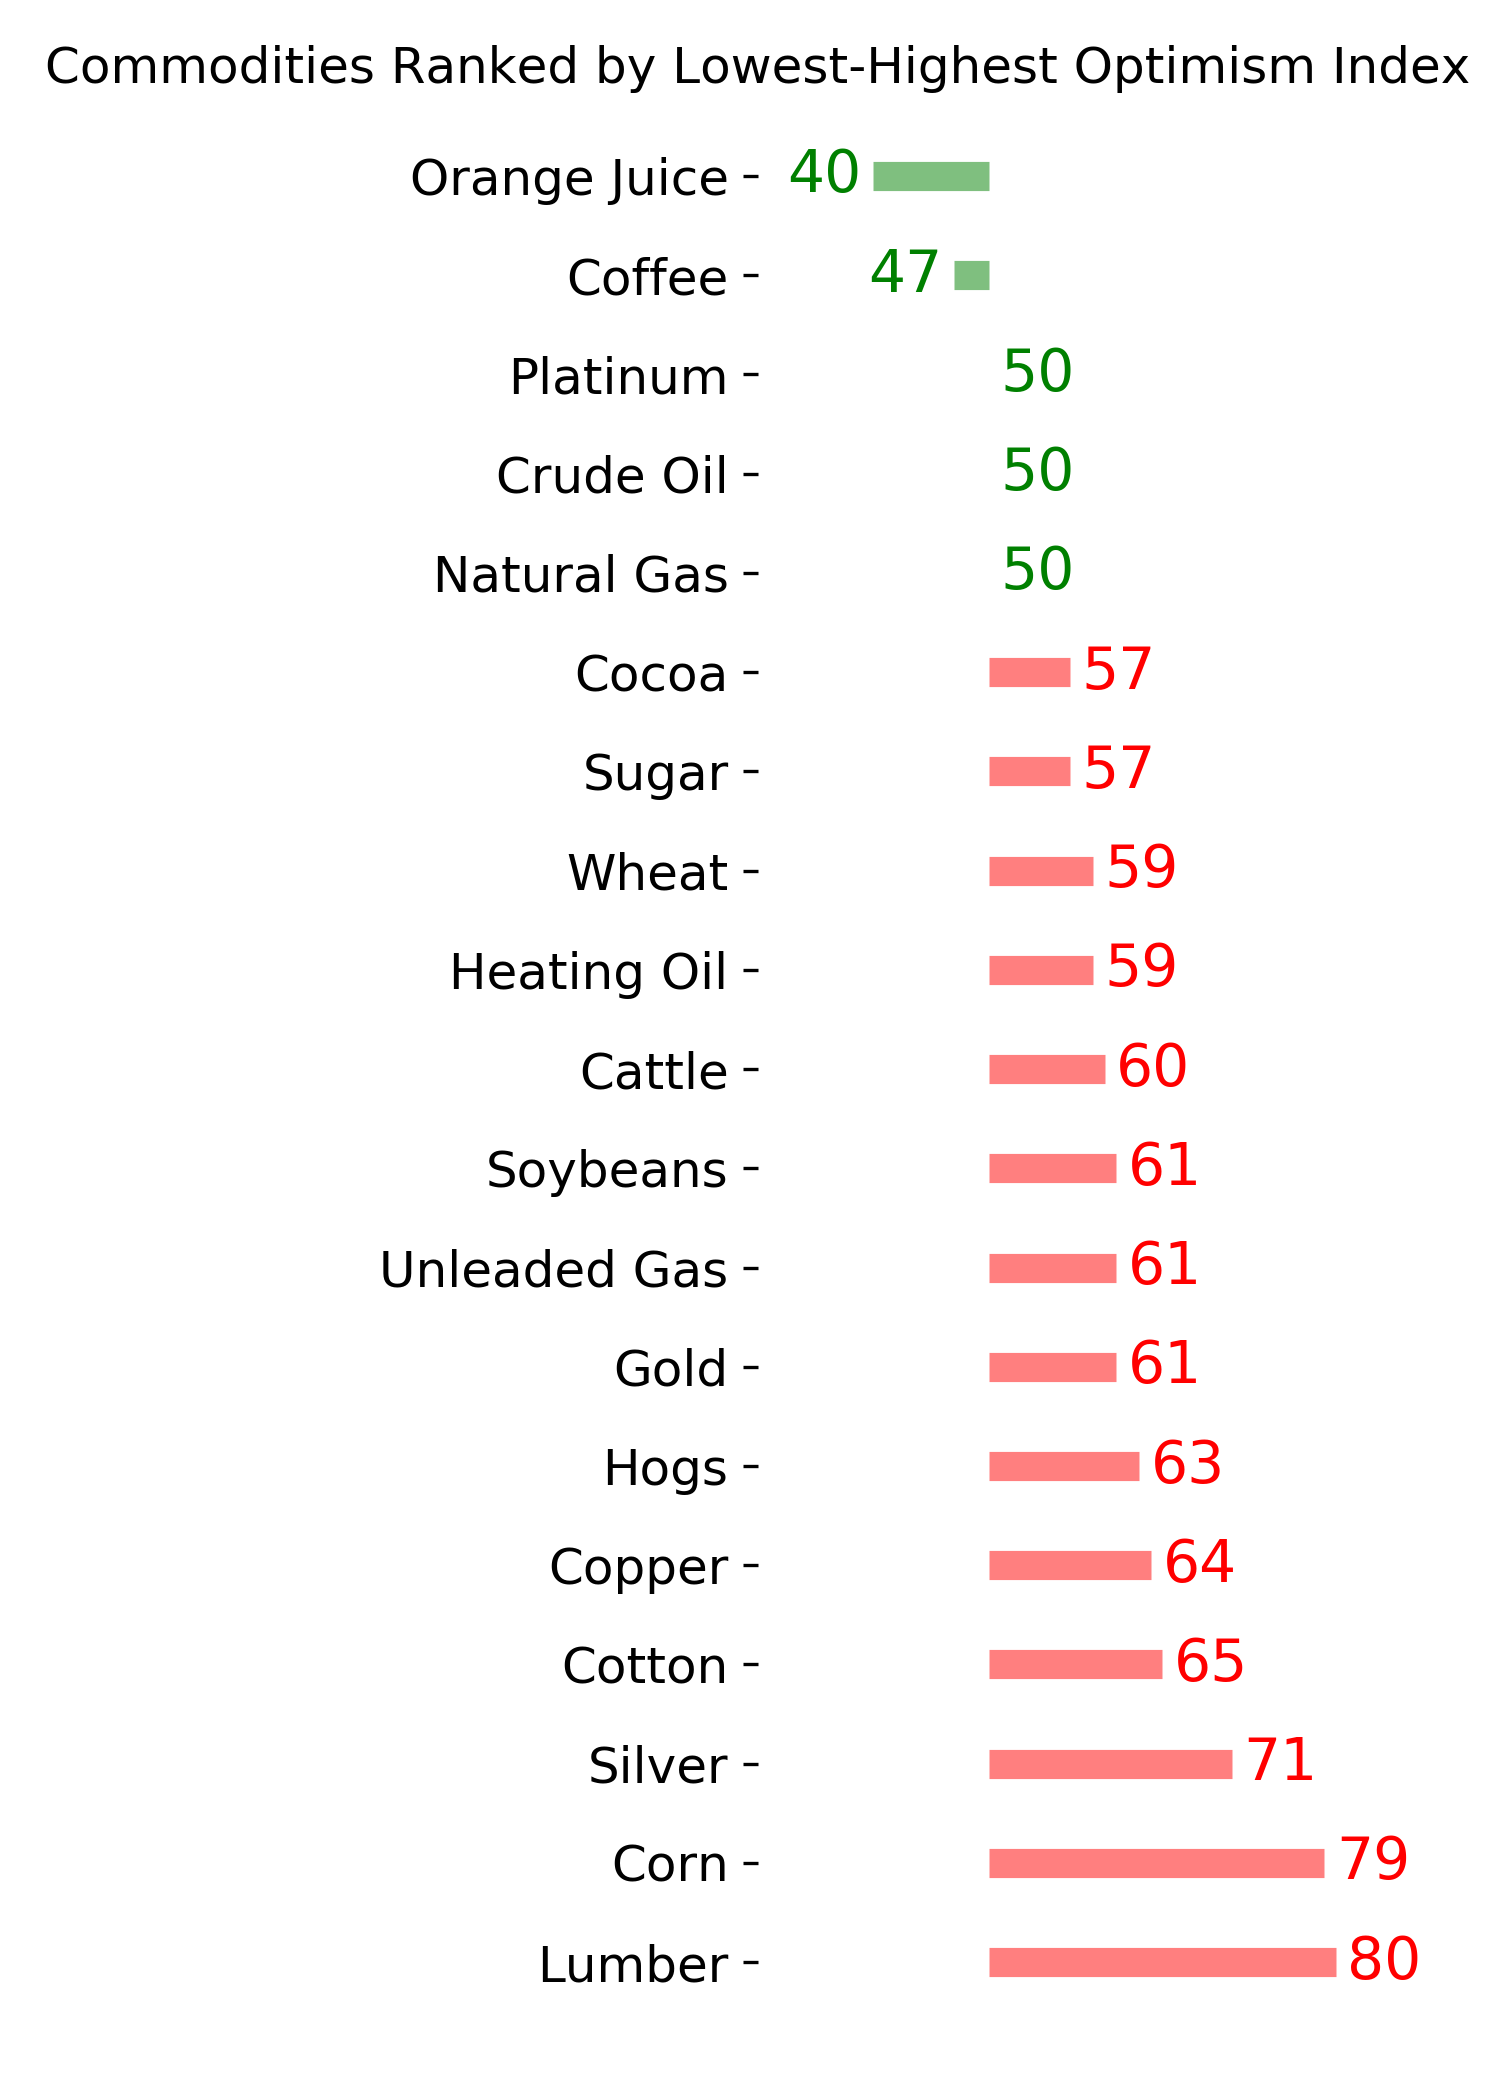
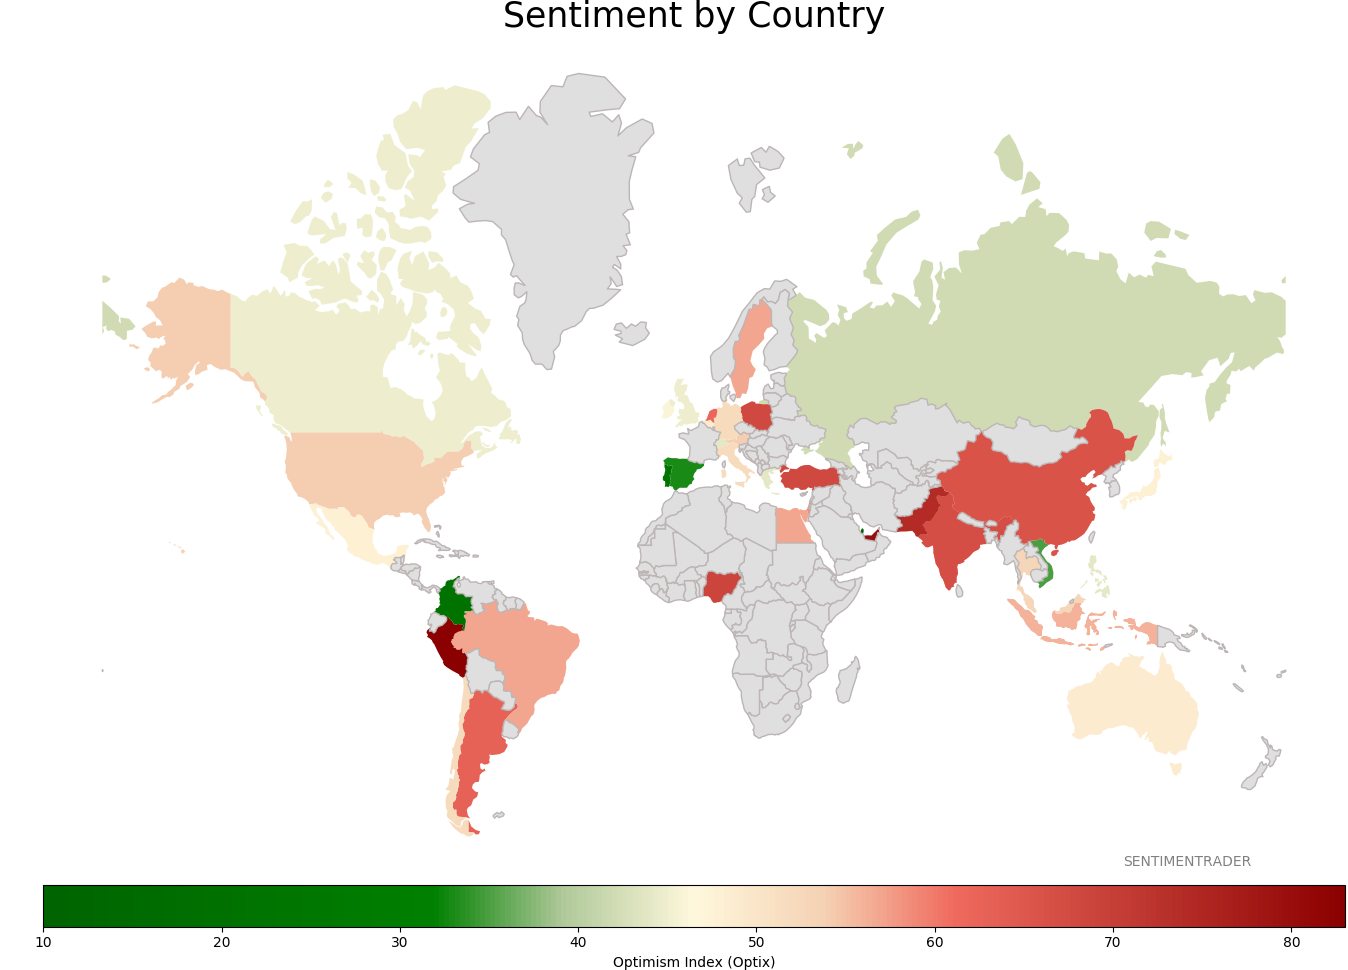
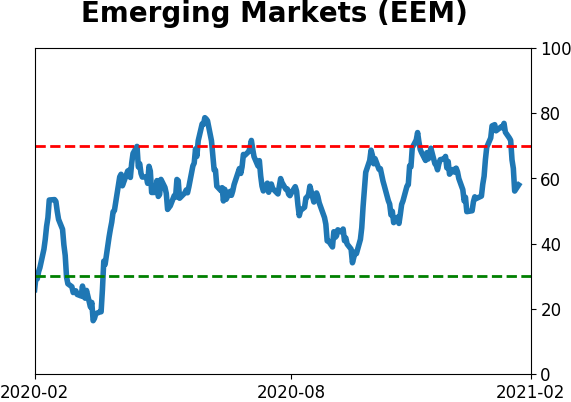
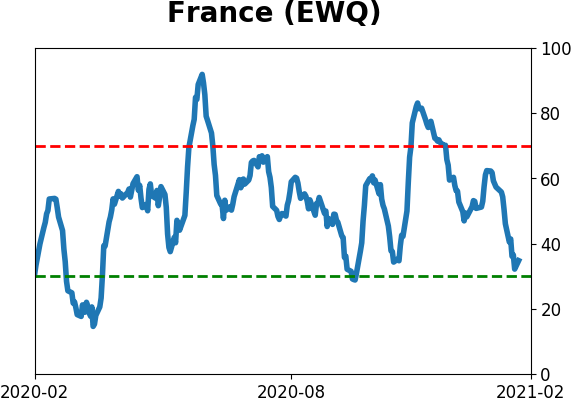
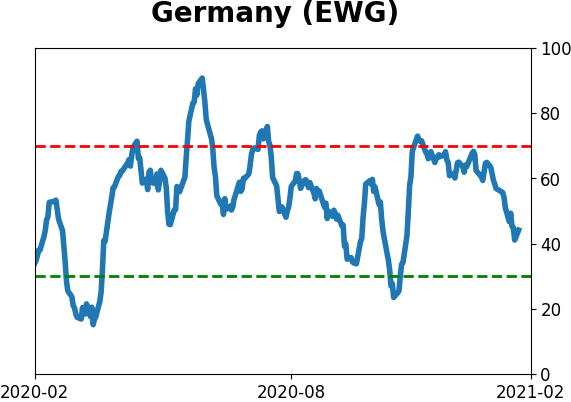
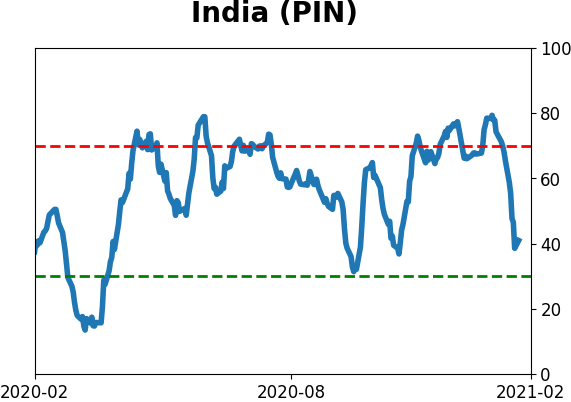
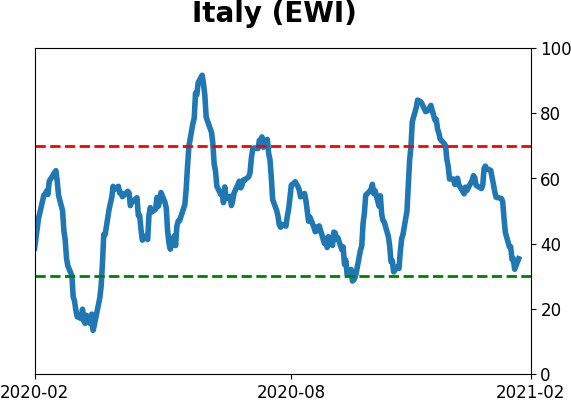
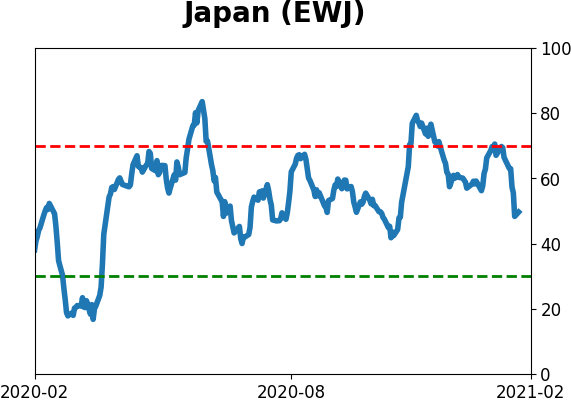
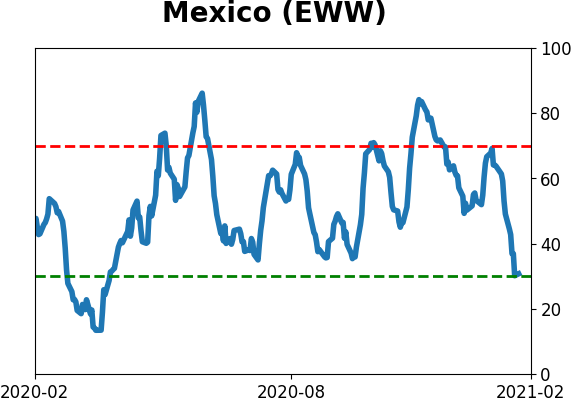
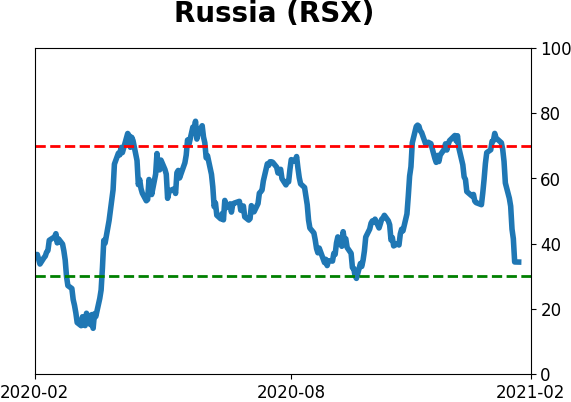
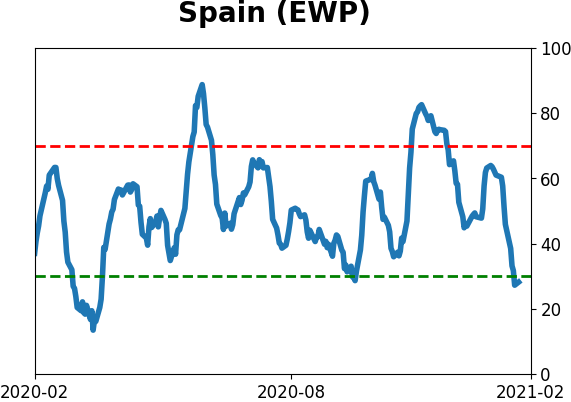
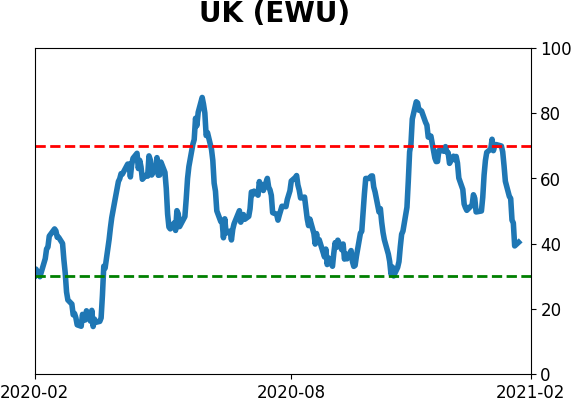
Sentiment Around The World
Optimism Index Thumbnails
|
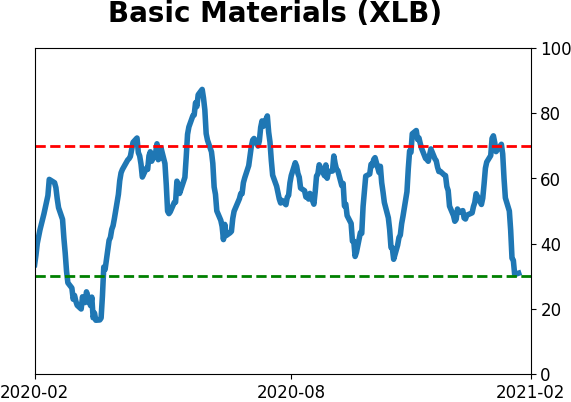
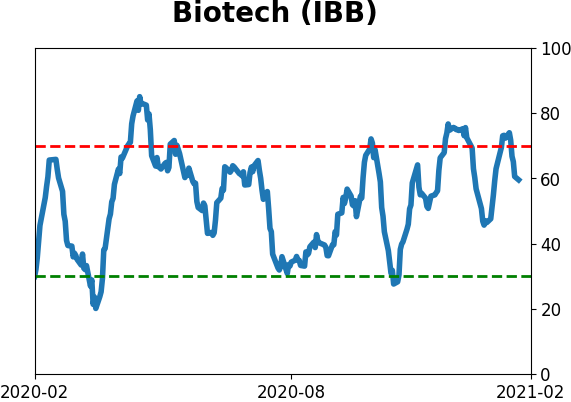
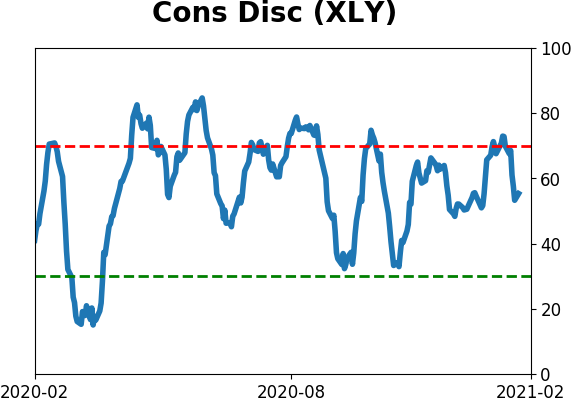
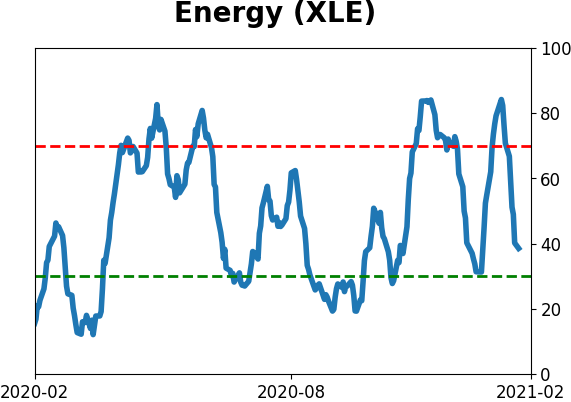
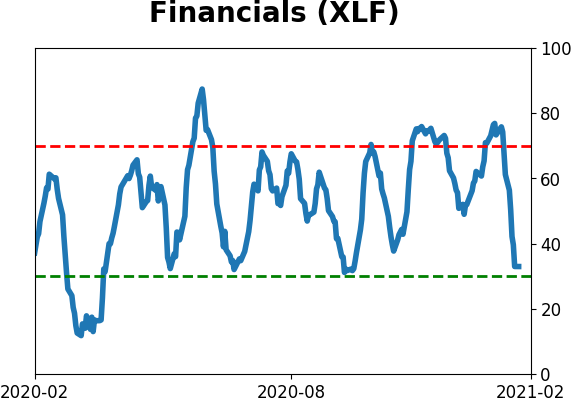
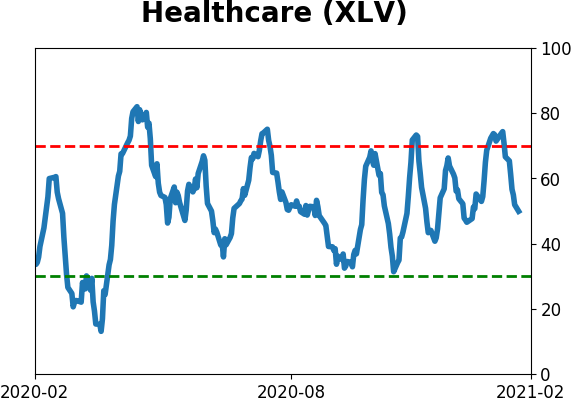
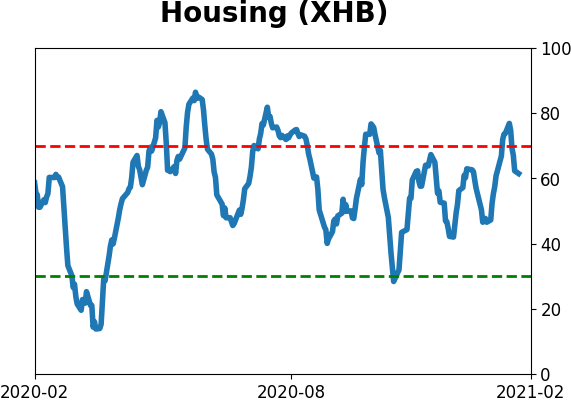
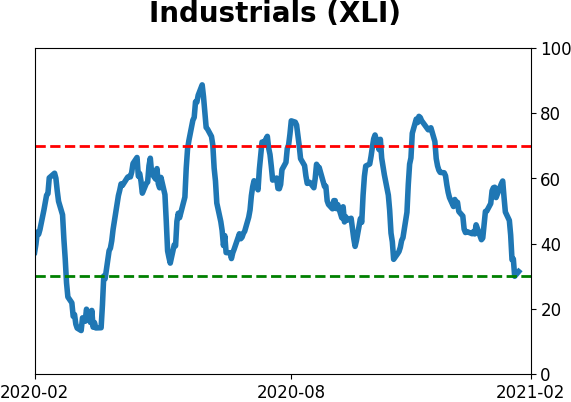
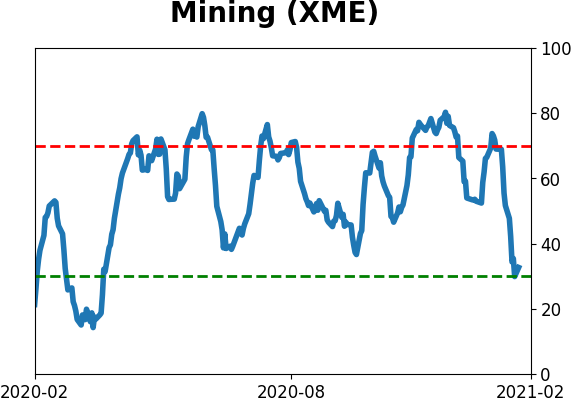
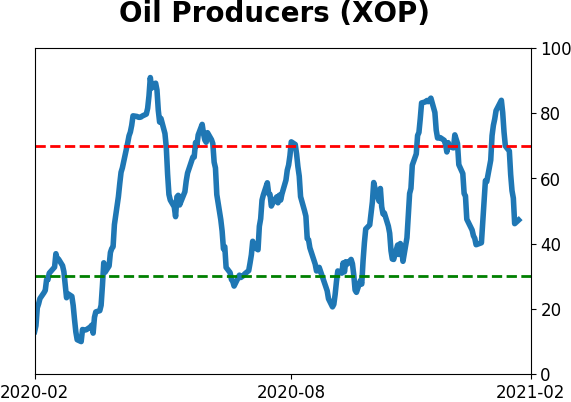
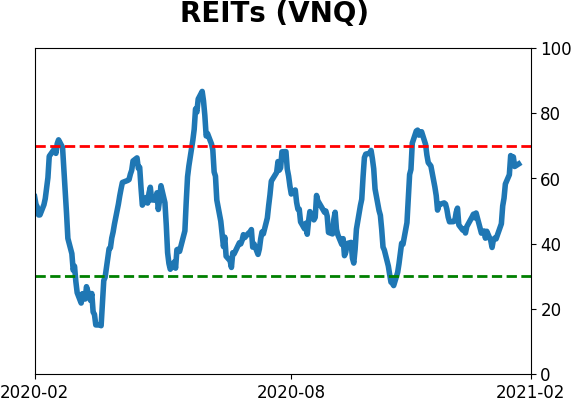
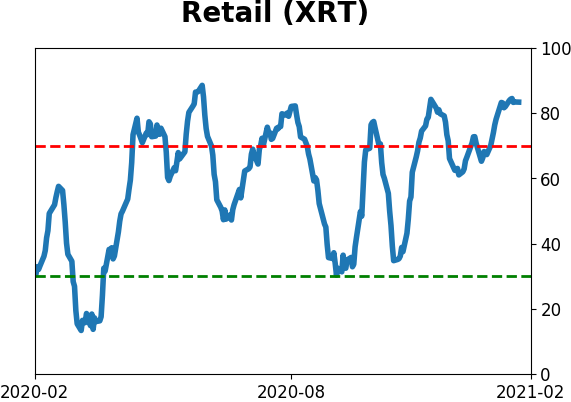
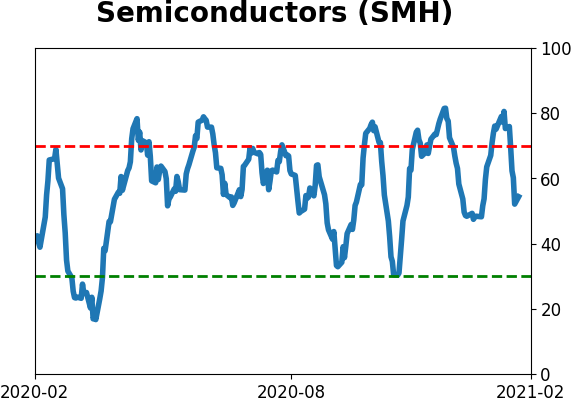
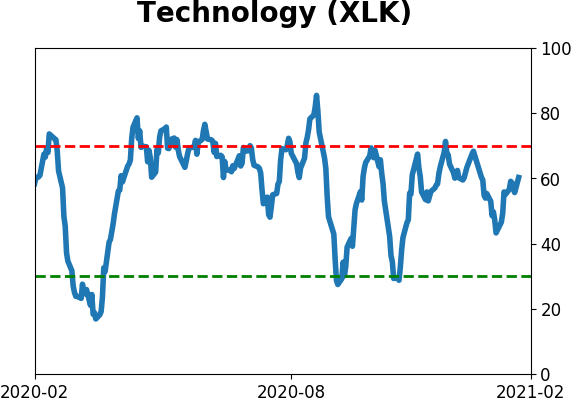
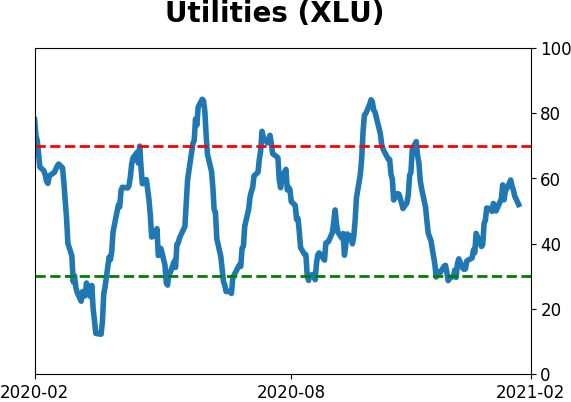
Sector ETF's - 10-Day Moving Average
|
|
|
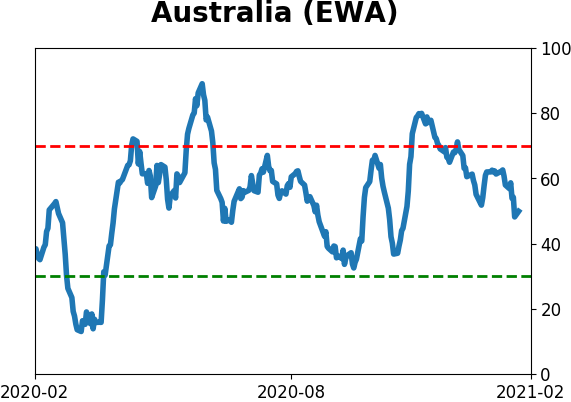
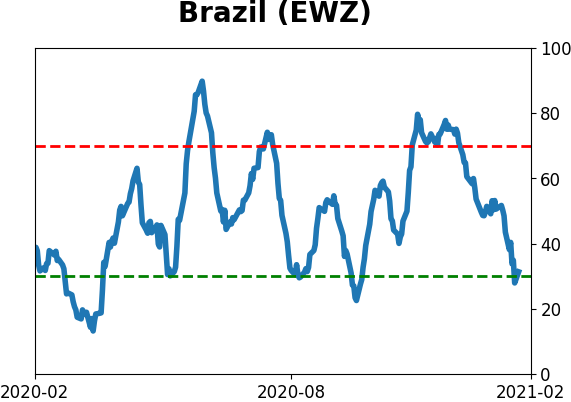
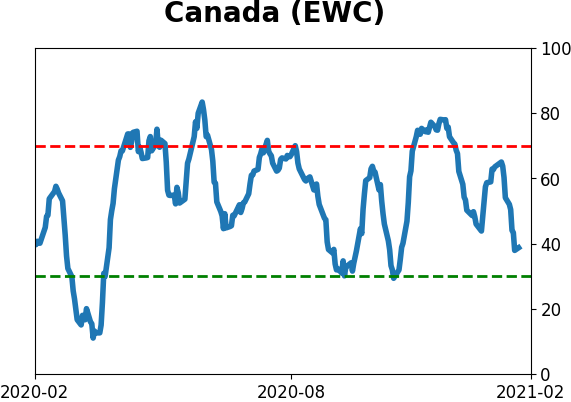
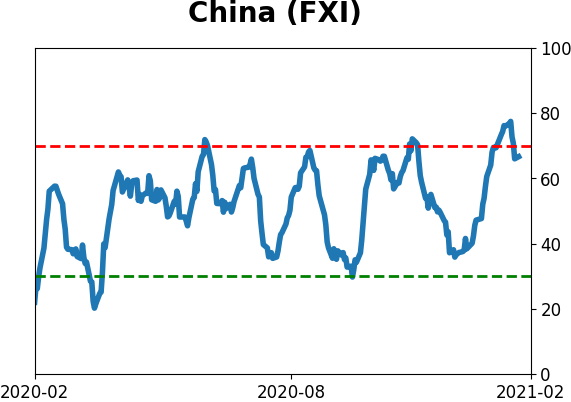
Country ETF's - 10-Day Moving Average
|
|
|
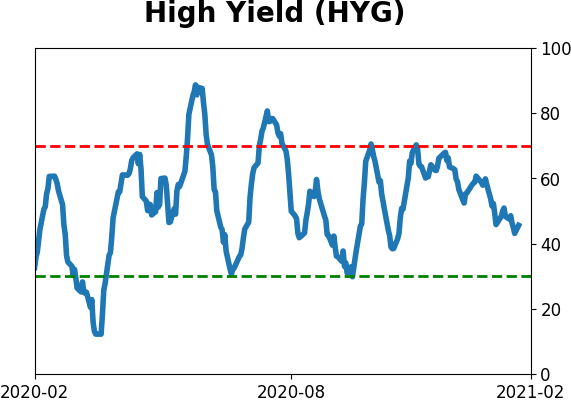
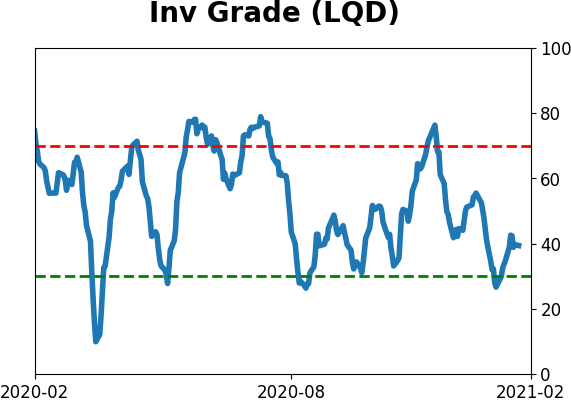
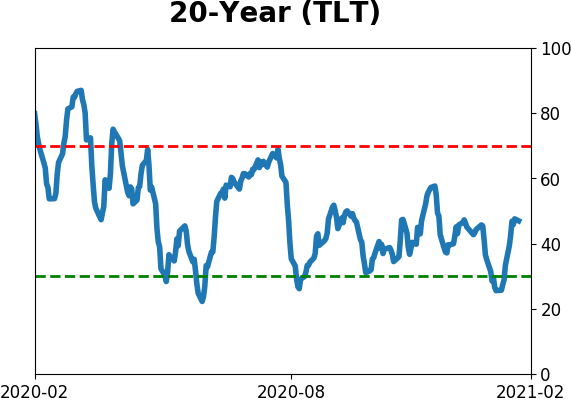
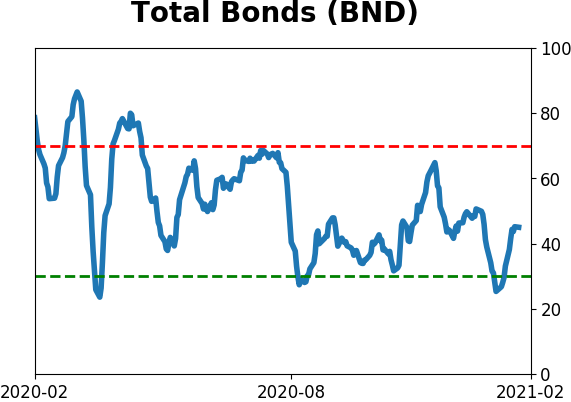
Bond ETF's - 10-Day Moving Average
|
|
|
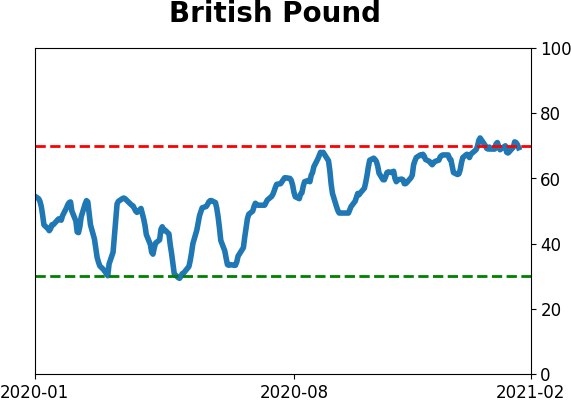
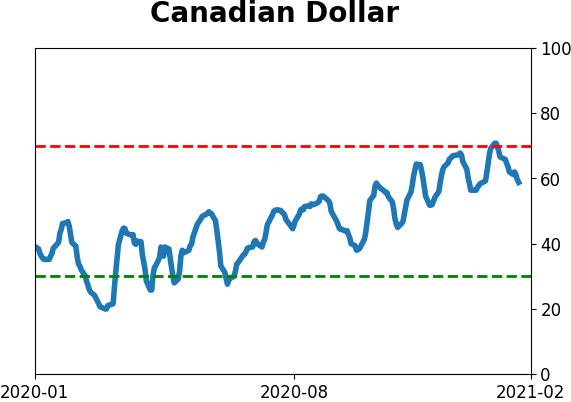
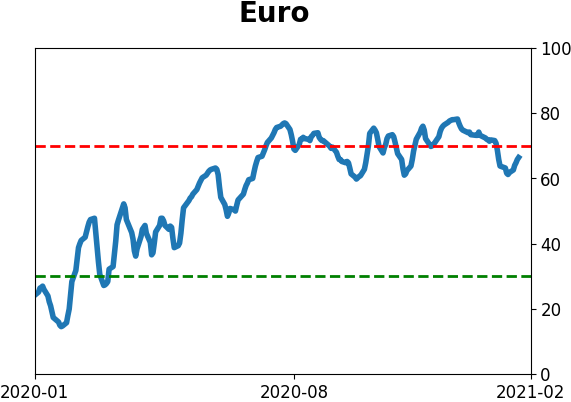
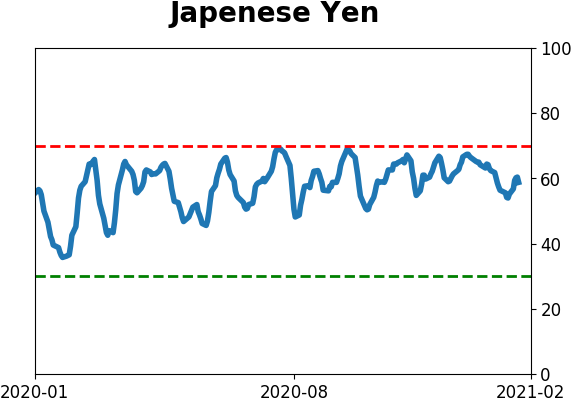
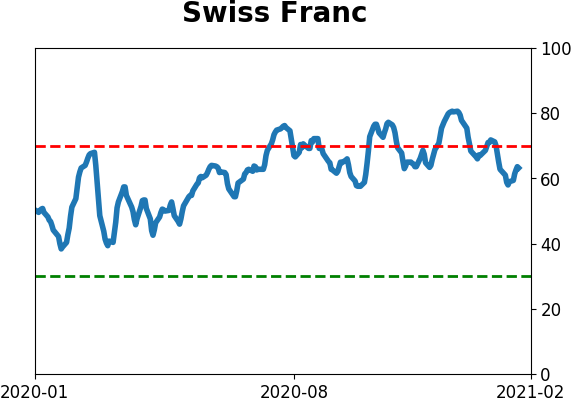
Currency ETF's - 5-Day Moving Average
|
|
|
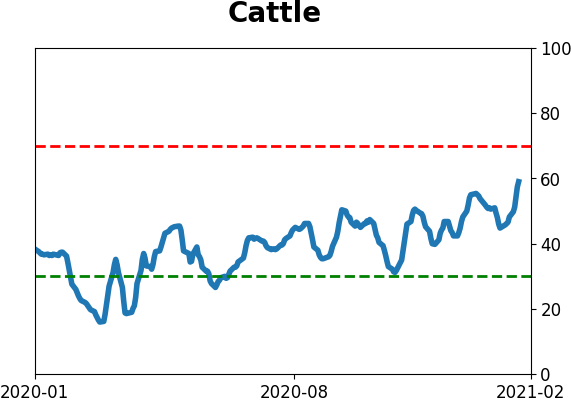
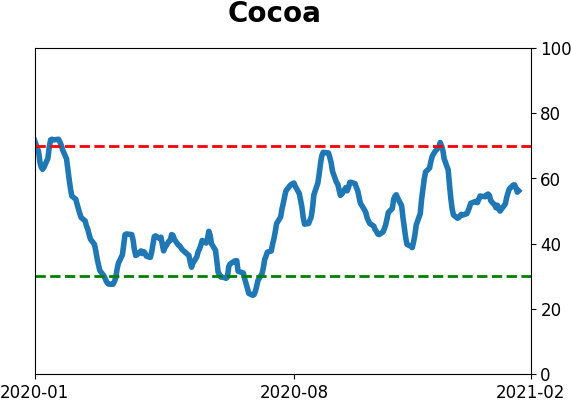
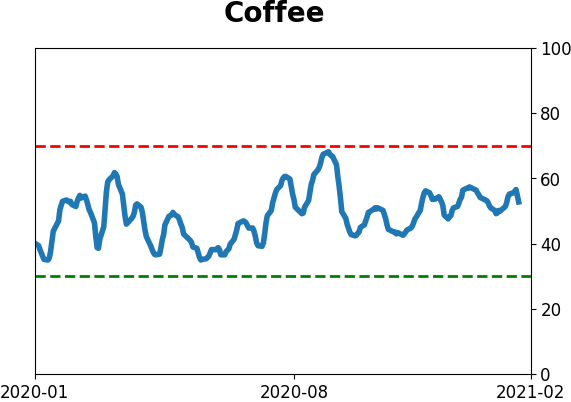
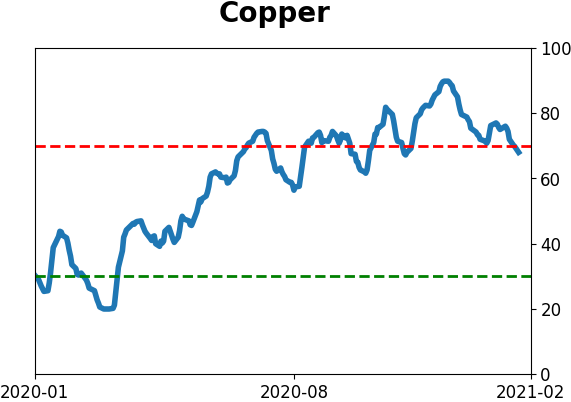
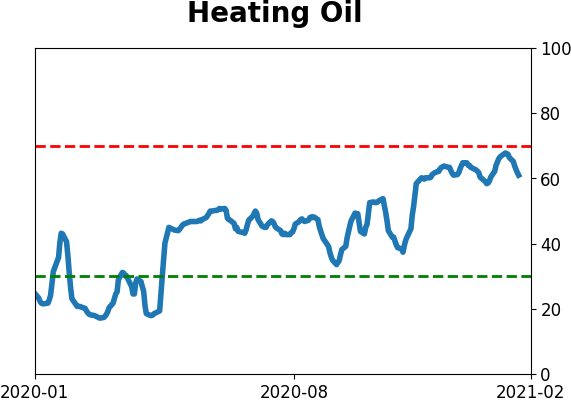
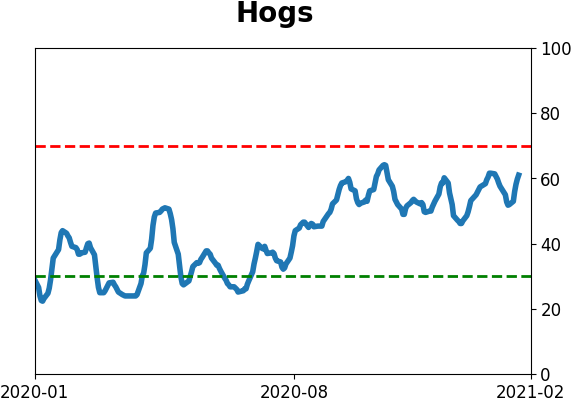
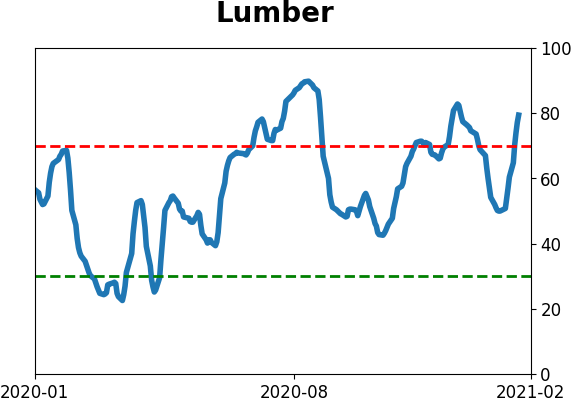
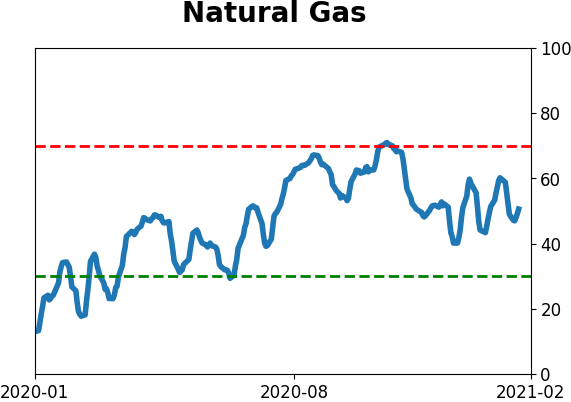
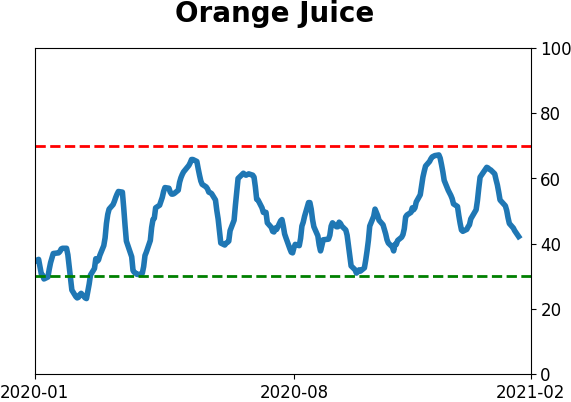
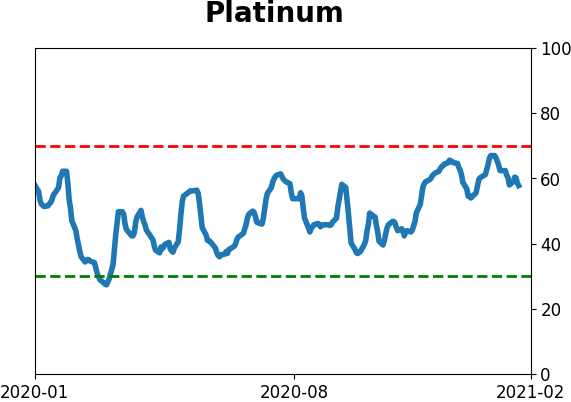
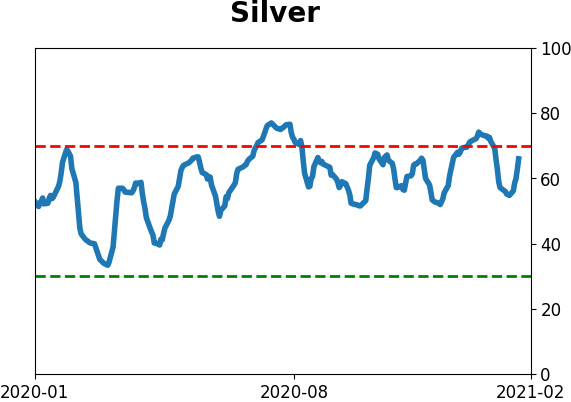
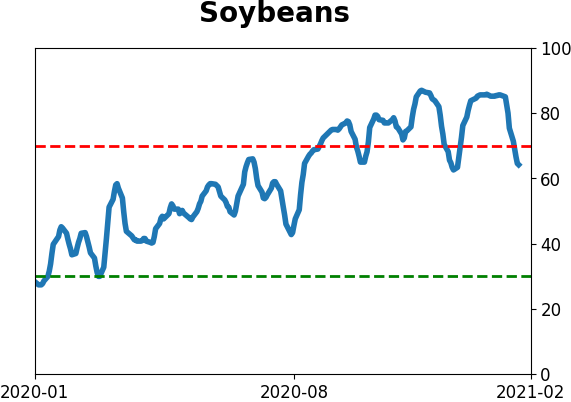
Commodity ETF's - 5-Day Moving Average
|
|