Headlines
|
|
Investors getting more and more comfortable with leverage:
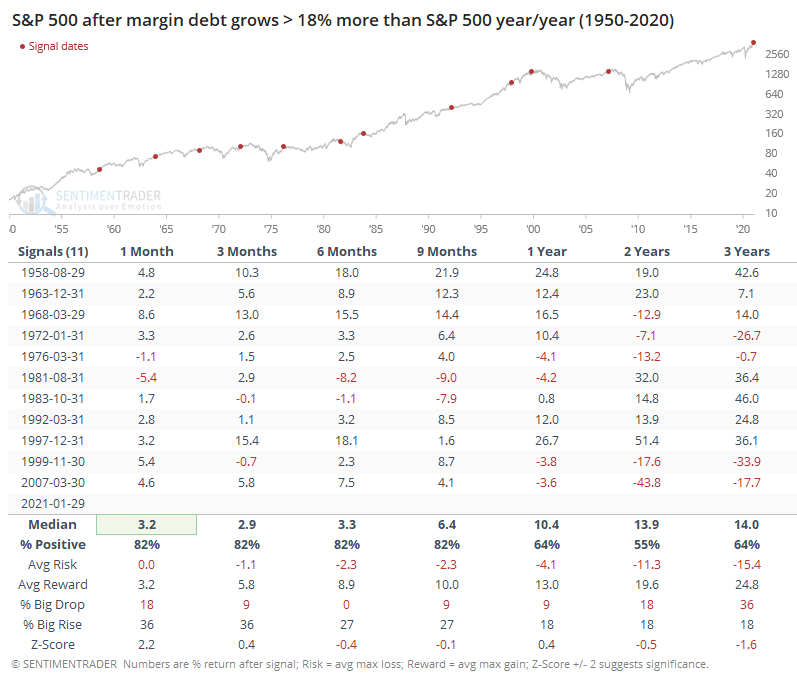
Investors have been increasingly aggressive in borrowing against their stock holdings. Margin debt is rising quickly, and at a faster pace than the rise in stocks would explain.
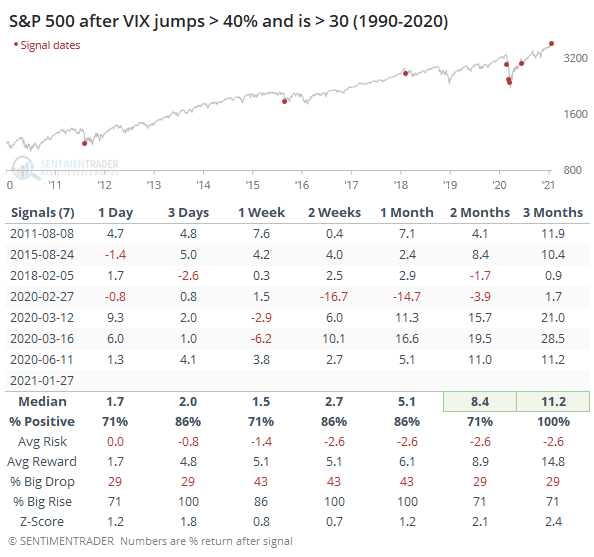
Fearful, already?: The drop on Wednesday was big, granted, but enough to trigger one of the largest spikes in the history of the VIX? Thanks to some of the outsized moves among a pocket of stocks, the VIX has remained elevated and part of the jump could be due to call options, not just puts, which is highly unusual. A drop in Tesla after-hours is pushing the VIX even higher, more than 60% above Tuesday's close. On the surface, a spike in an already-high VIX has been a positive for stocks (it never happened prior to 2011), but we're not assigning this one all that much weight.
Bottom Line:
See the Outlook & Allocations page for more details on these summaries STOCKS: Weak sell
We're in an extremely speculative environment that is enough to become defensive, especially with recent cracks showing in what had been pristine breadth conditions. The spike in fear on Wednesday is likely not enough to offset the negatives. BONDS: Weak buy
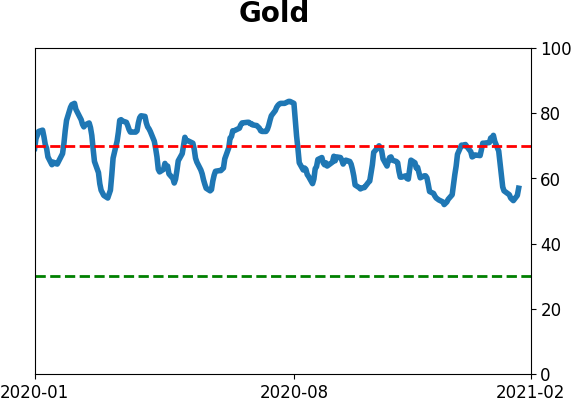
Various parts of the market have been hit in recent weeks, with mild oversold conditions that have started to reverse. GOLD: Weak buy
A dollar trying to rebound from a severe short position has weighed on gold and miners. The types of signals they've given in recent weeks, within the context of their recent surge, have usually resulted in higher prices.
|
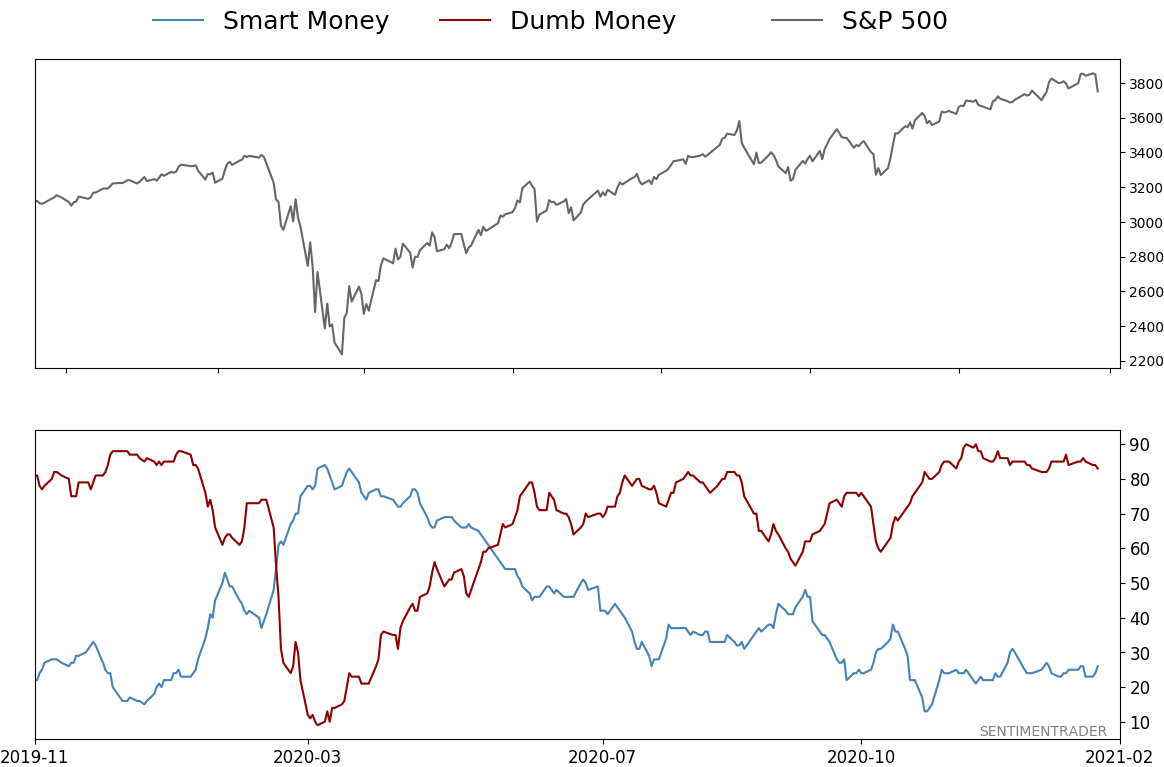
Smart / Dumb Money Confidence
|
Smart Money Confidence: 26%
Dumb Money Confidence: 83%
|
|
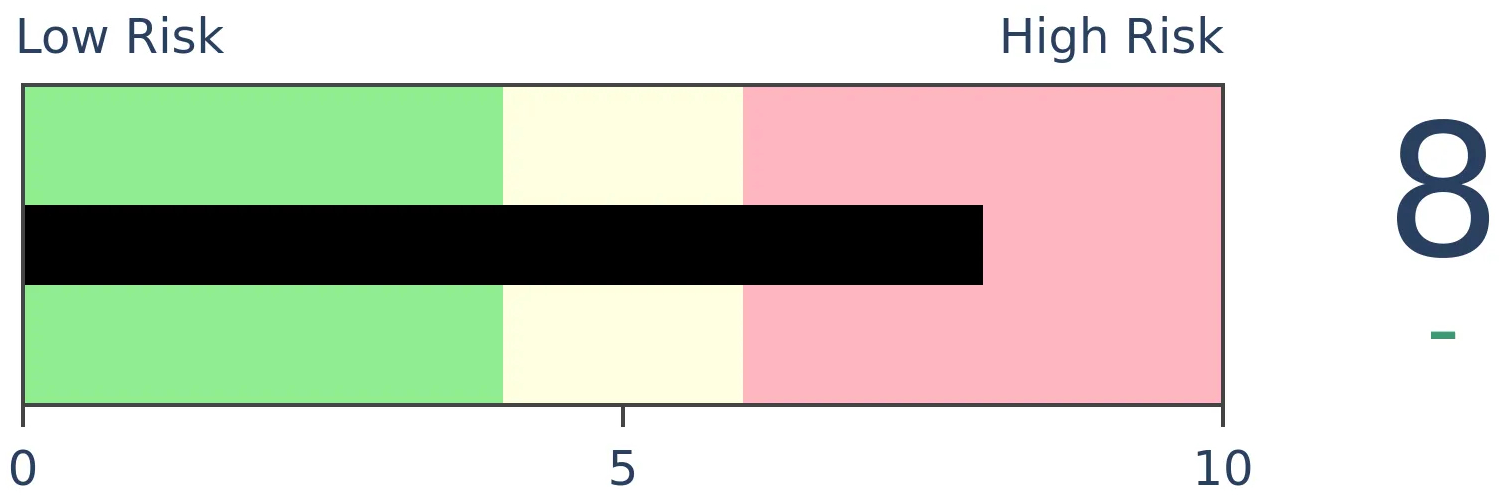
Risk Levels
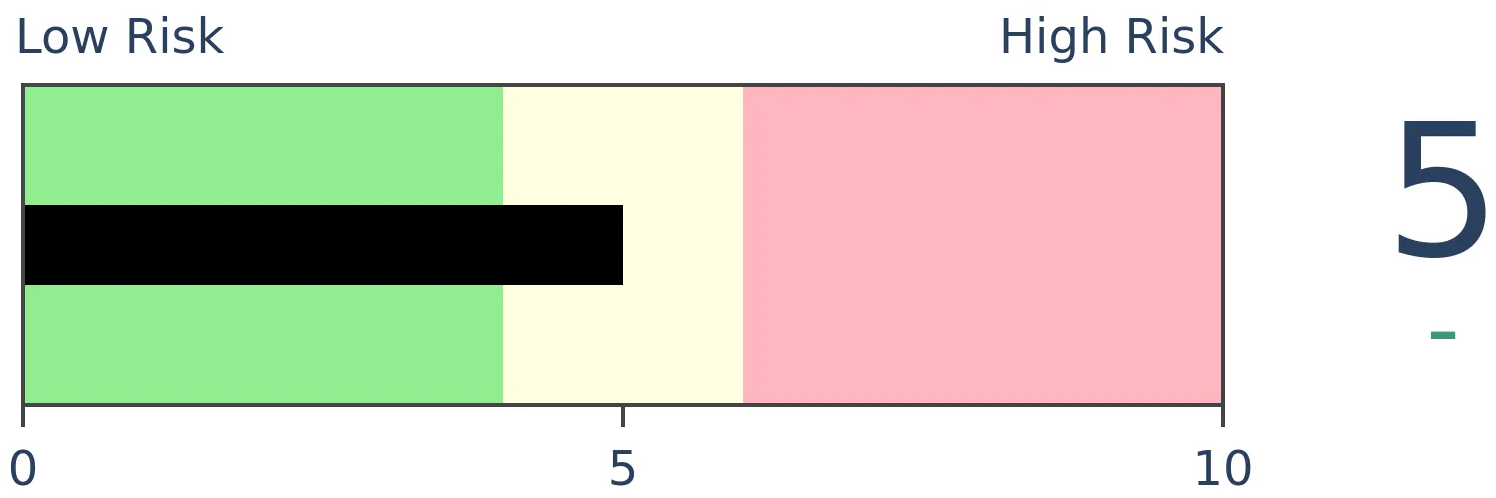
Stocks Short-Term
|
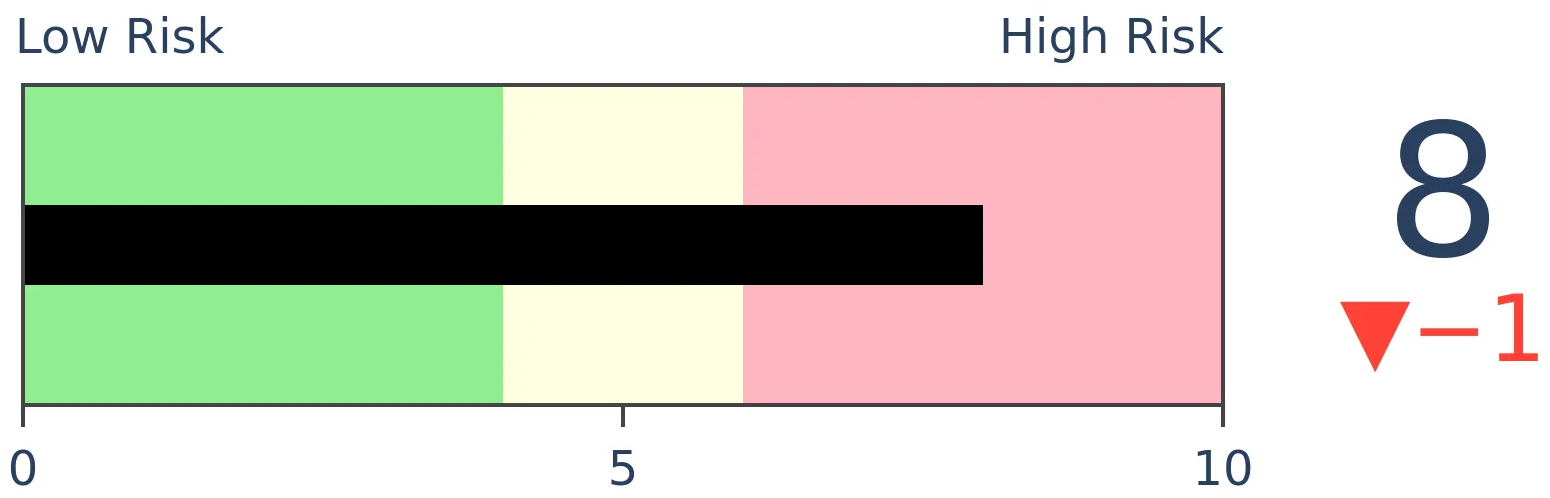
Stocks Medium-Term
|
|
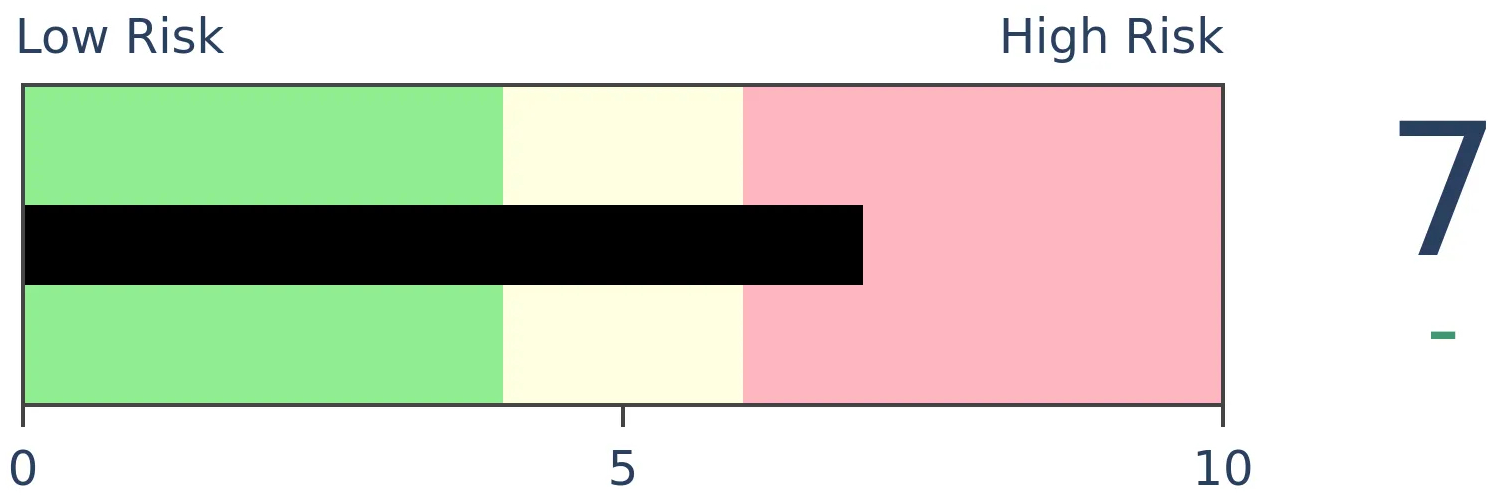
Bonds

|
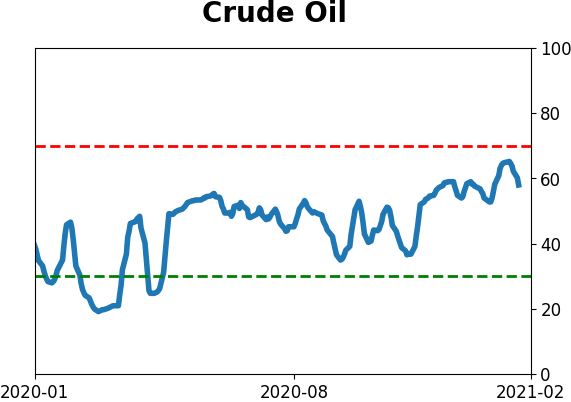
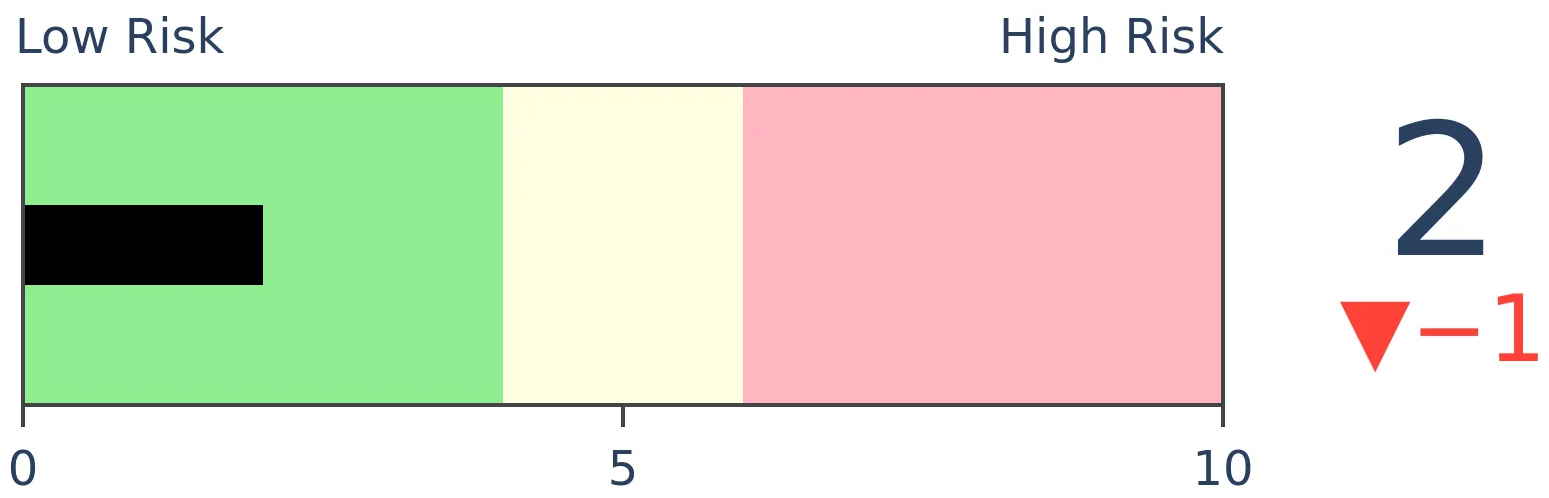
Crude Oil
|
|
Gold
|
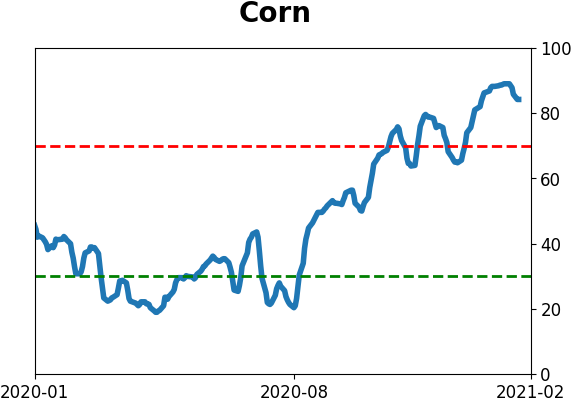
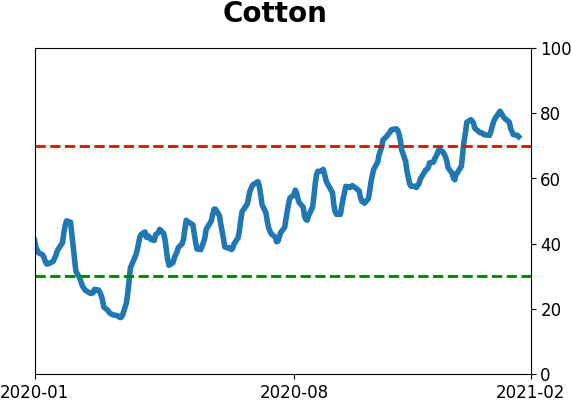
Agriculture
|
|
Research
BOTTOM LINE
Investors have been increasingly aggressive in borrowing against their stock holdings. Margin debt is rising quickly, and at a faster pace than the rise in stocks would explain.
FORECAST / TIMEFRAME
None
|
A month ago, we saw that margin debt was picking up. Investors had quickly been becoming more comfortable borrowing funds against their stock holdings, and debt was rising quickly from its low. It kept going.
The latest figures show that debt has jumped more than 33% from a year ago, the fastest pace in about 7 years. It's still below the 60% gains seen at the prior two major peaks, though.
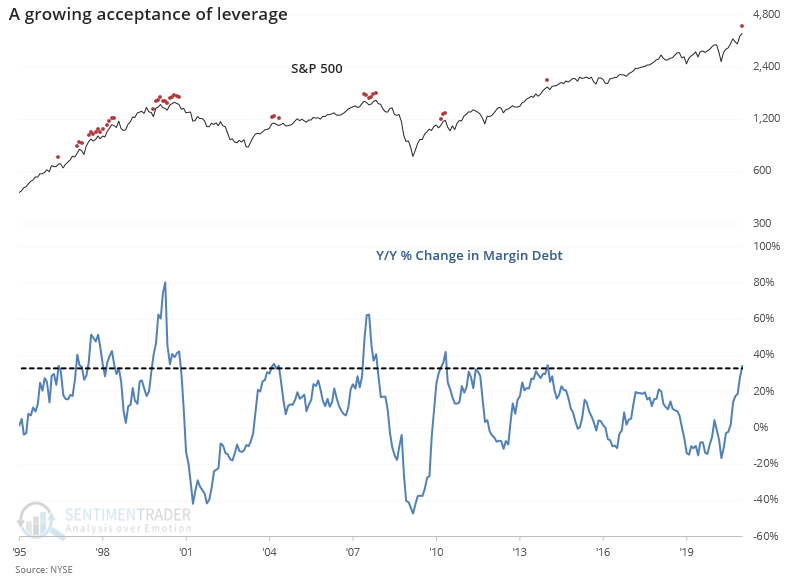
Zooming out to 1950, it's still among the higher rates of change.
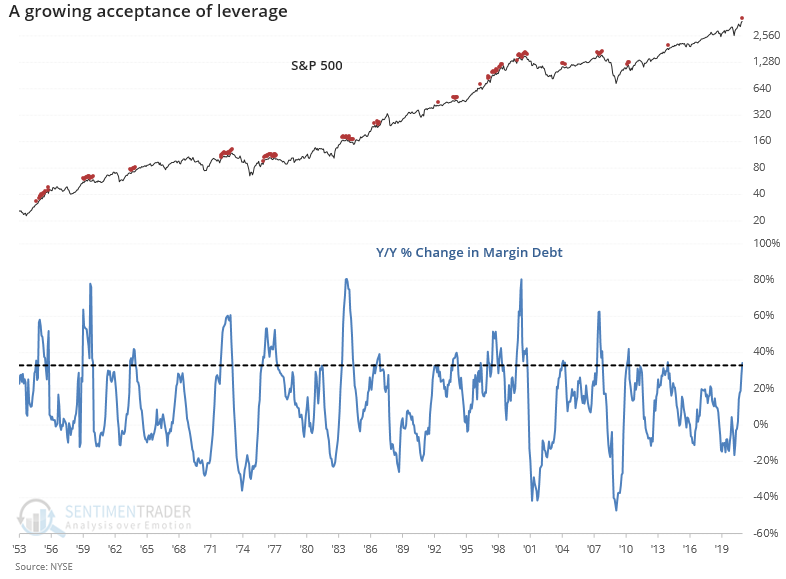
One of the things we've been pointing out since 2015 or so is that even though debt was growing, it was only about in line with the growth in stock prices. We should expect that. It wasn't anything like 2000 and 2007 when debt ballooned "irrationally" more than stock prices.
Lately, we're starting to see the very beginning that this is changing. The jump in debt has outpaced the rise in the S&P 500 by nearly 20%.
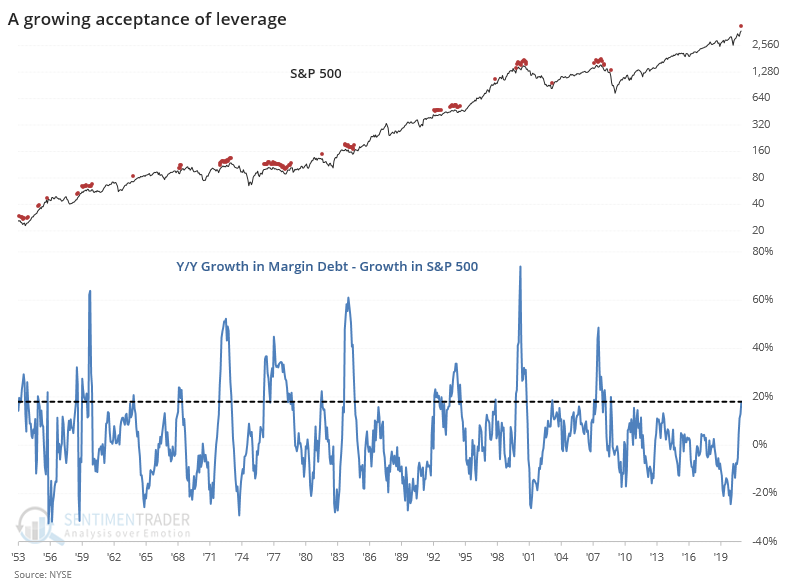
These increases in debt didn't necessarily lead to imminent doom. Note that the dates in the table are moved forward one month to account for the delay in reporting.
At the same time that debt is growing, free credits (cash) isn't keeping up, so NYSE Available Cash, the net difference between debt and cash, is nearing a record low.
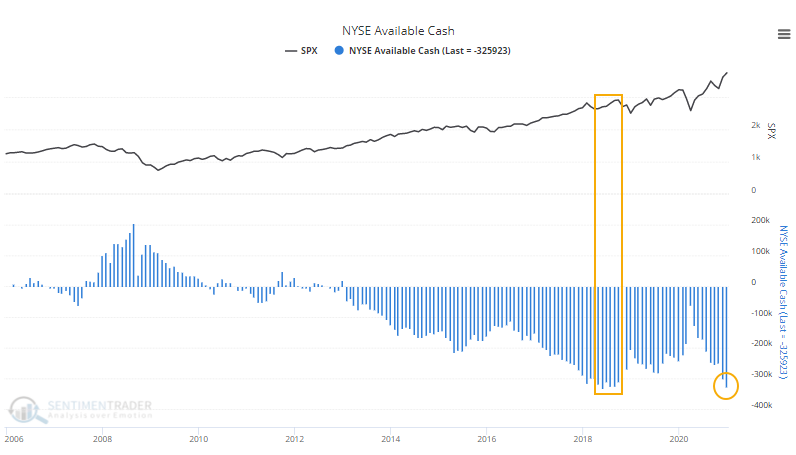
This can remain low for a long time, and there isn't necessarily any lower bound, but the pace of its shrinkage is alarming.
Margin debt tends to get quite a bit of attention, and it can be an effective indicator at true extremes, which might come around once a decade or so. It seems like we're on our way to a signal that could be a true point of concern, and maybe it's already on track to trigger in January, we just won't know for another month.
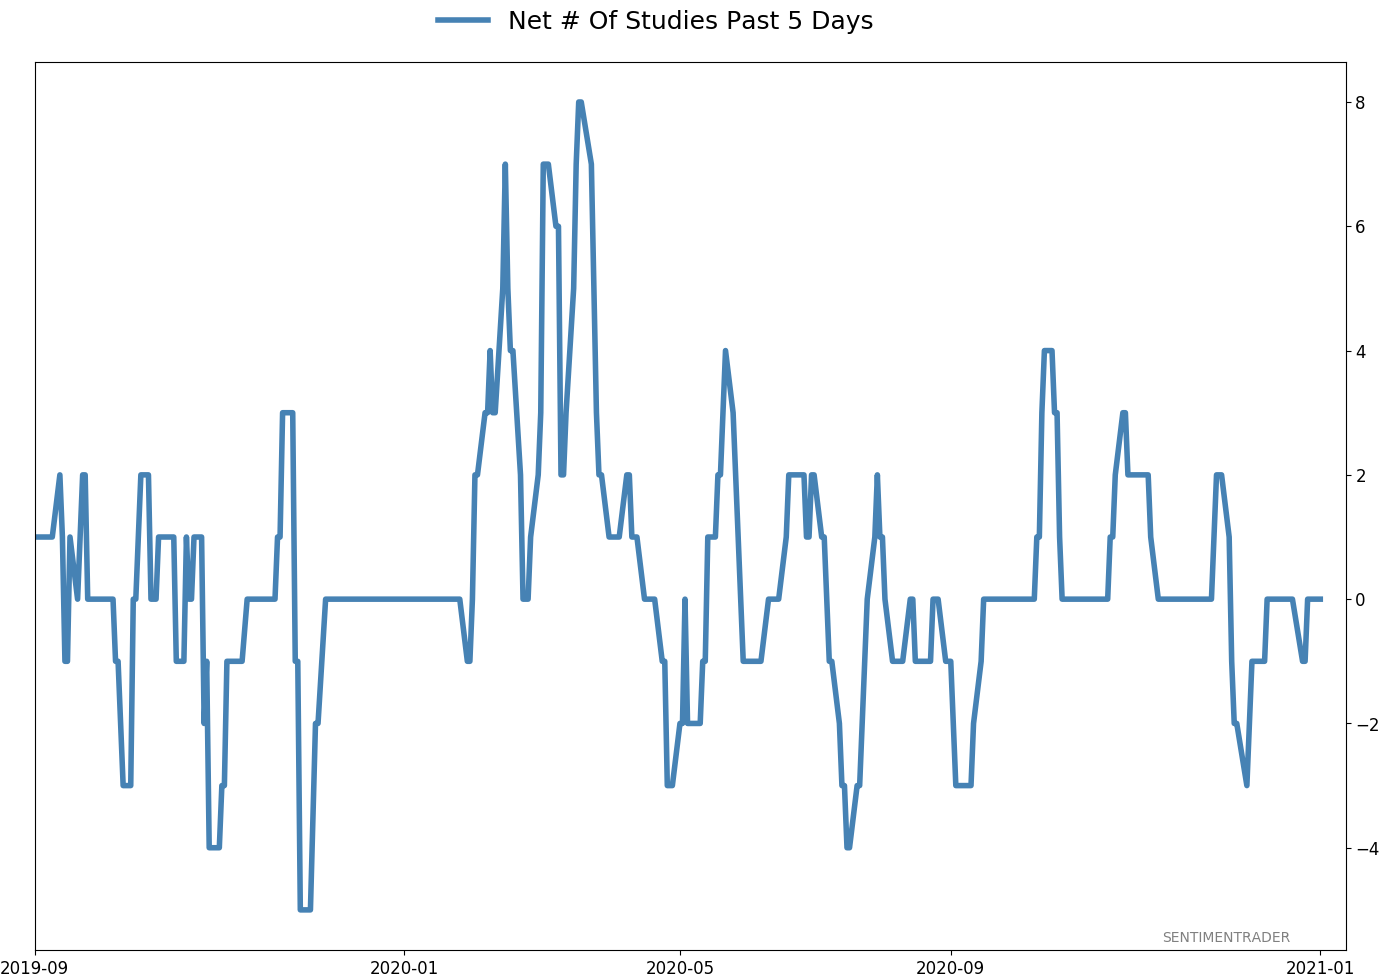
Active Studies
| Time Frame | Bullish | Bearish | | Short-Term | 0 | 0 | | Medium-Term | 2 | 3 | | Long-Term | 15 | 2 |
|
Indicators at Extremes
Portfolio
| Position | Description | Weight % | Added / Reduced | Date | | Stocks | 8.7% RSP | 8.7 | Reduced 28.8% | 2021-01-26 | | Bonds | 9.5% ANGL, 9.1% SCHP, 9.0% BND | 27.6 | Reduced 0.2% | 2021-01-26 | | Commodities | GCC | 2.3 | Reduced 2.1%
| 2020-09-04 | | Precious Metals | GDX | 8.9 | Added 4.8% | 2020-12-01 | | Special Situations | 10.3% XLE, 8.9% PSCE | 19.2 | Added 19.2% | 2021-01-26 | | Cash | | 33.4 | | |
|
Updates (Changes made today are underlined)
With a market that has seen the kinds of broad participation and big breath thrusts like we did in the fall, it's hard to become too negative. Those kinds of conditions have consistently preceded higher returns over the next 6-12 months. It's the interim that's more of an issue. Even conditions like that haven't prevented some shorter-term pullbacks. And when we combine an environment where speculation is rampant and recent days have seen an increase in cracks under the surface of the indexes, it's enough to become more defensive over a short- to medium-term time frame. We still don't have much confirmation from the price action in the indexes, so those who are more conservative would likely wait before increasing cash levels. In a bid to more closely align the portfolio with what most of our members consider "stocks", we have moved any sector-specific investments to the "special situations" category instead of "stocks." This way, the "stocks" category is essentially the most benchmarked index in the world, the S&P 500. RETURN YTD: 2.1% 2020: 8.1%, 2019: 12.6%, 2018: 0.6%, 2017: 3.8%, 2016: 17.1%, 2015: 9.2%, 2014: 14.5%, 2013: 2.2%, 2012: 10.8%, 2011: 16.5%, 2010: 15.3%, 2009: 23.9%, 2008: 16.2%, 2007: 7.8%
|
|
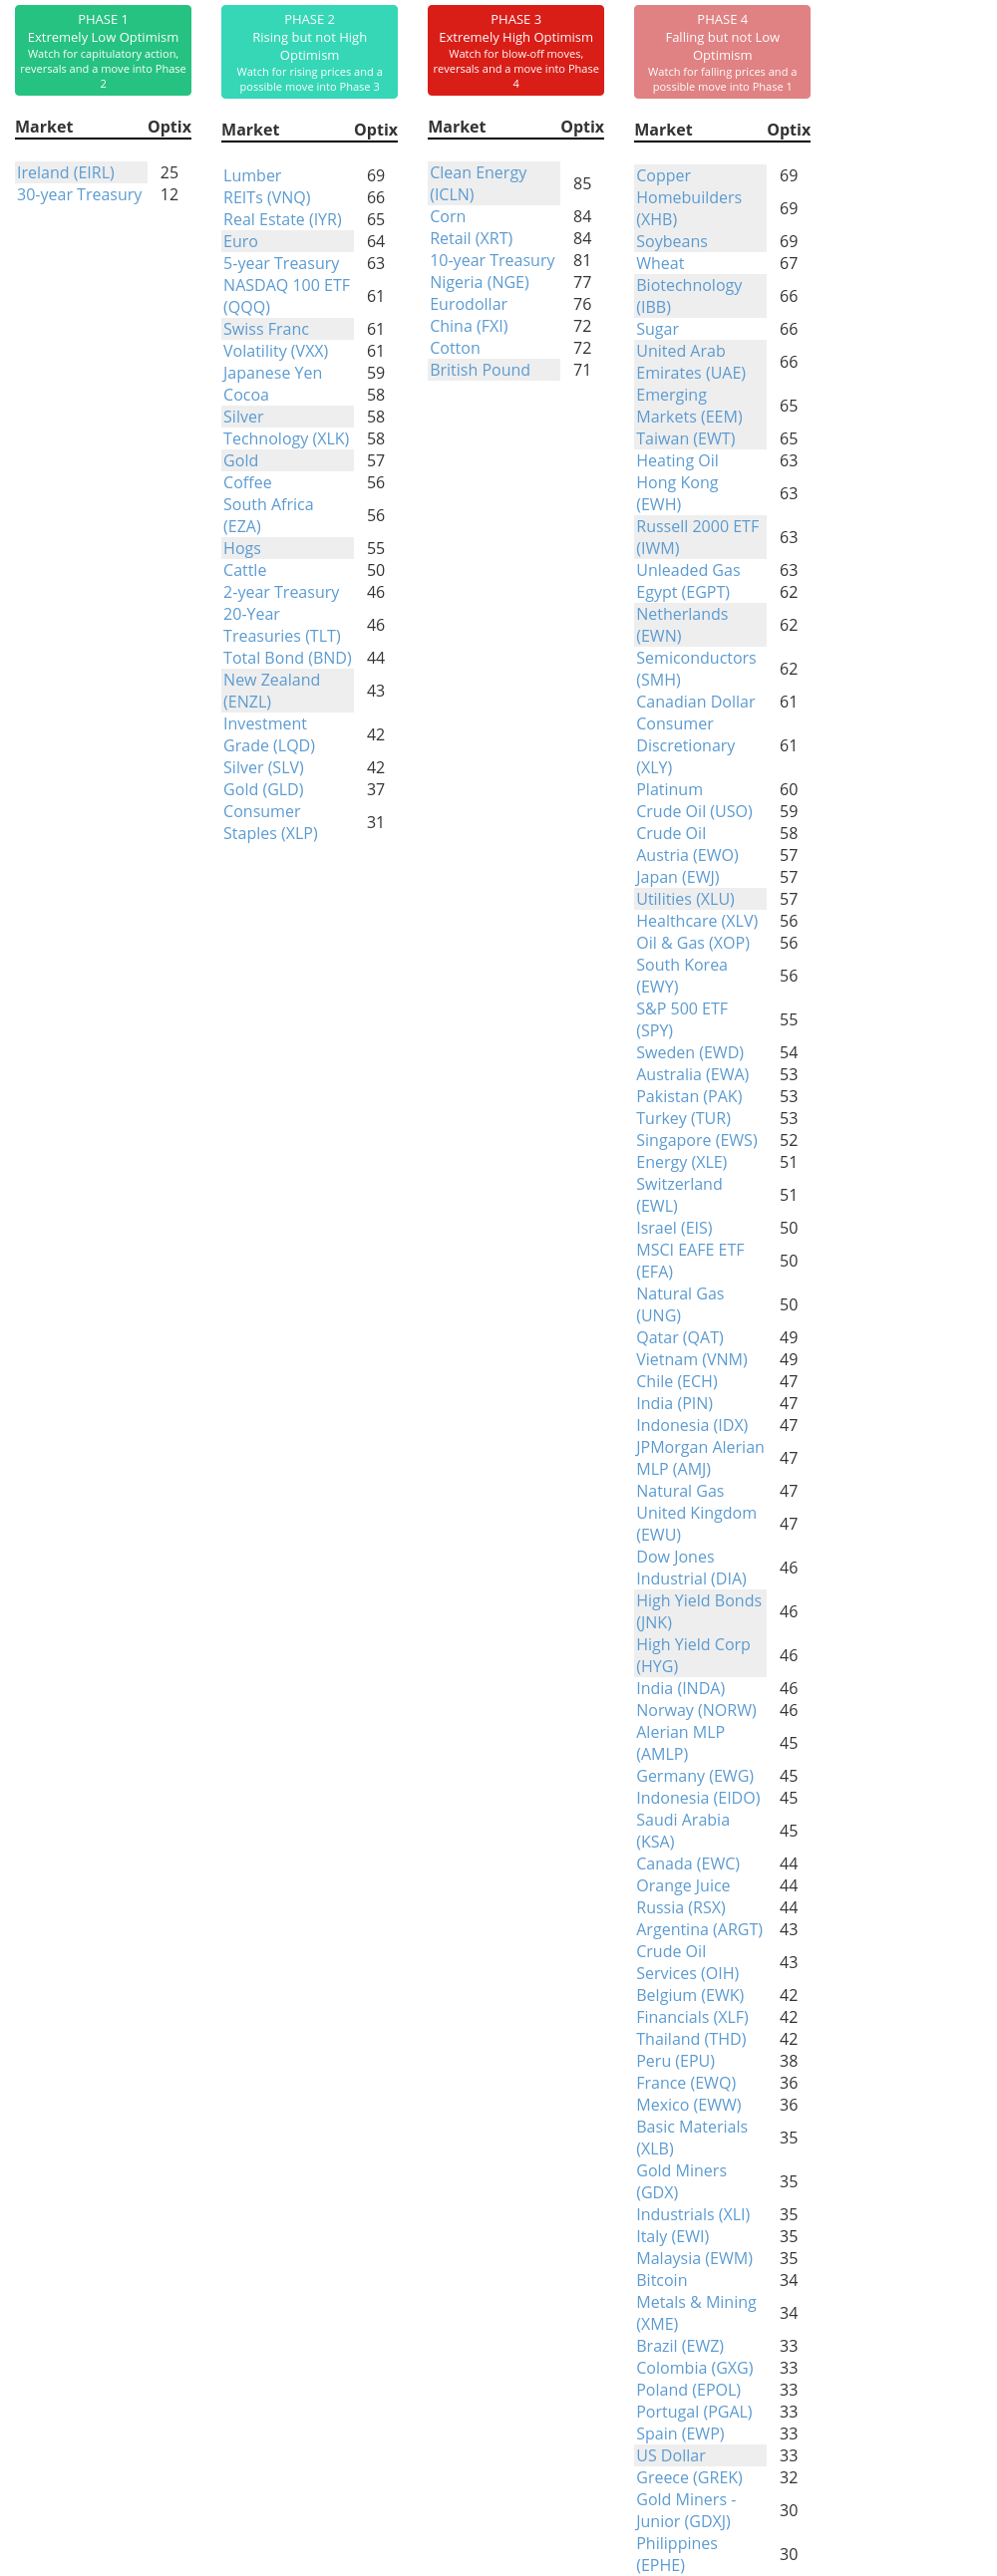
Phase Table
Ranks
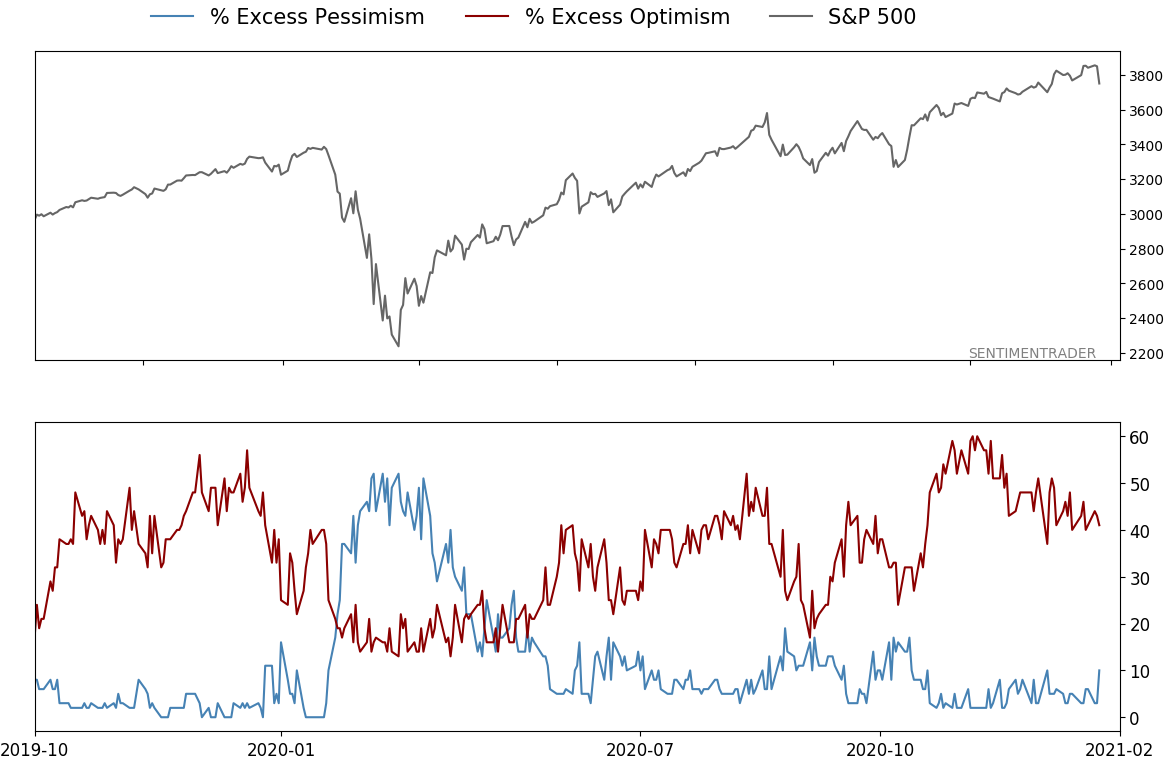
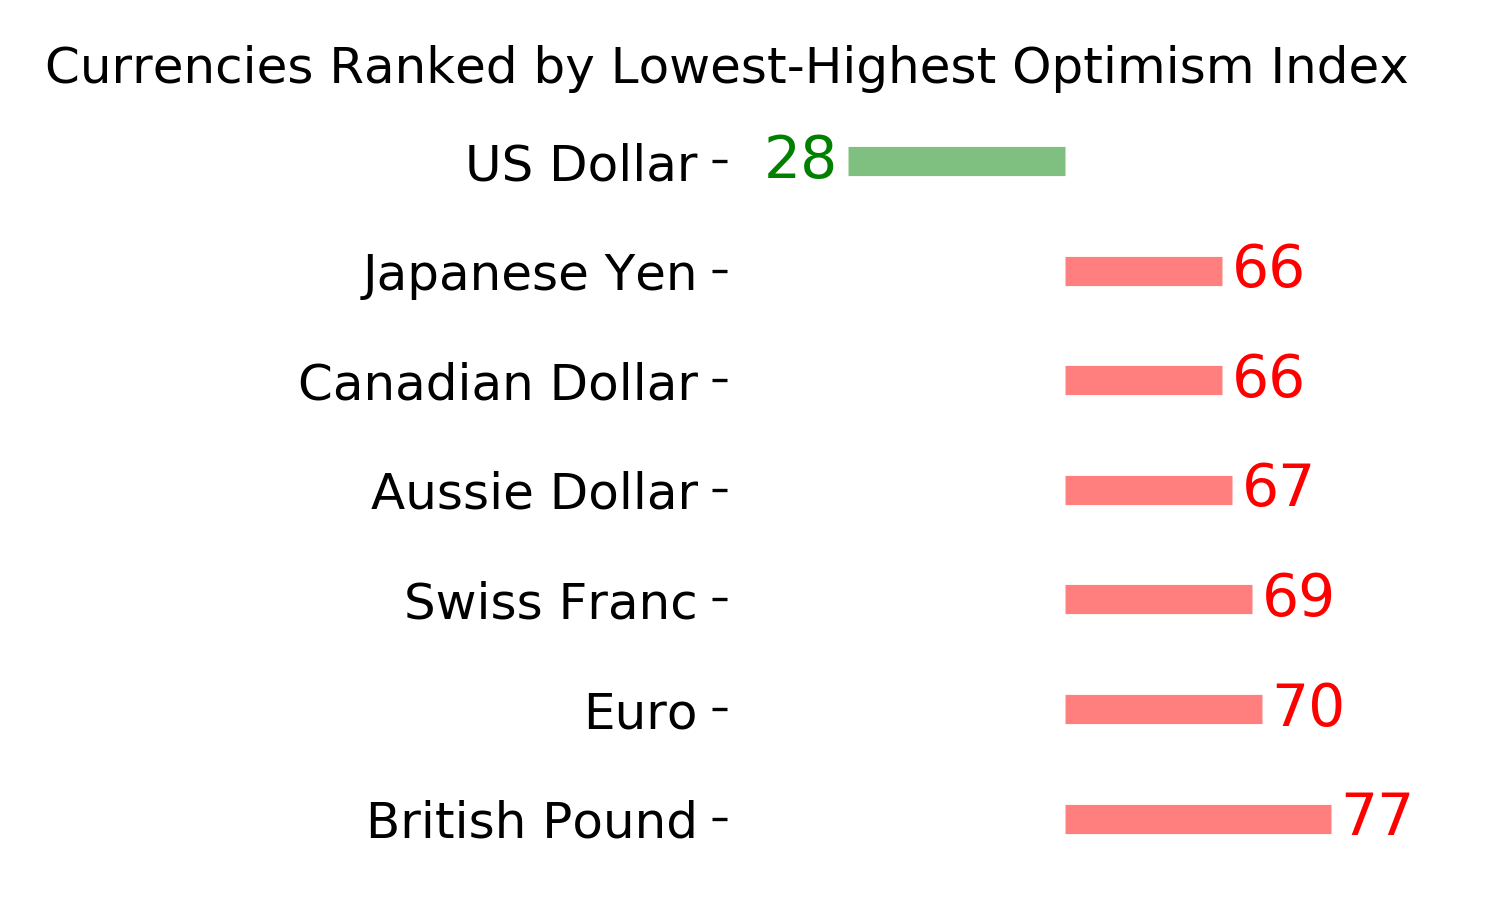
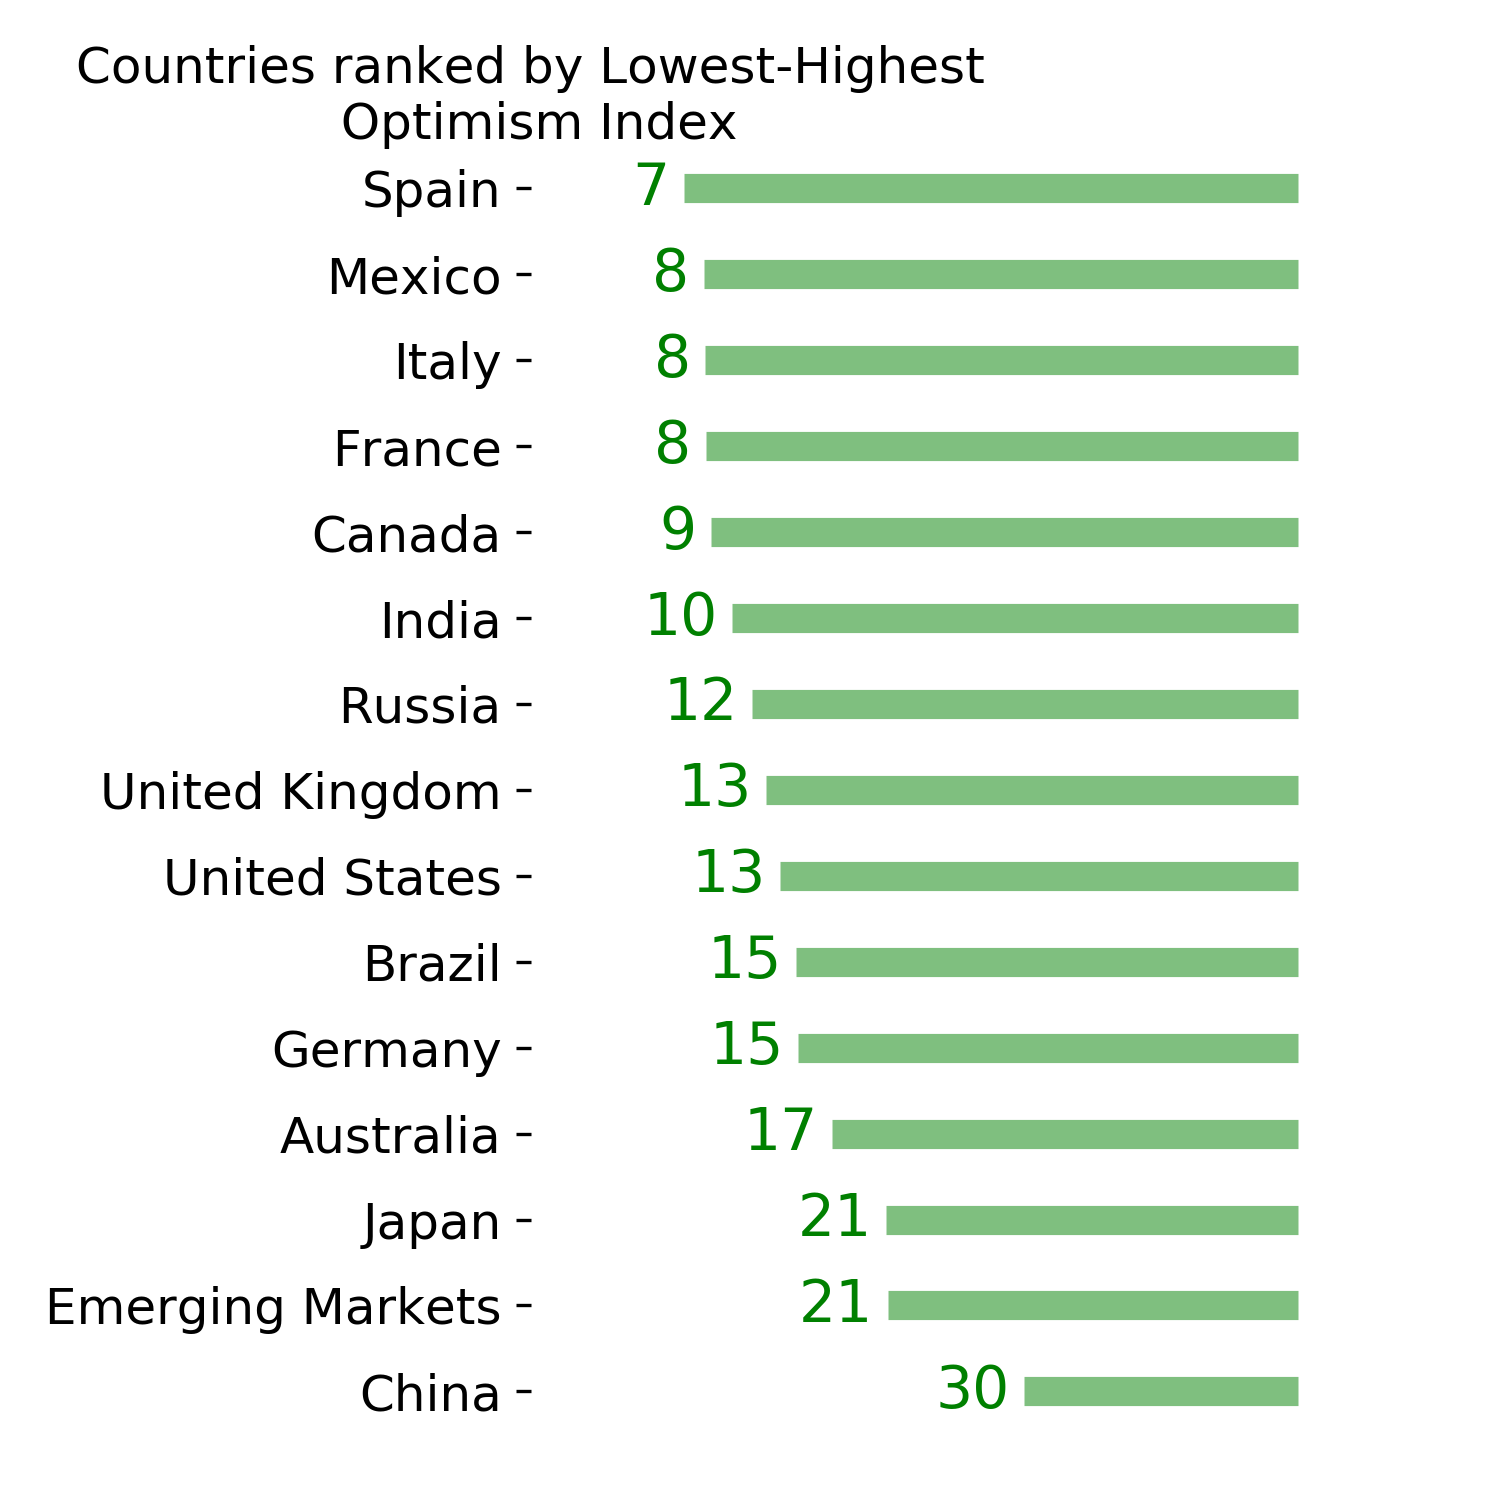
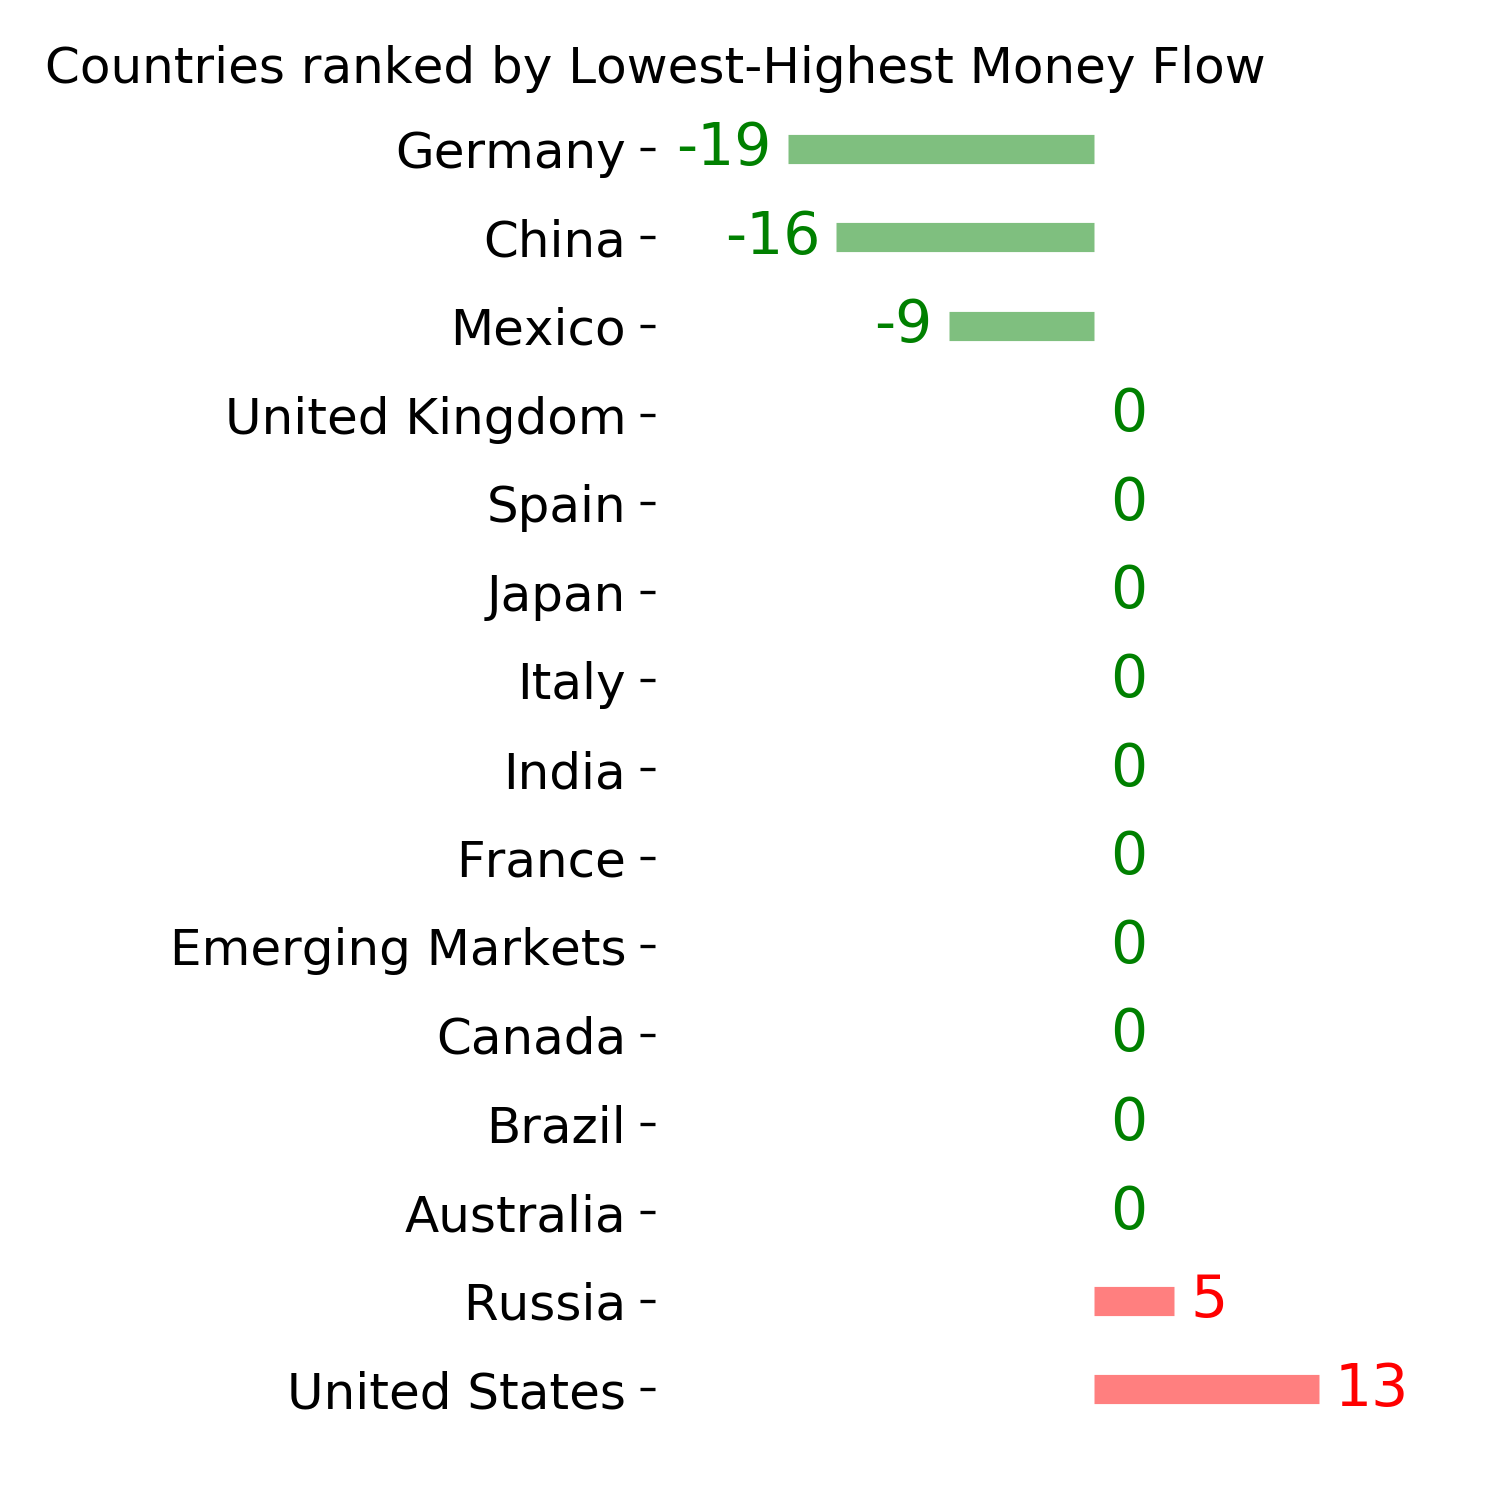
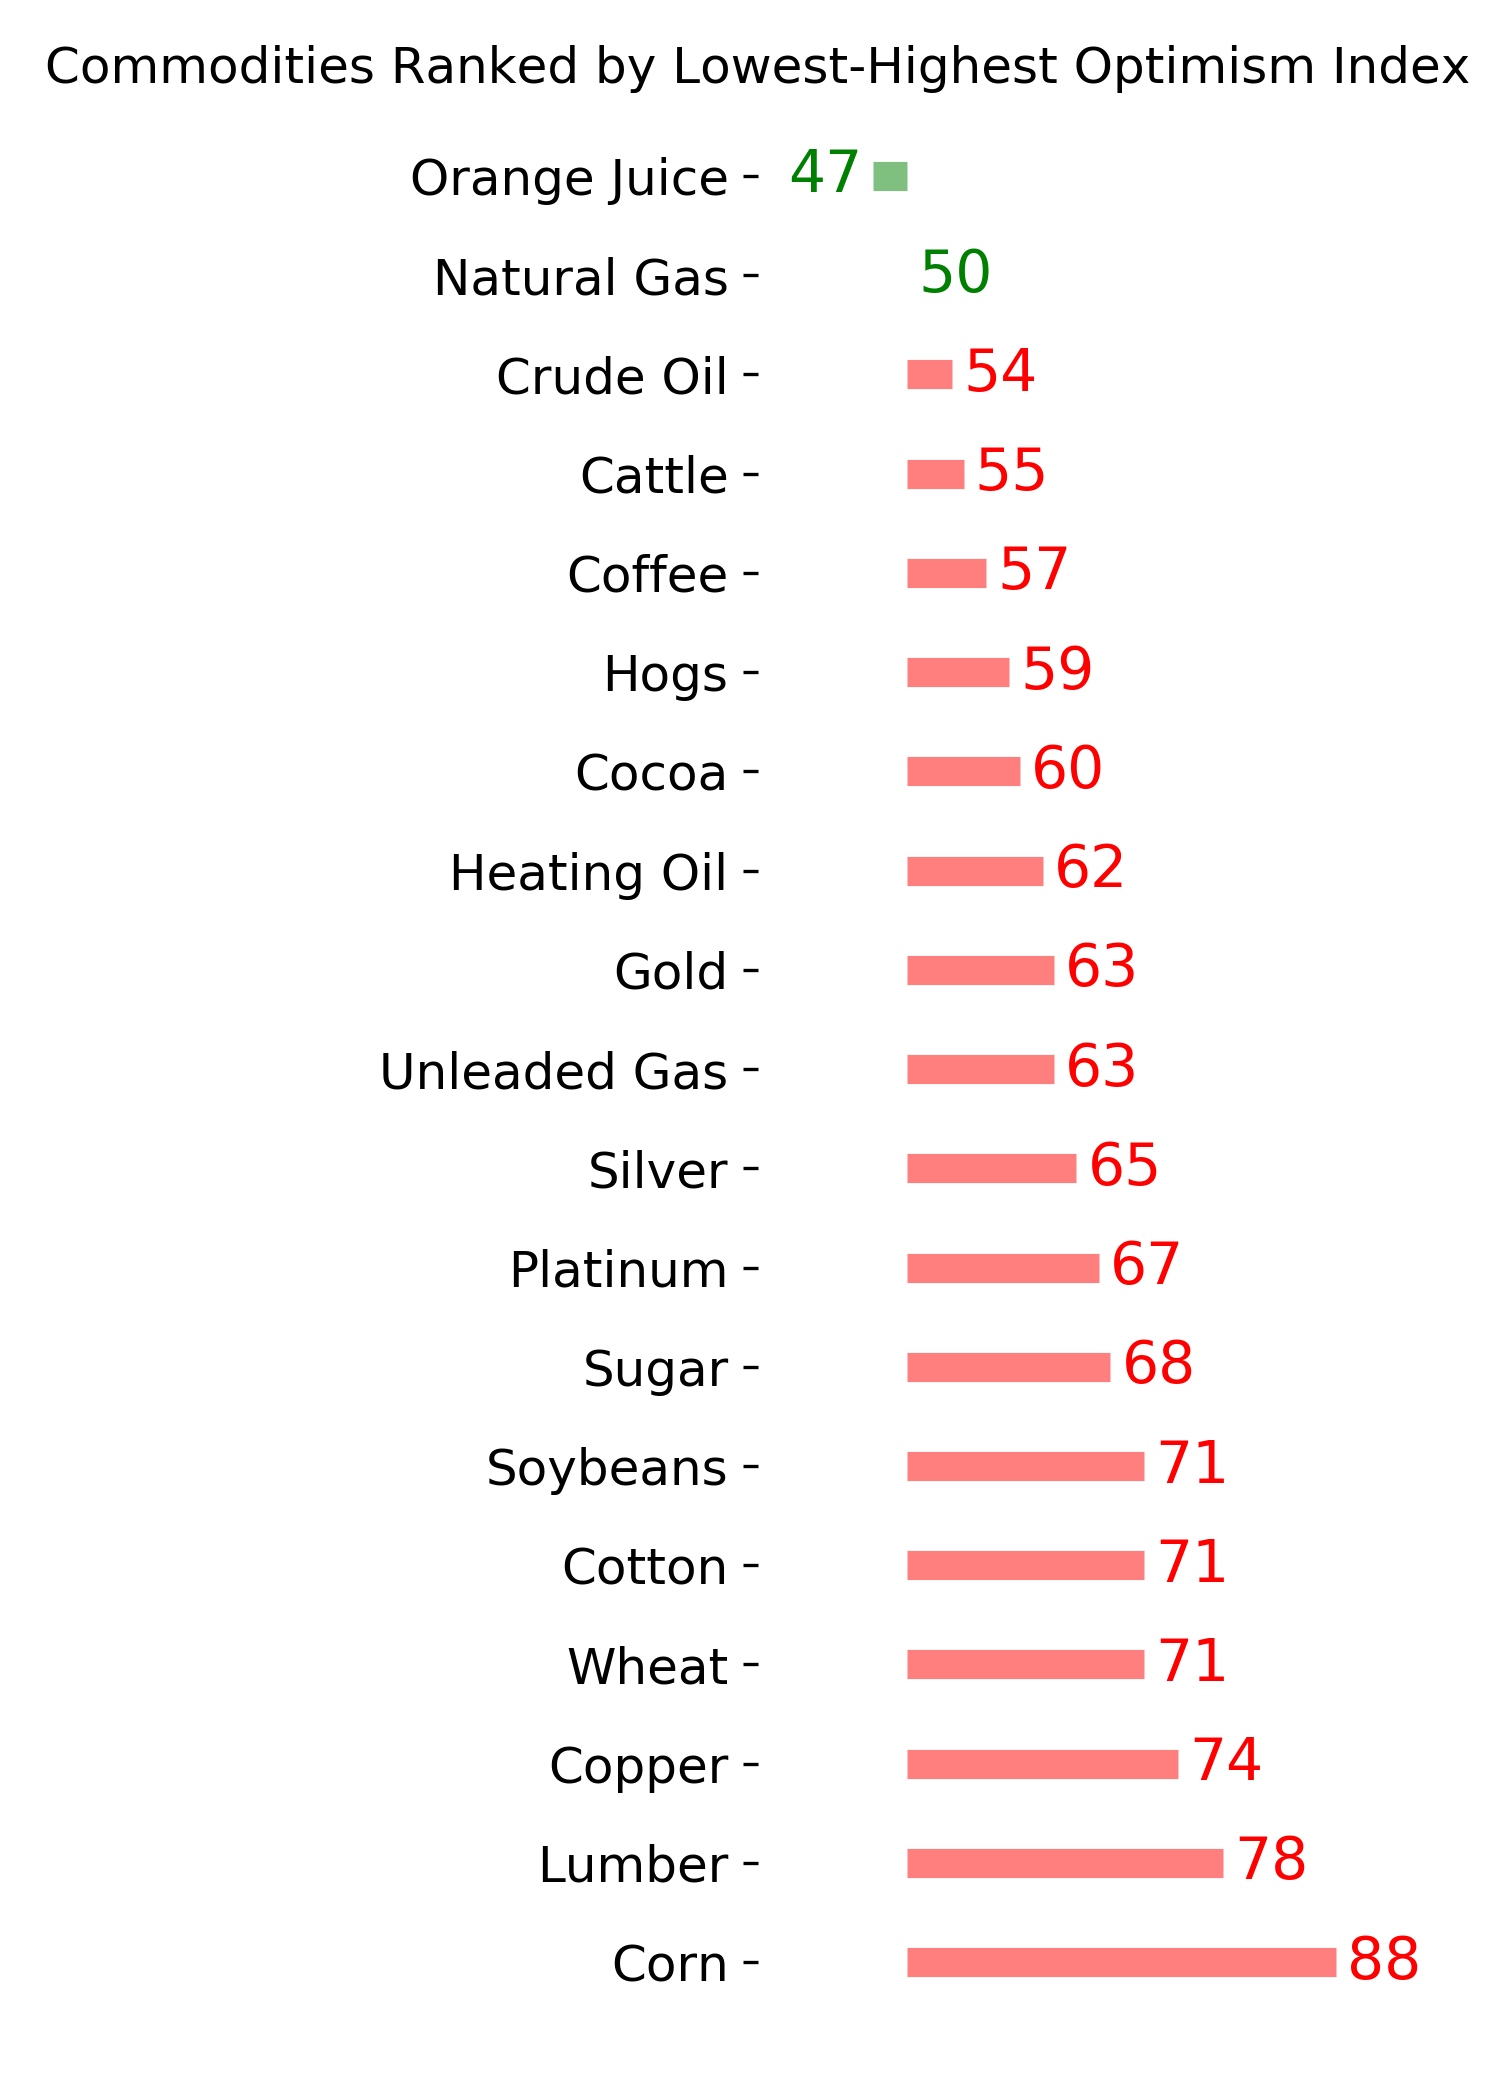
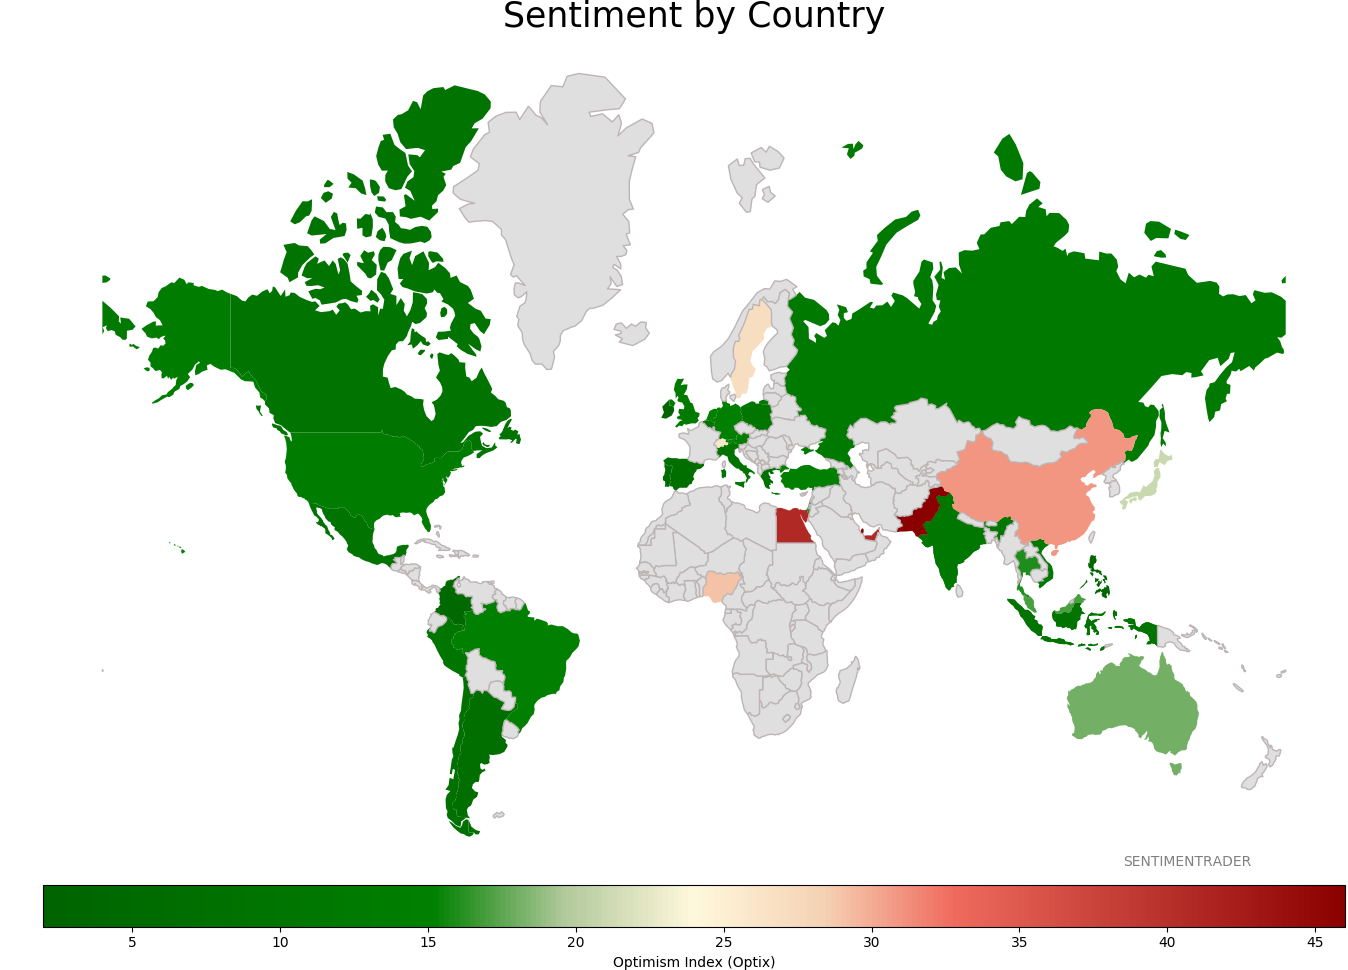
Sentiment Around The World
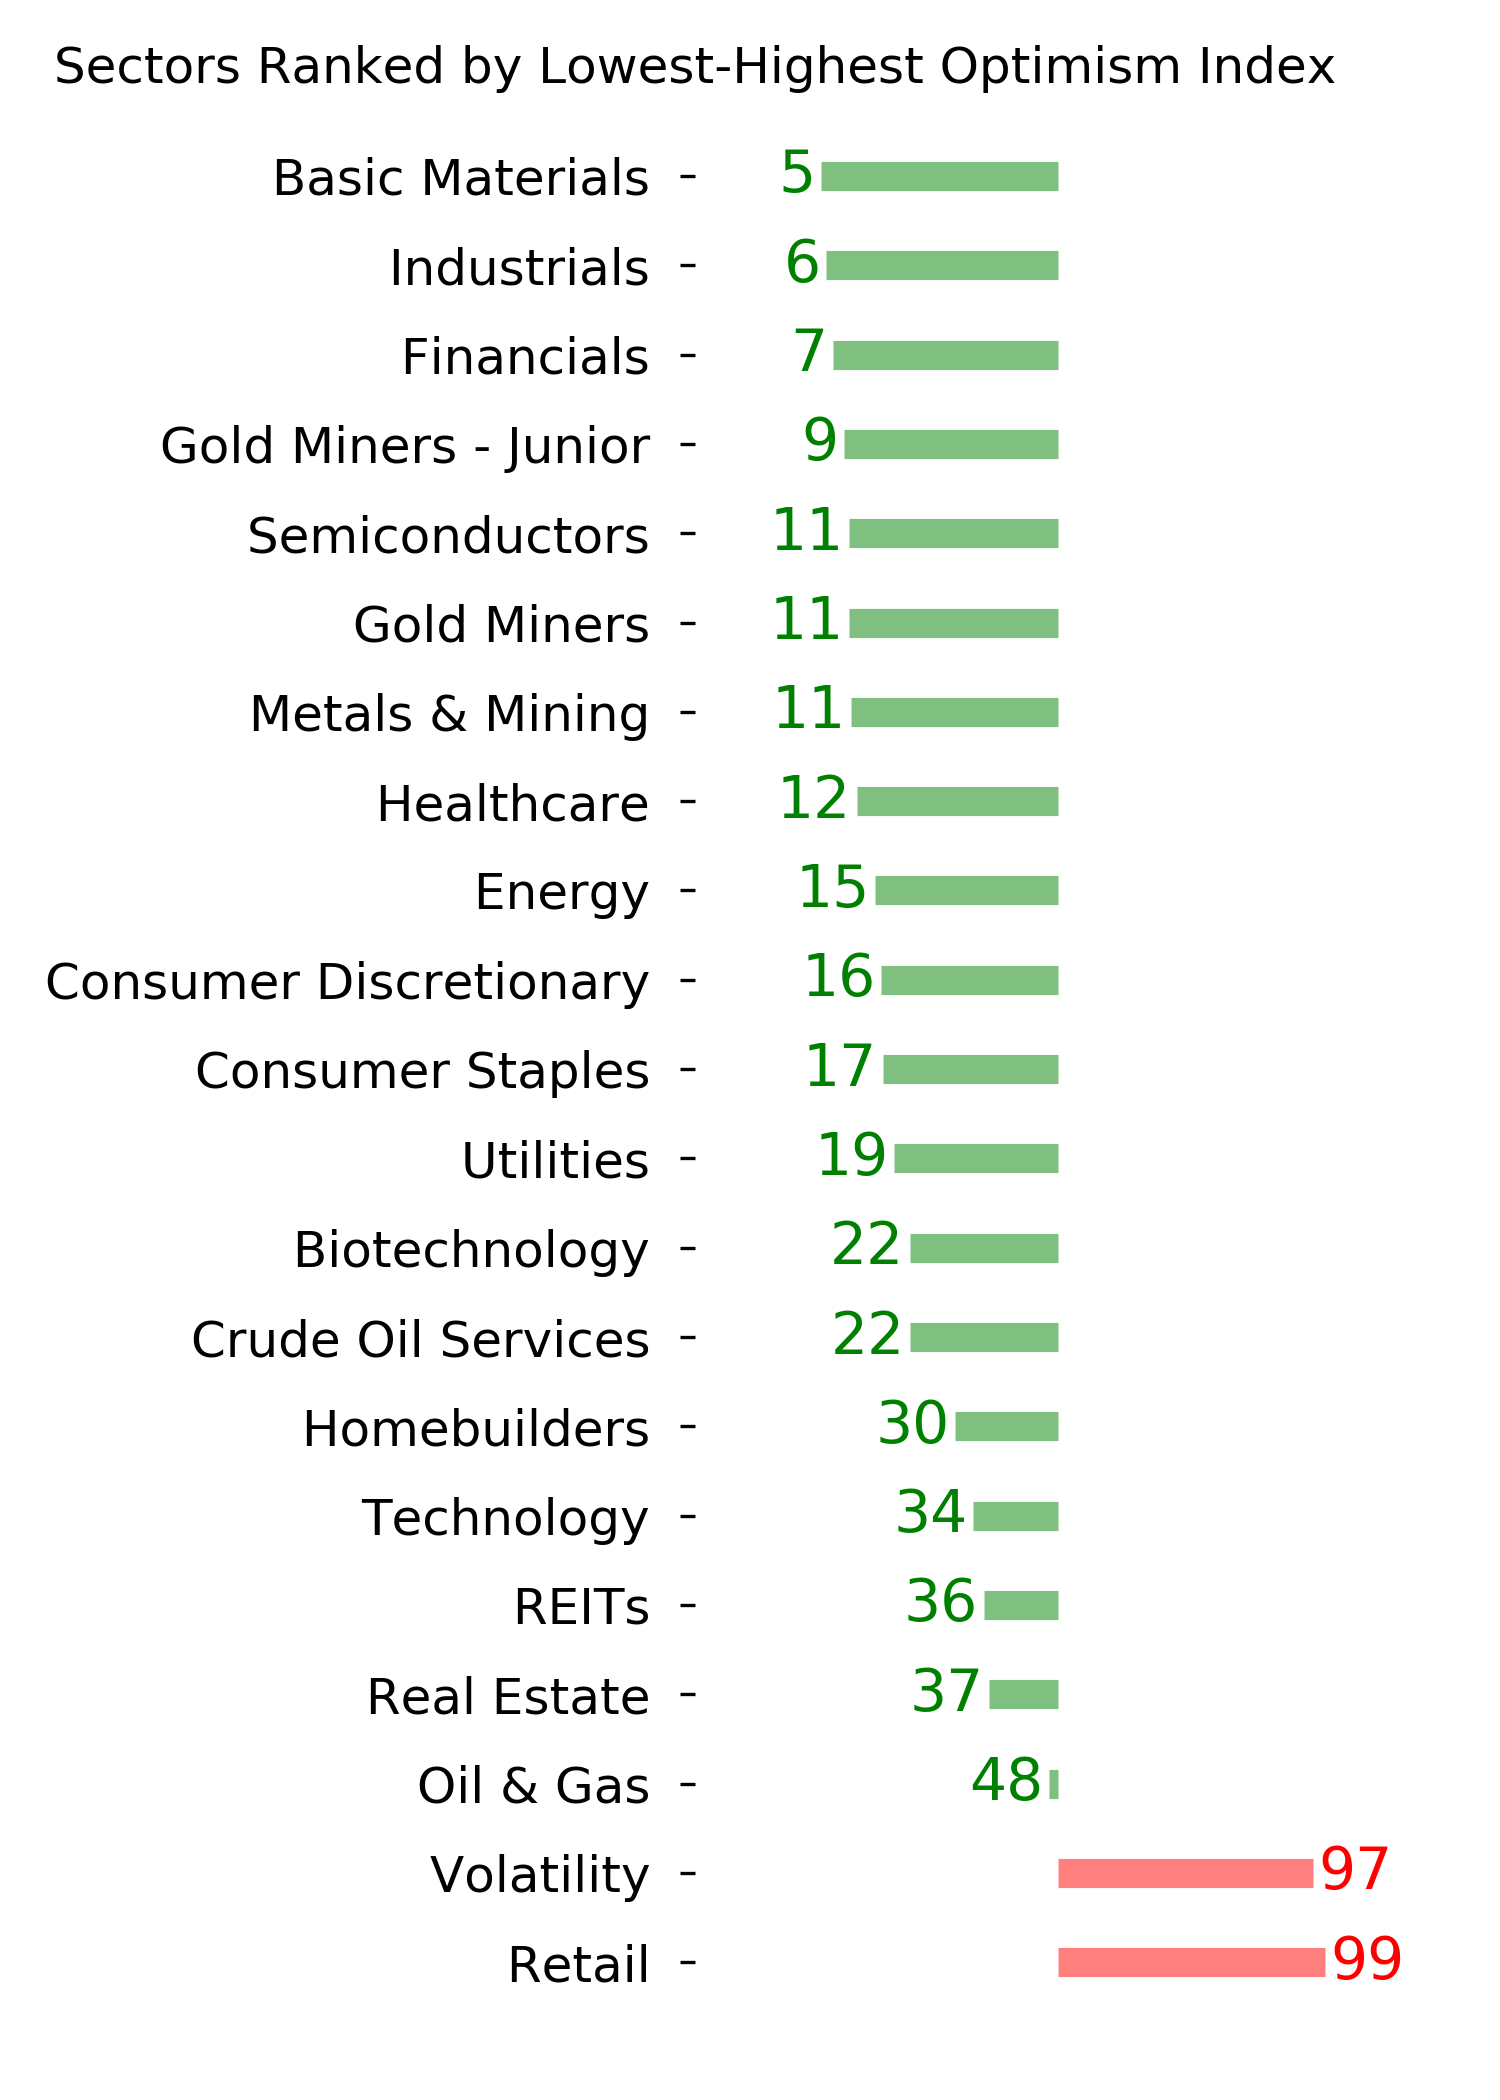
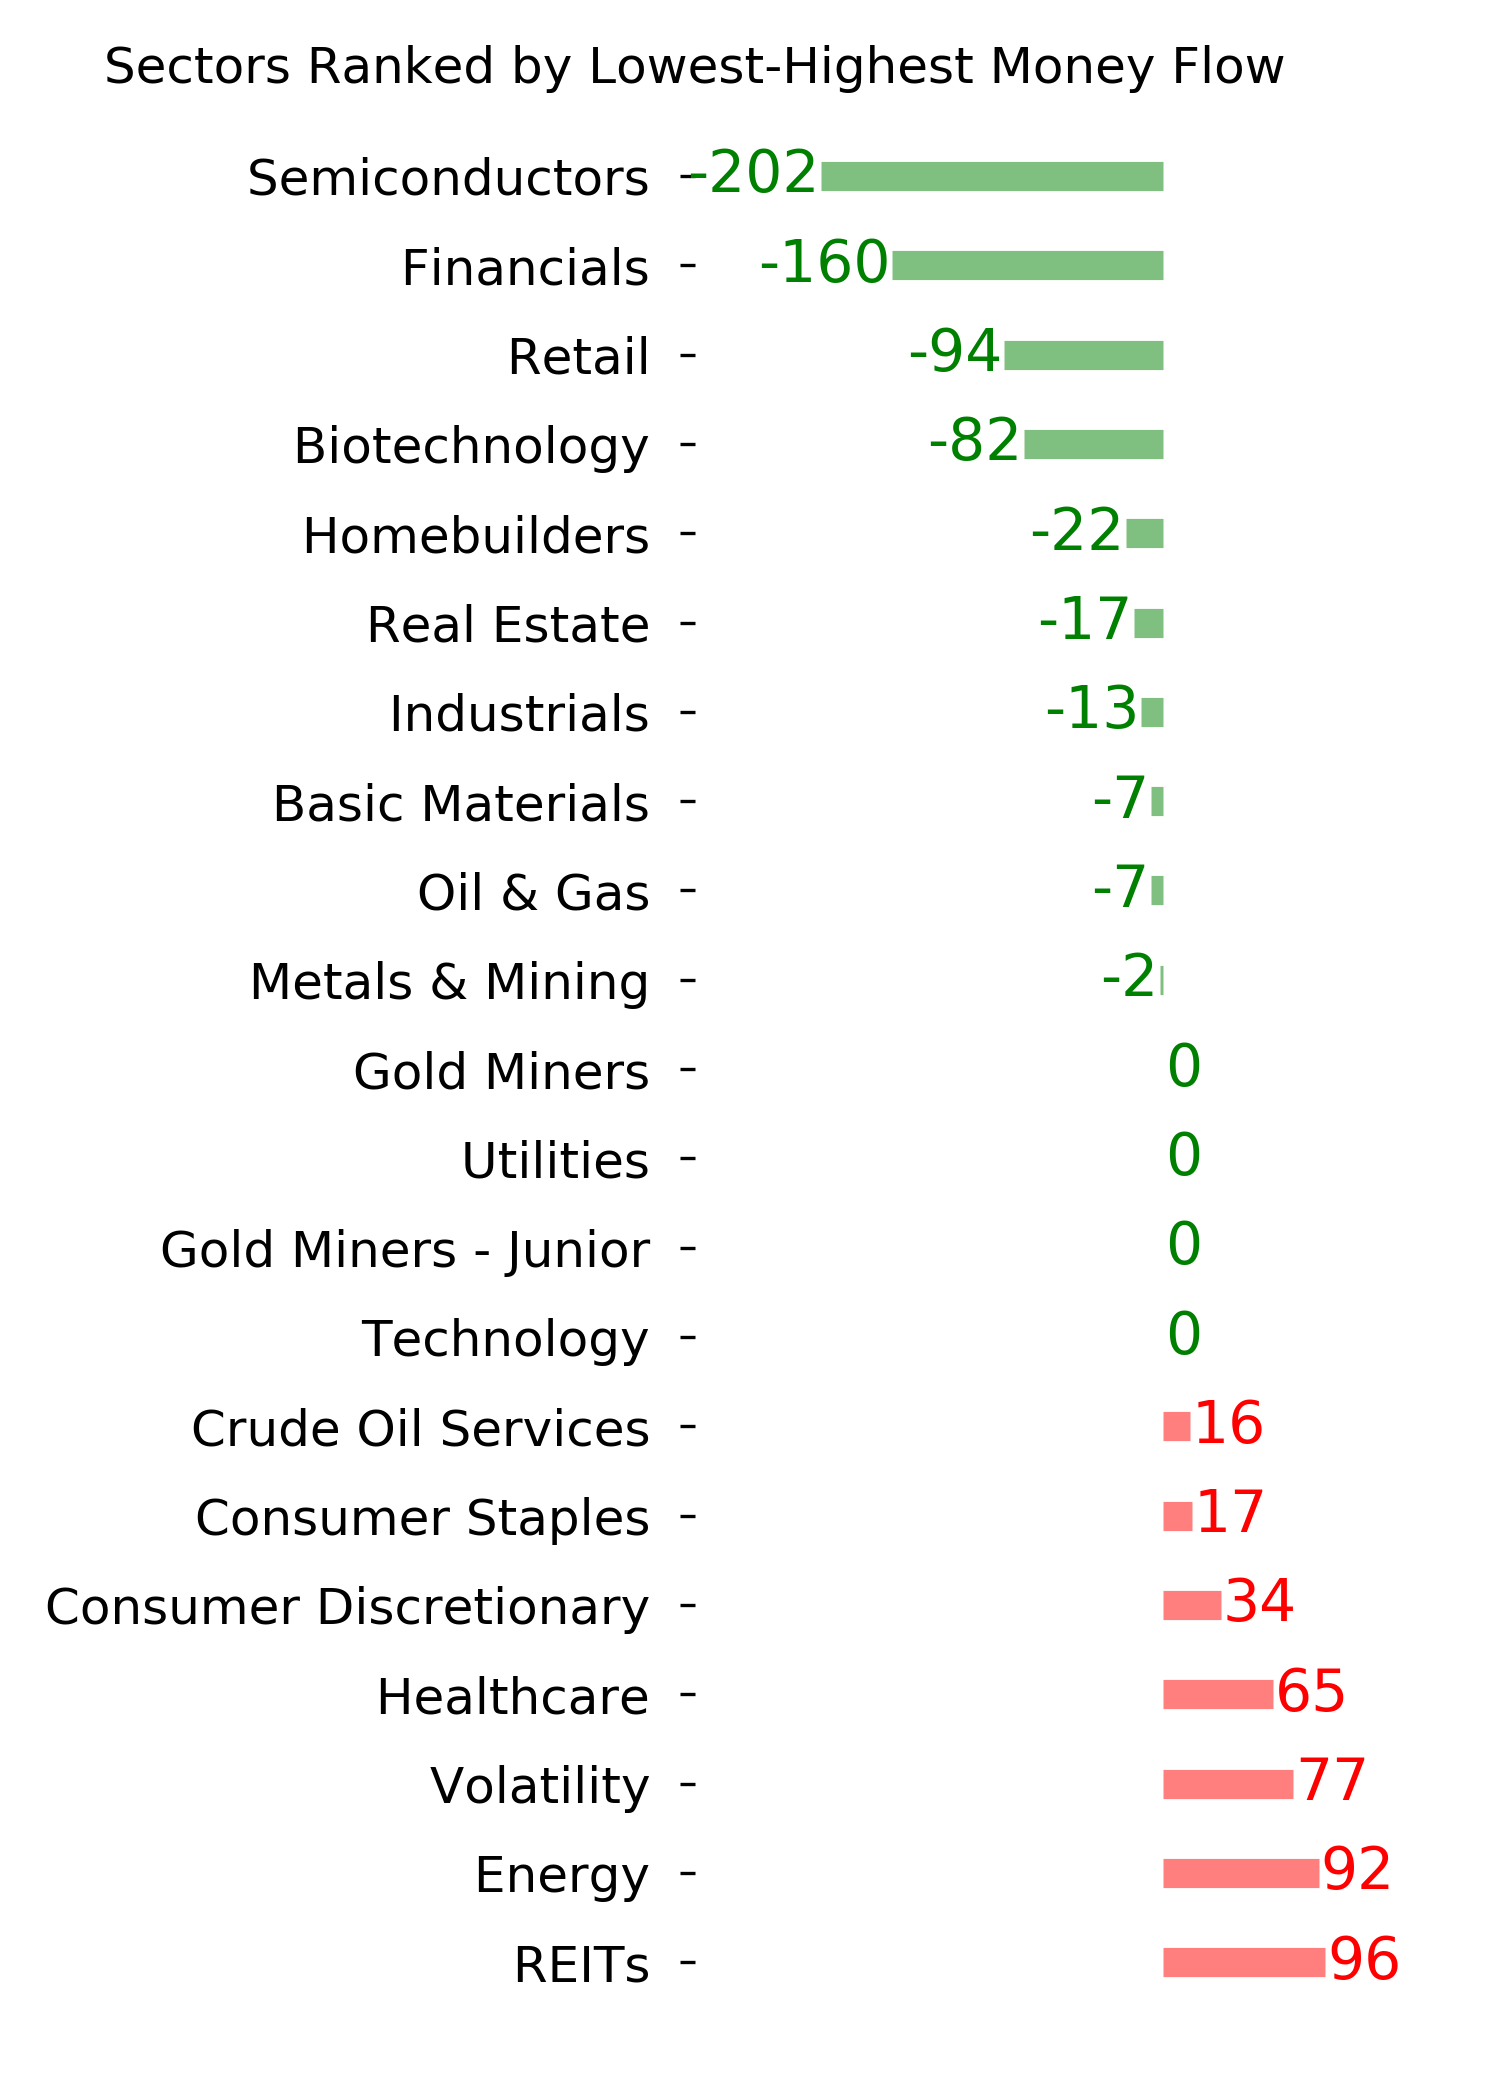
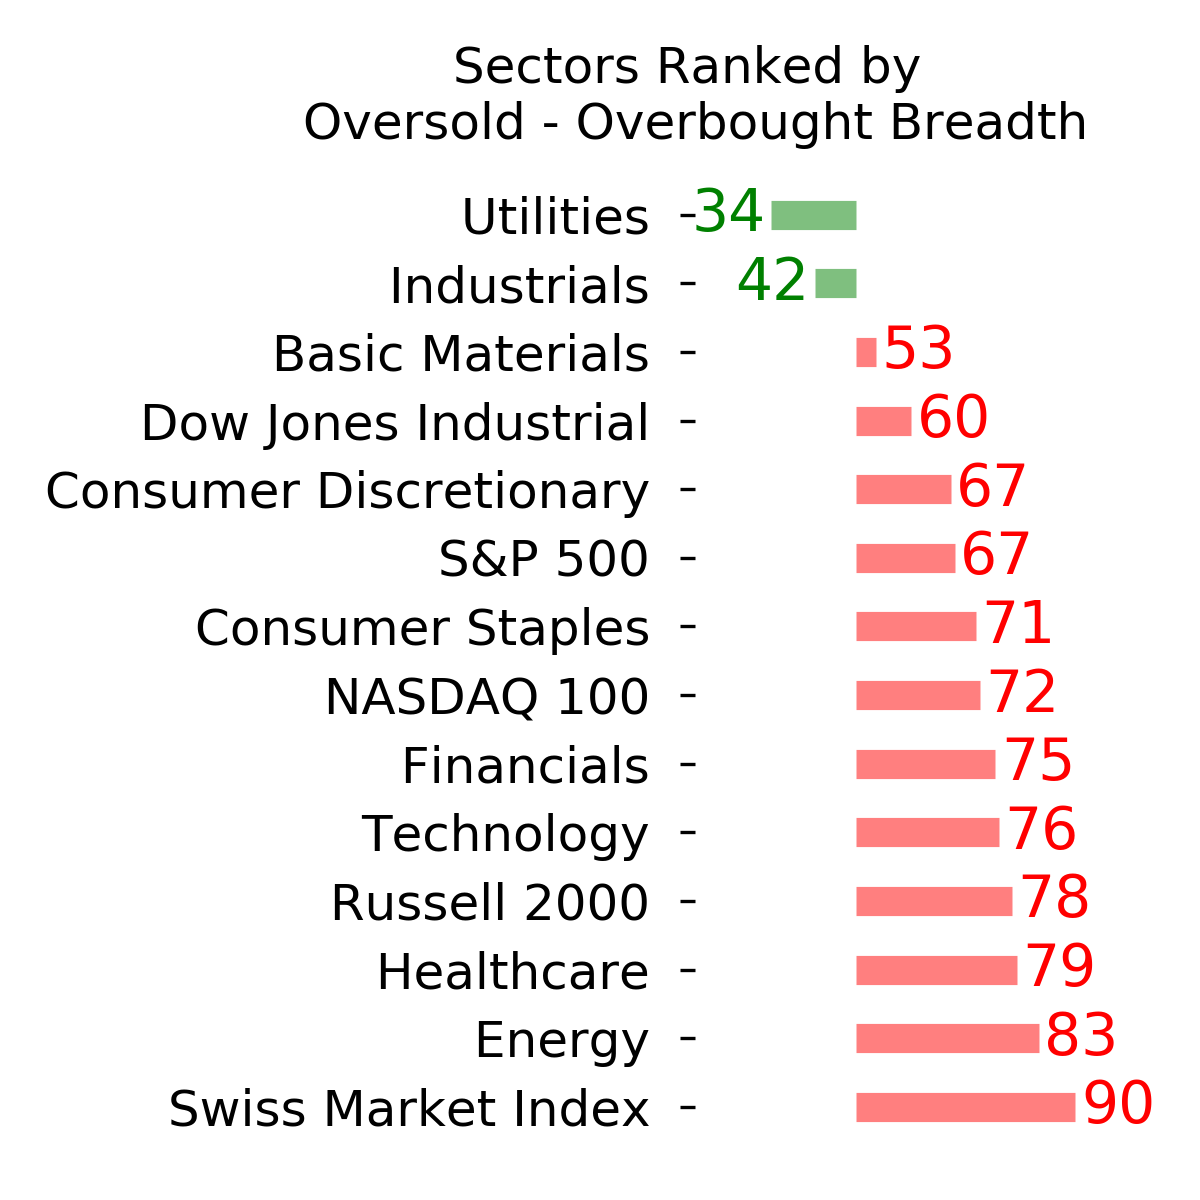
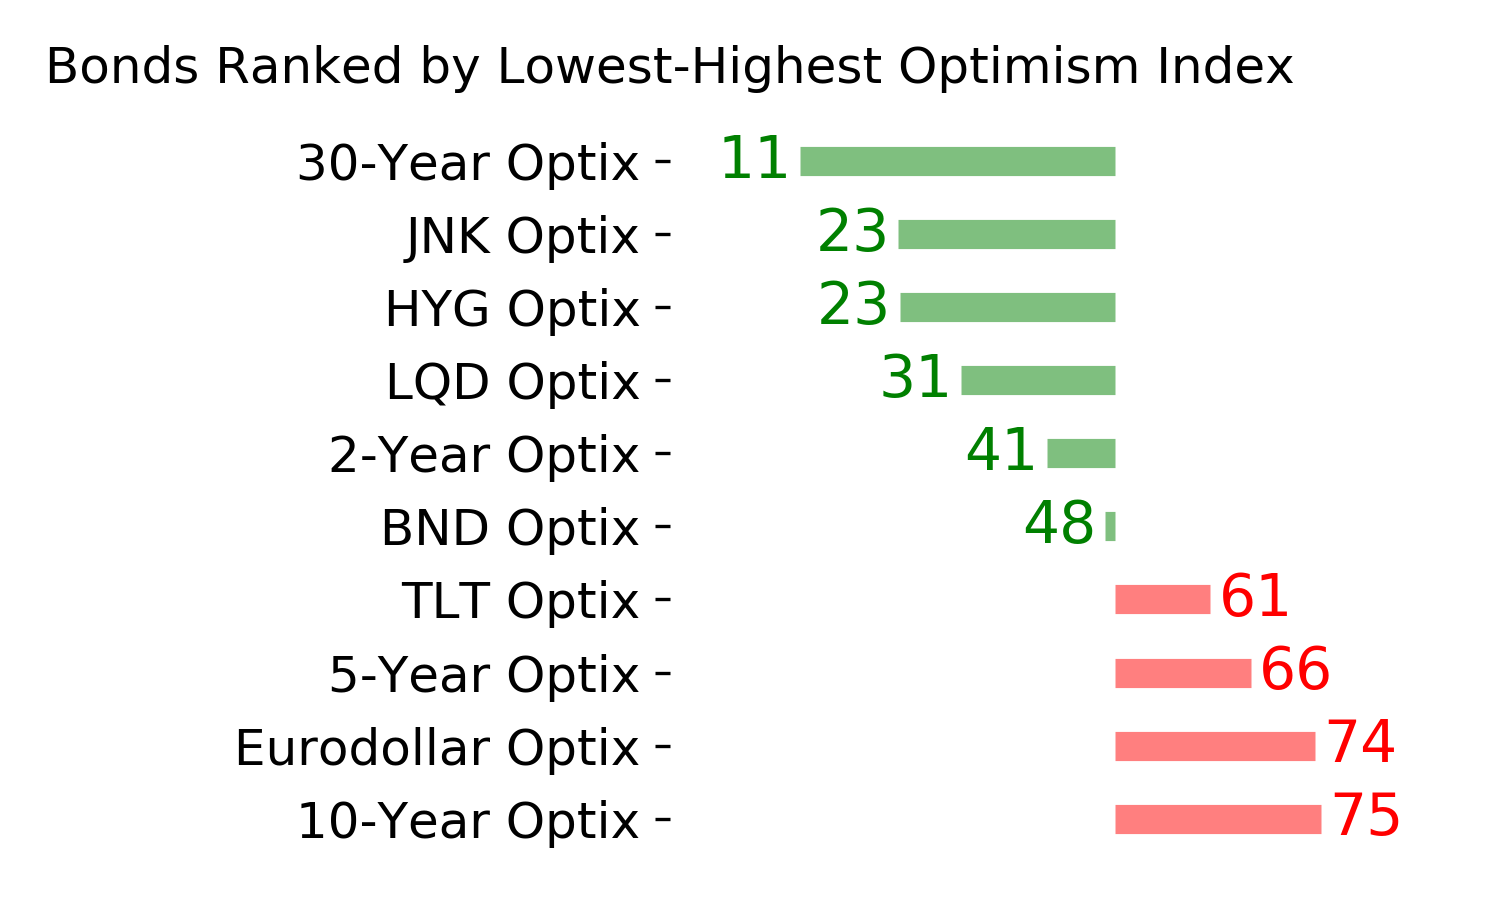
Optimism Index Thumbnails
|
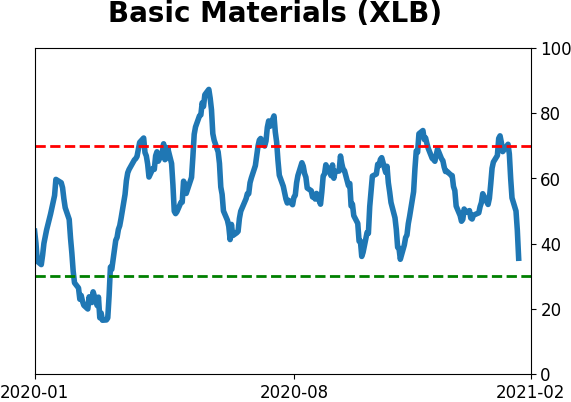
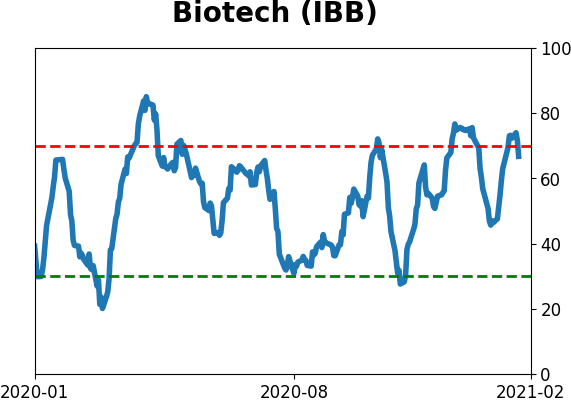
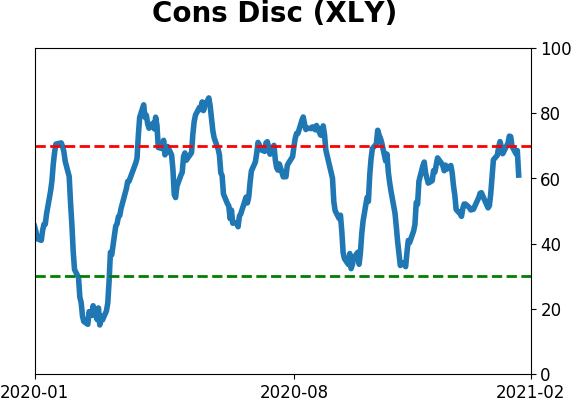
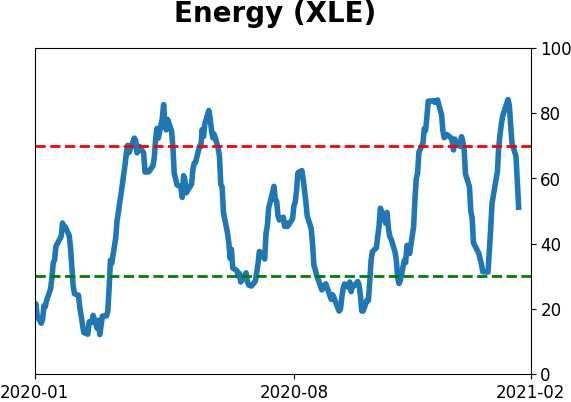
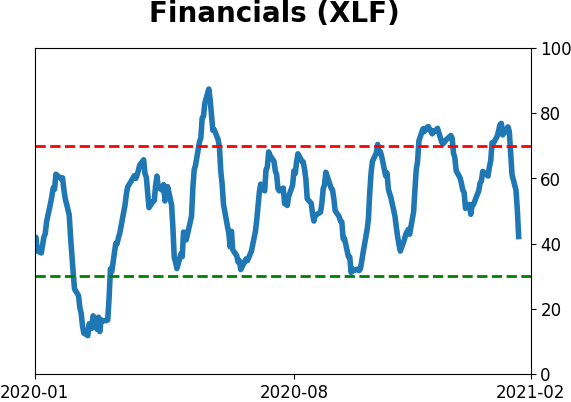
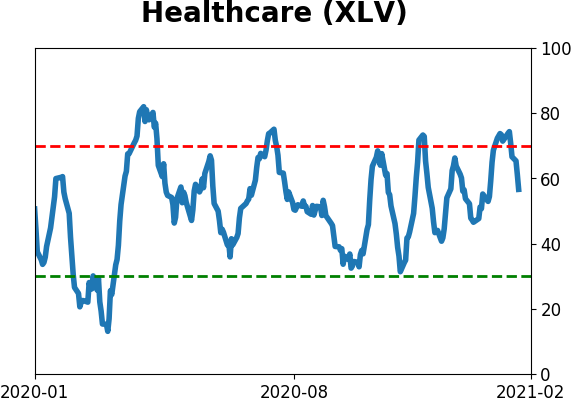
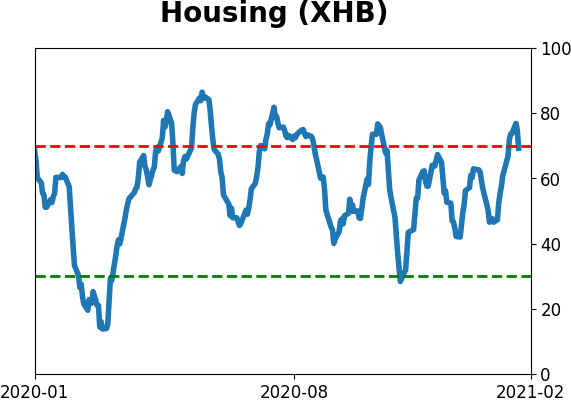
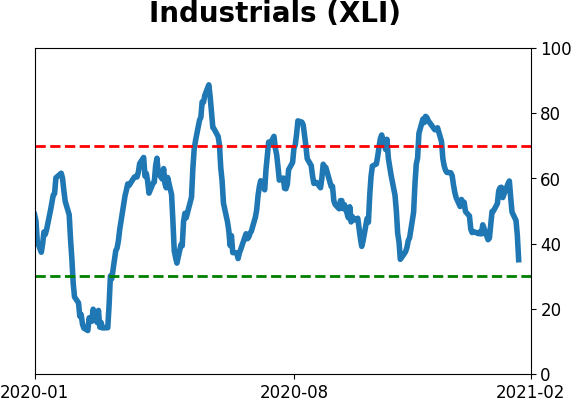
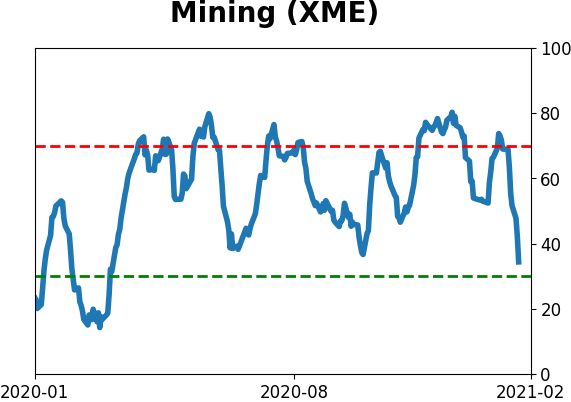
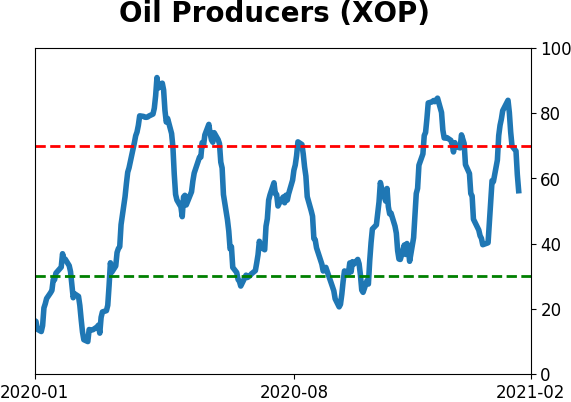
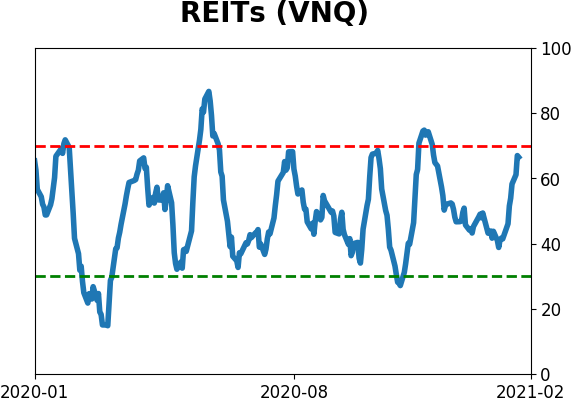
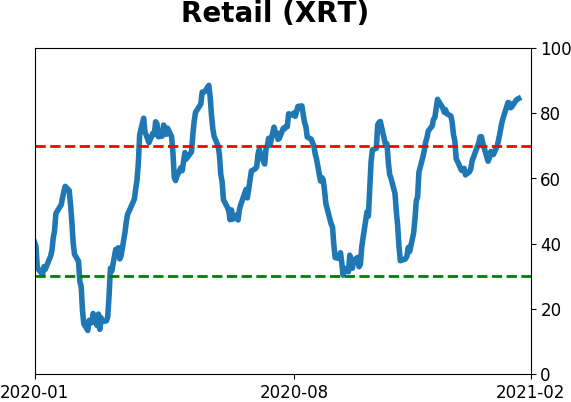
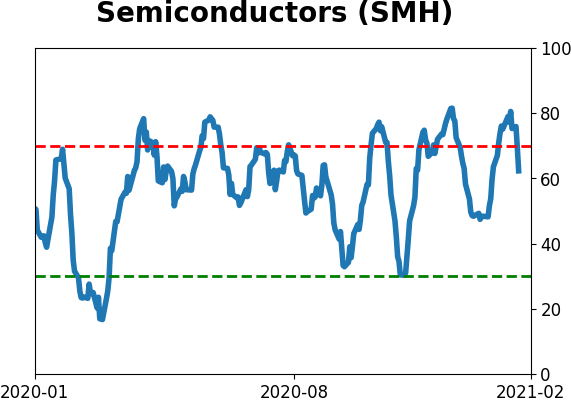
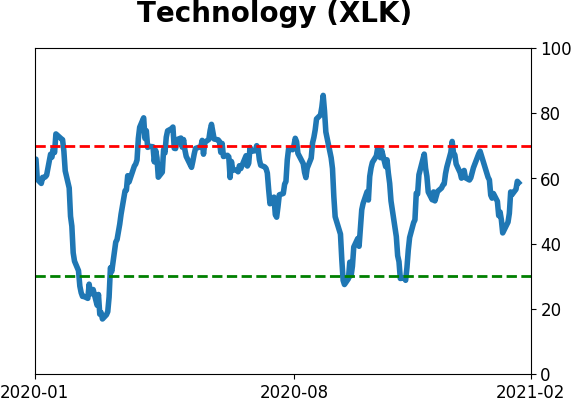
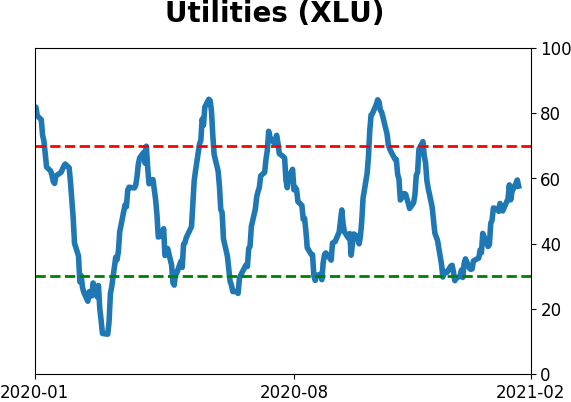
Sector ETF's - 10-Day Moving Average
|
|
|
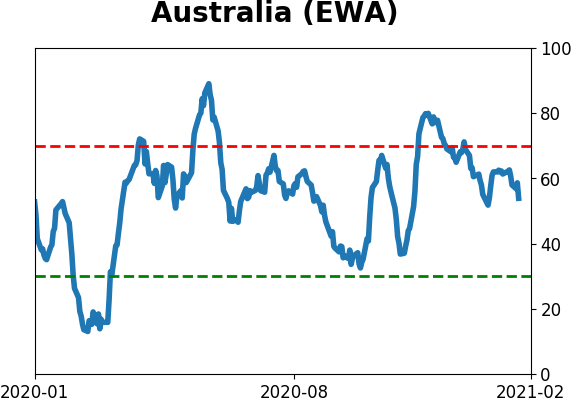
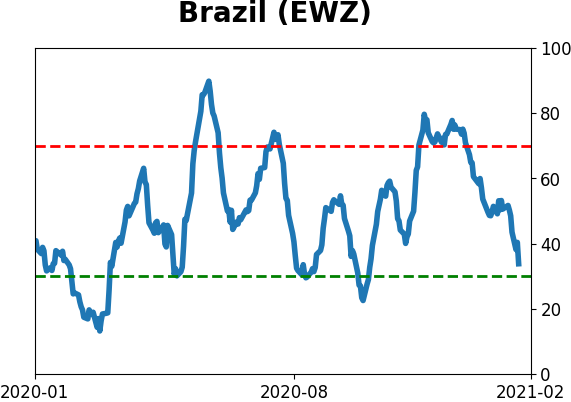
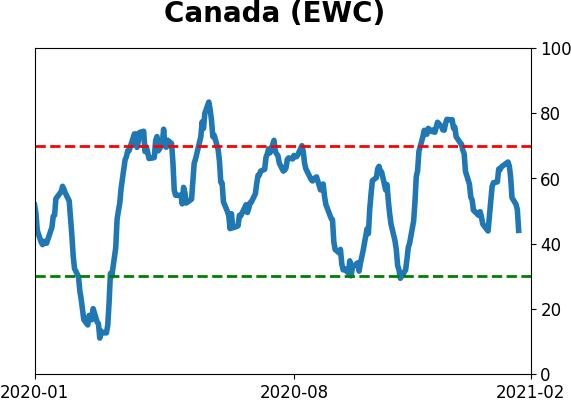
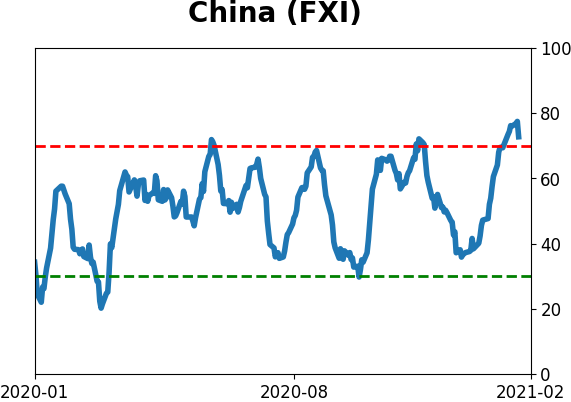
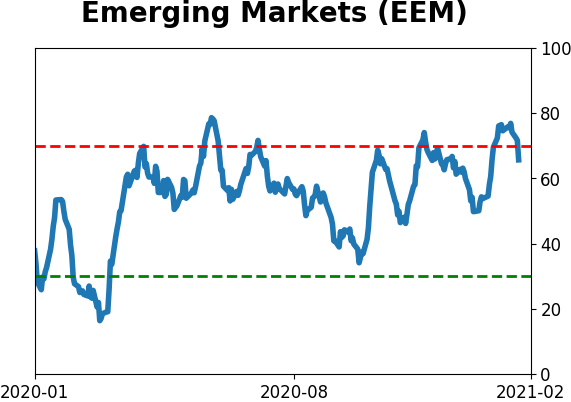
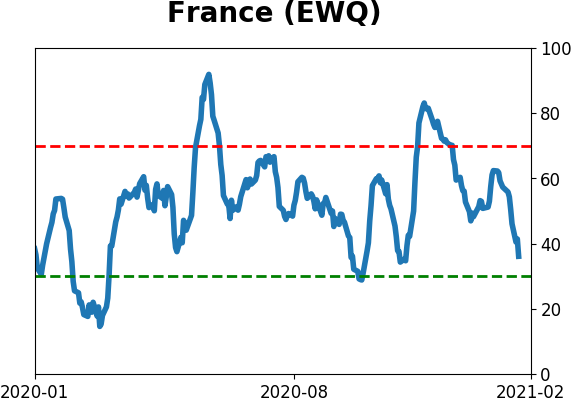
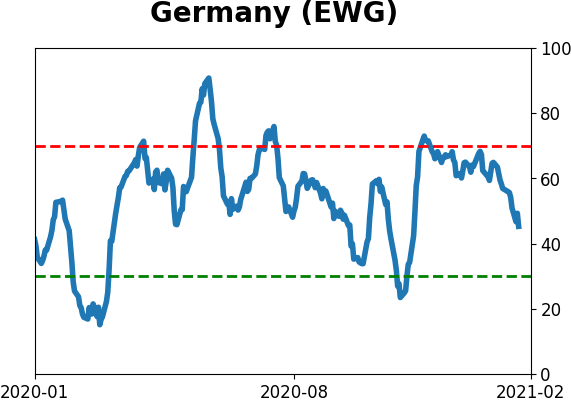
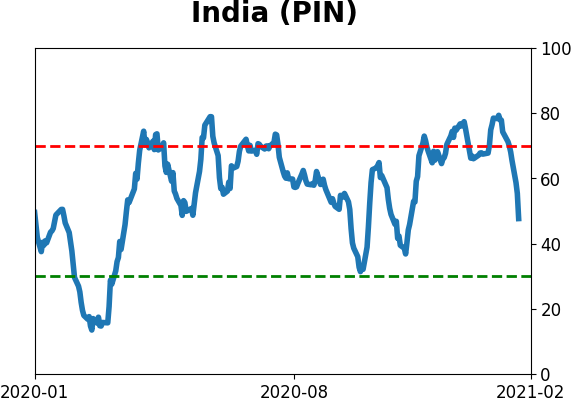
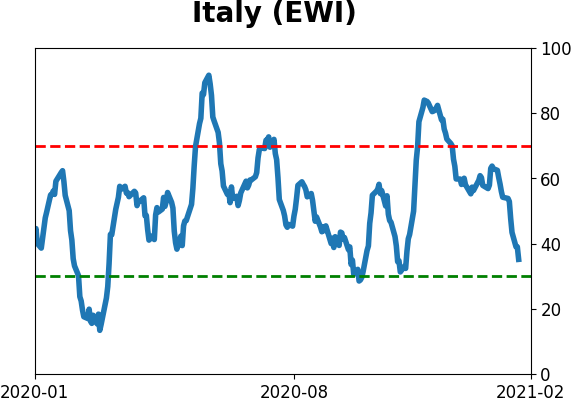
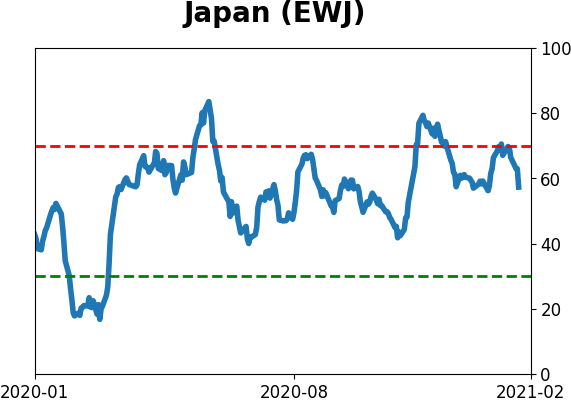
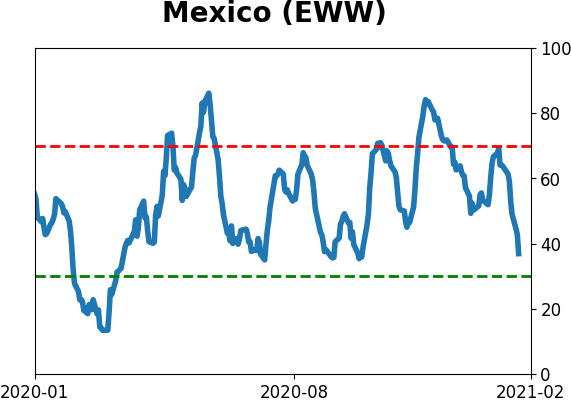
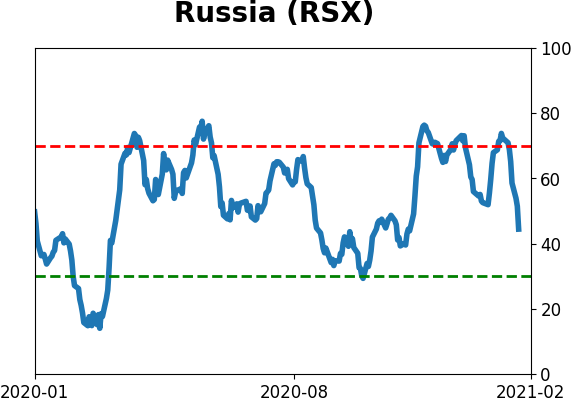
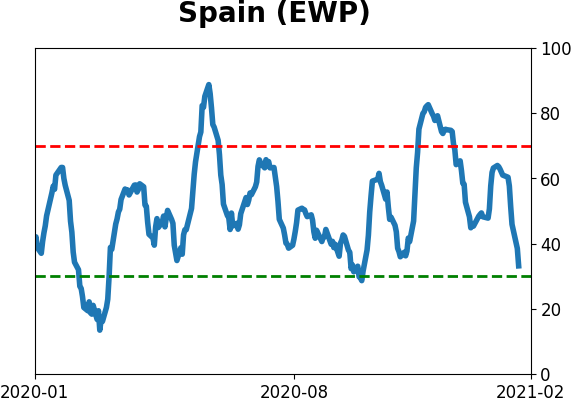
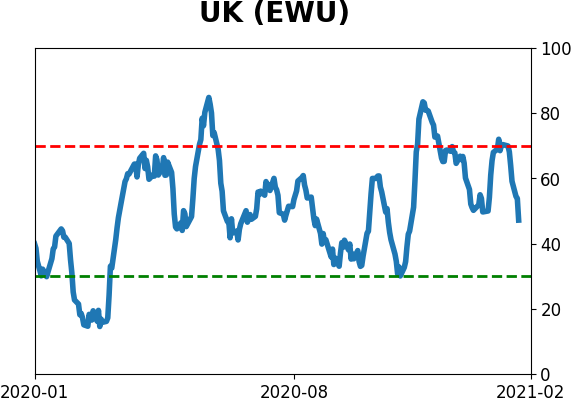
Country ETF's - 10-Day Moving Average
|
|
|
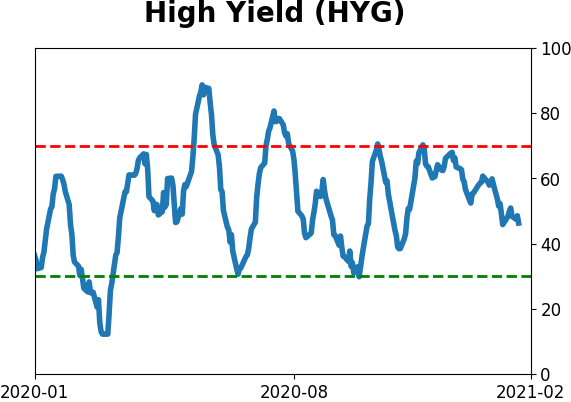
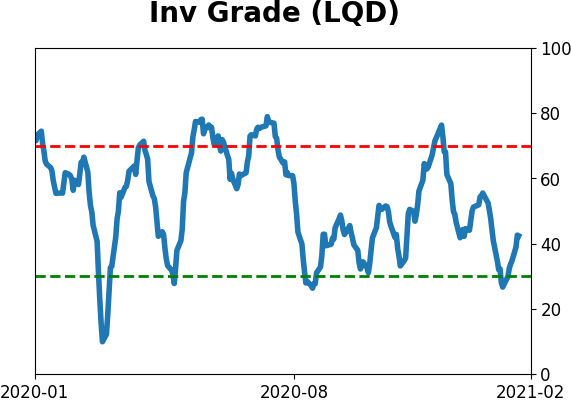
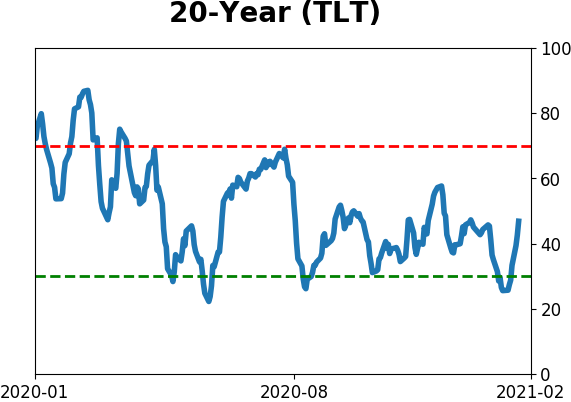
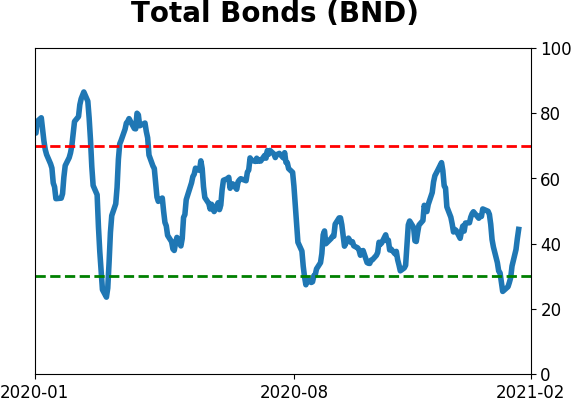
Bond ETF's - 10-Day Moving Average
|
|
|
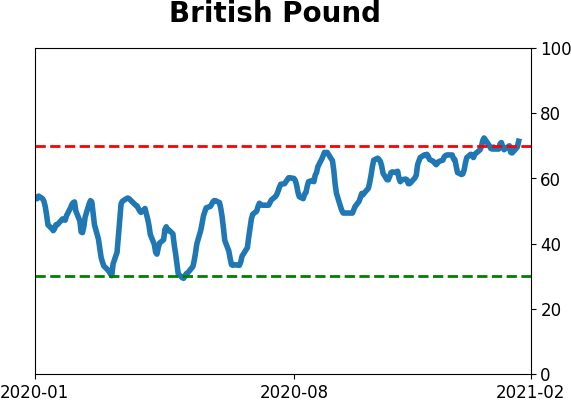
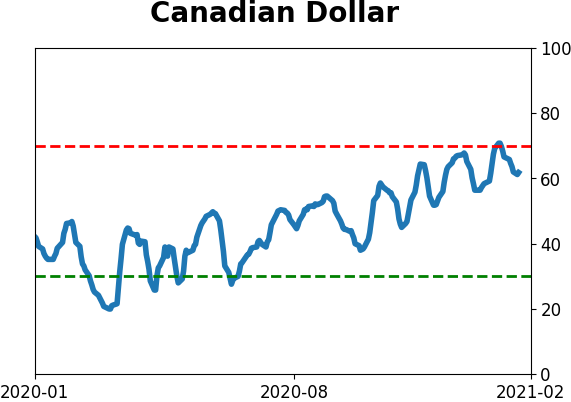
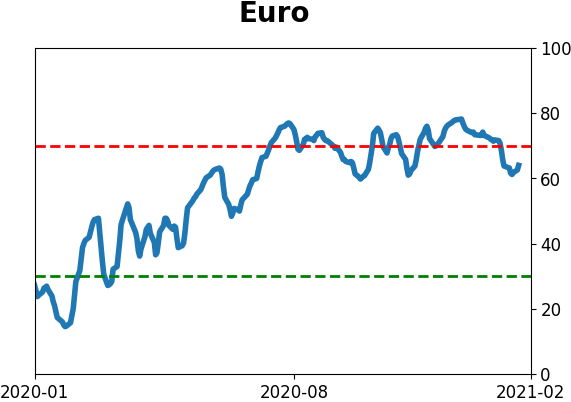
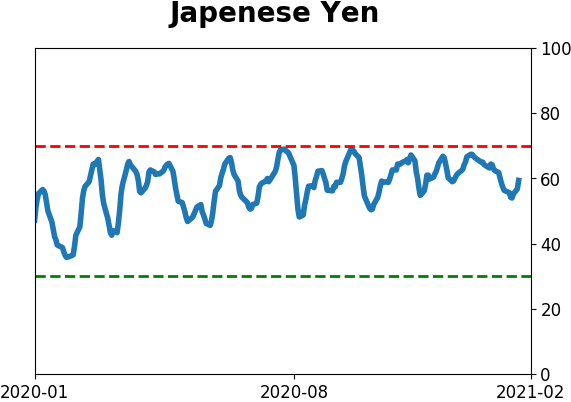
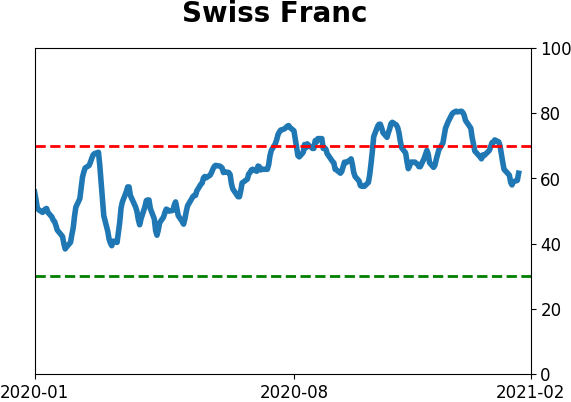
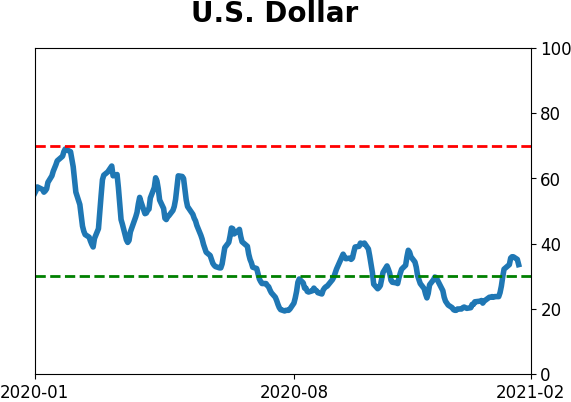
Currency ETF's - 5-Day Moving Average
|
|
|
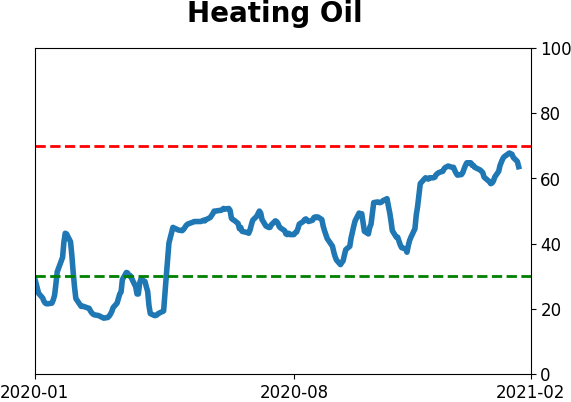
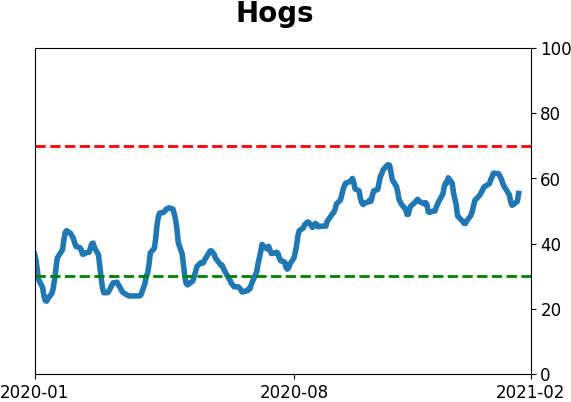
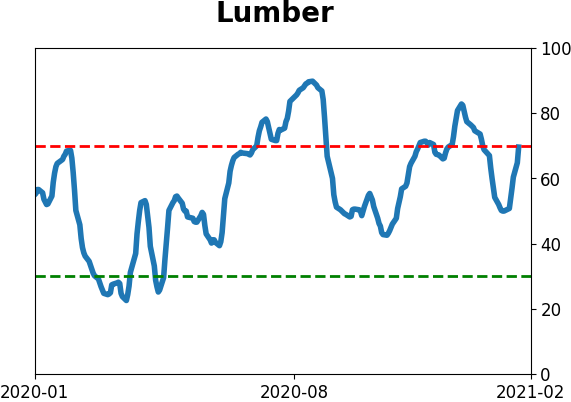
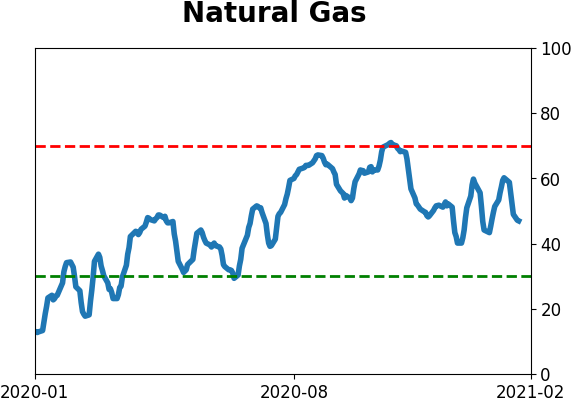
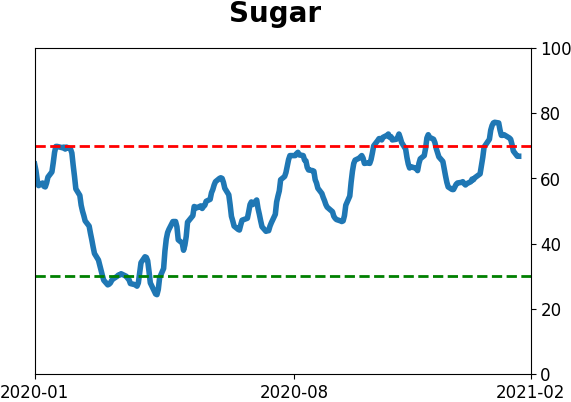
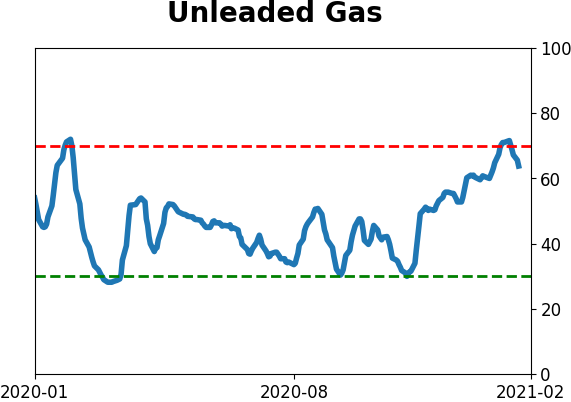
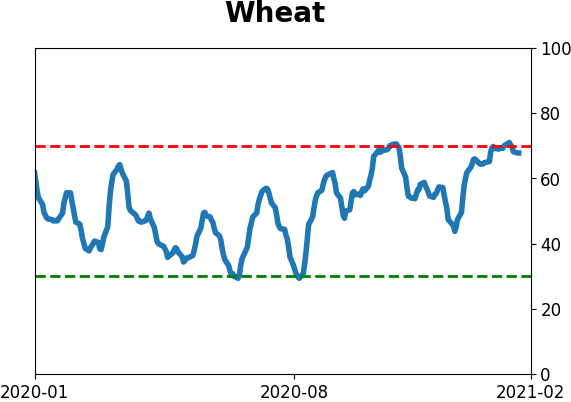
Commodity ETF's - 5-Day Moving Average
|
|