Headlines
|
|
The ice is cracking:
As the S&P 500 moves to new highs, fewer stocks are trading above their short-term moving averages, and the McClellan Oscillator has been hanging below the zero line.
Minor changes: There have been 3 main pieces of feedback we've received most frequently: 1) What is your bottom line stance?, 2) Why?, and 3) What are you doing about it? To help answer those points, our Outlook (formerly Bottom Line) will now have a general rating for the 3 primary markets that most are concerned with. It will link to a "live" page that contains our latest outlook, reasons for those outlooks, and portfolio allocations as a response. If you're looking for one place for a bottom line, fat pitch type of summary, this is the place.
Bottom Line:
NOTE: See the "live" page for more details on these summariesSTOCKS: Weak sell
We're in an extremely speculative environment that is enough to become defensive, especially with recent cracks showing in what had been pristine breadth conditions.BONDS: Weak buy
Various parts of the market have been hit in recent weeks, with mild oversold conditions that have started to reverse.GOLD: Weak buy
A dollar trying to rebound from a severe short position has weighed on gold and miners. The types of signals they've given in recent weeks, within the context of their recent surge, have usually resulted in higher prices.
|
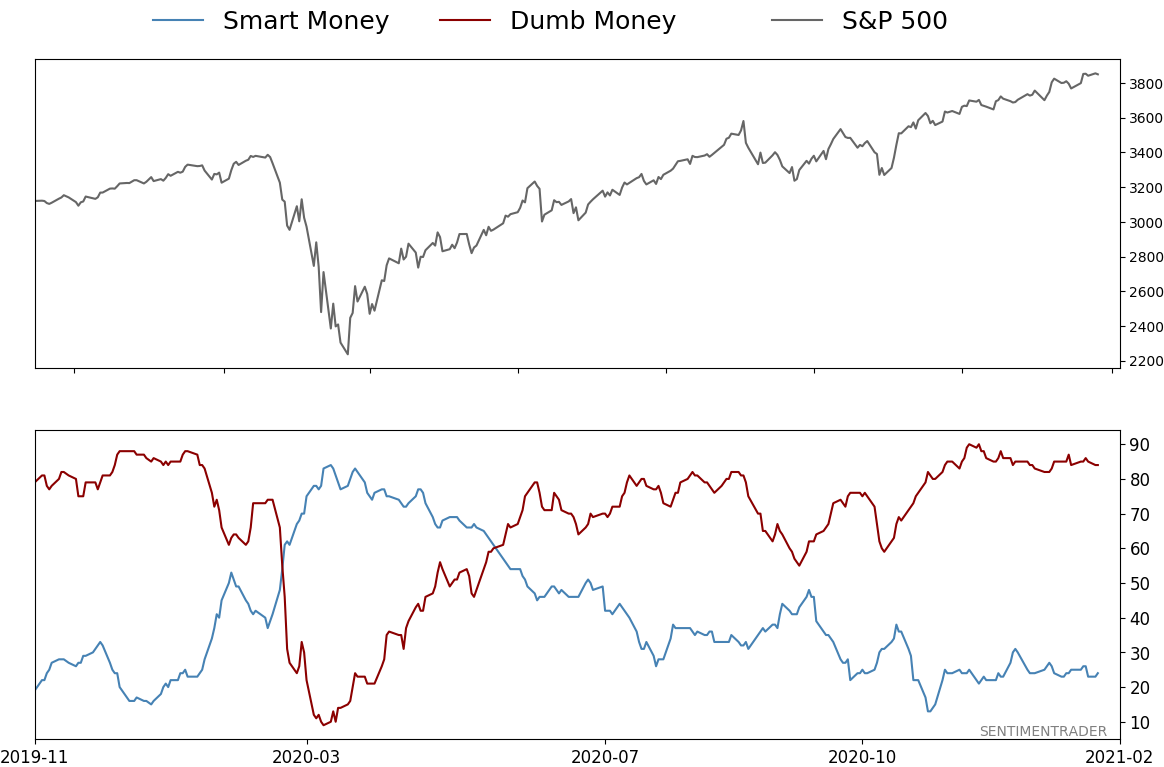
Smart / Dumb Money Confidence
|
Smart Money Confidence: 24%
Dumb Money Confidence: 84%
|
|
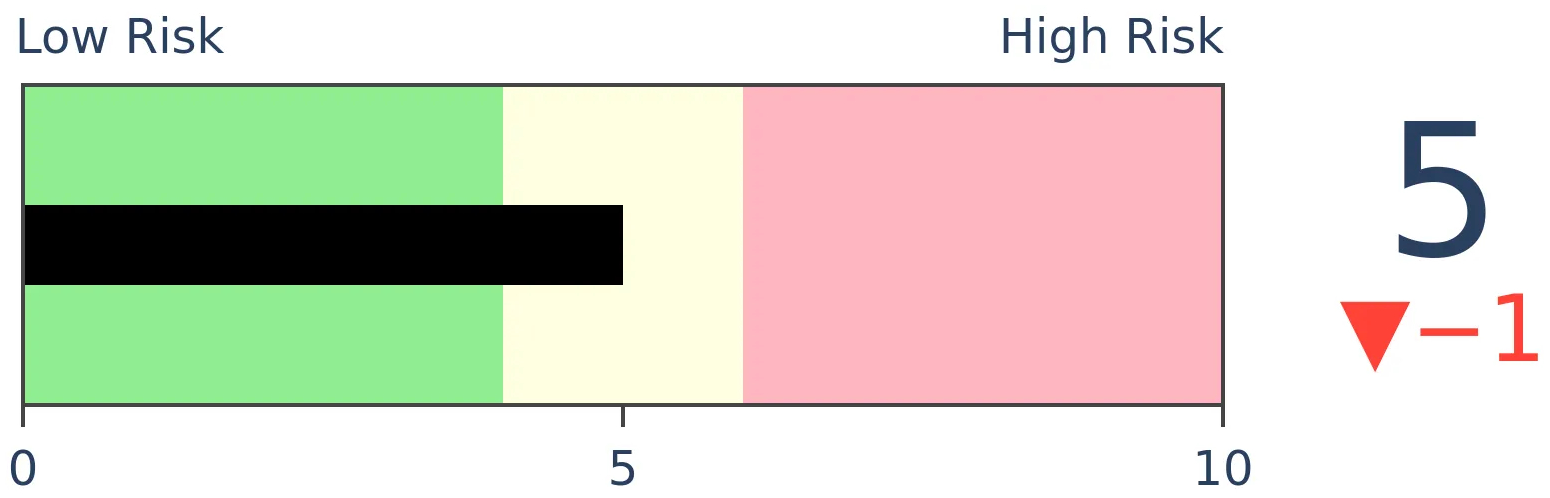
Risk Levels
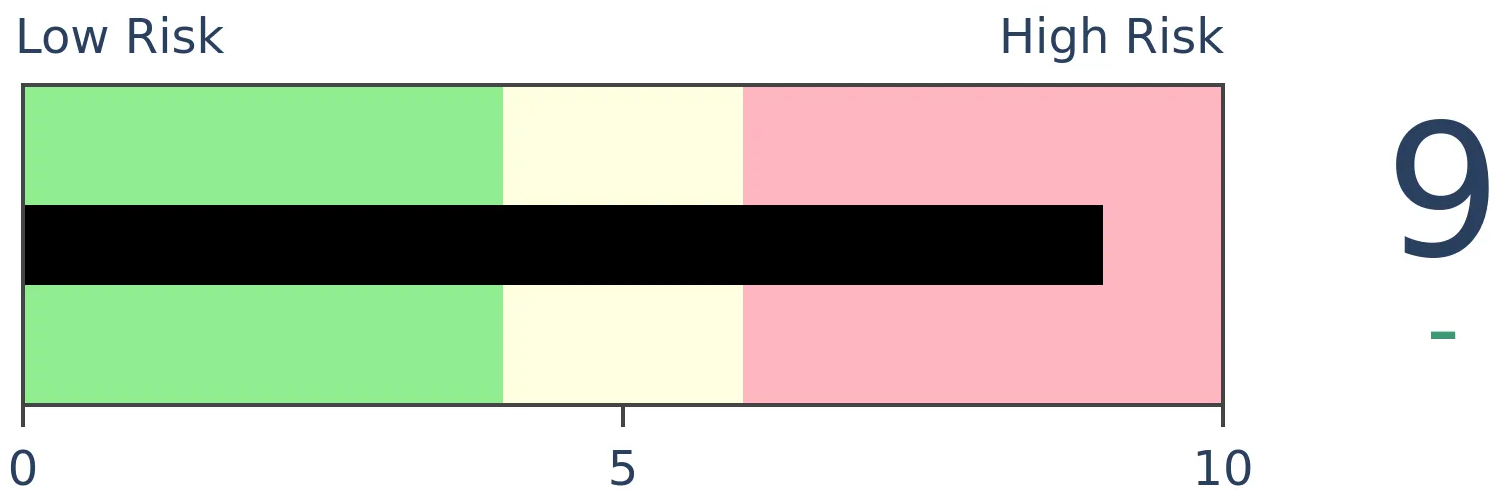
Stocks Short-Term
|
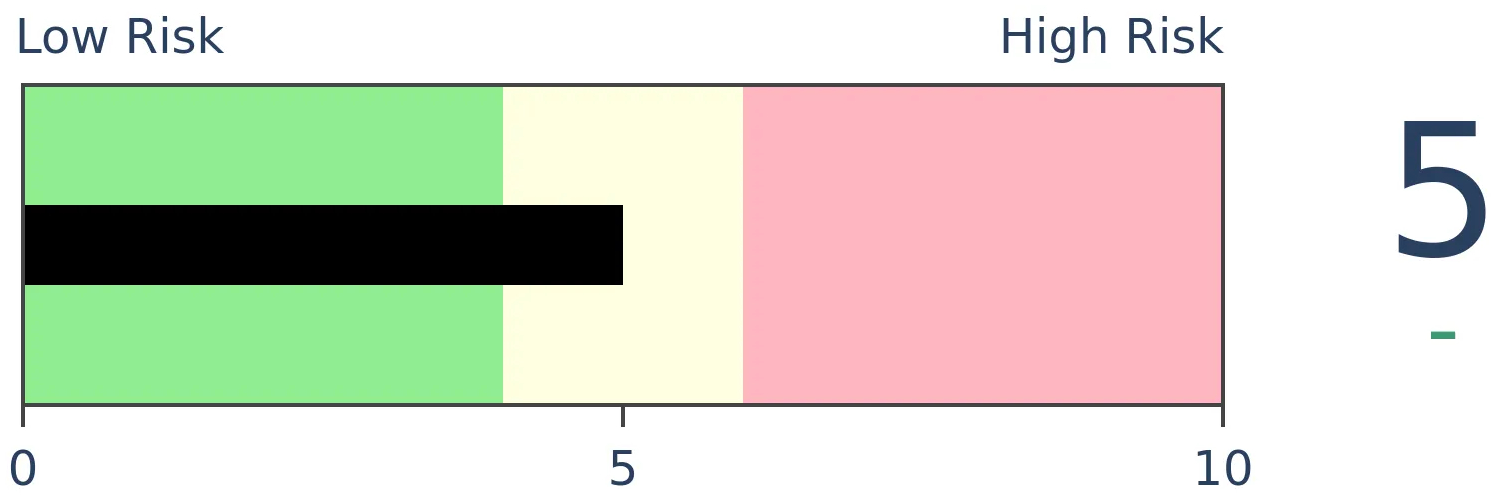
Stocks Medium-Term
|
|
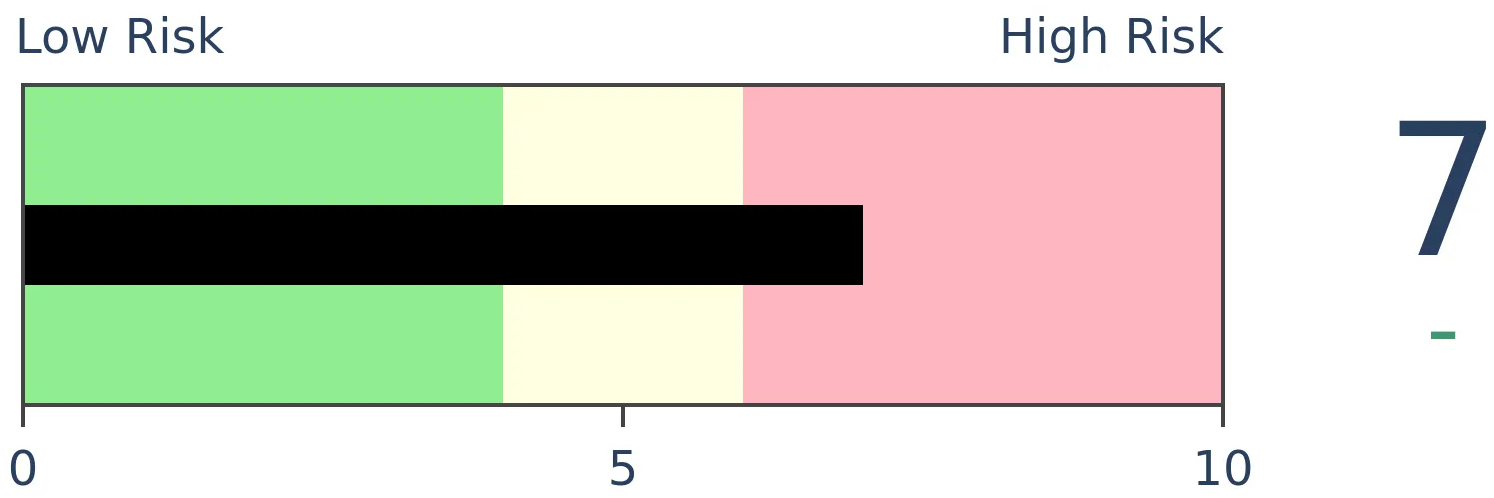
Bonds
|
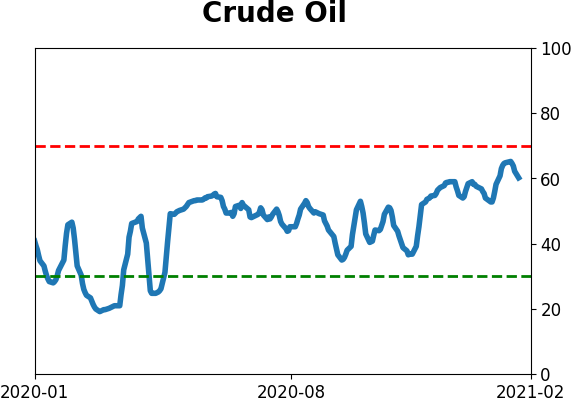
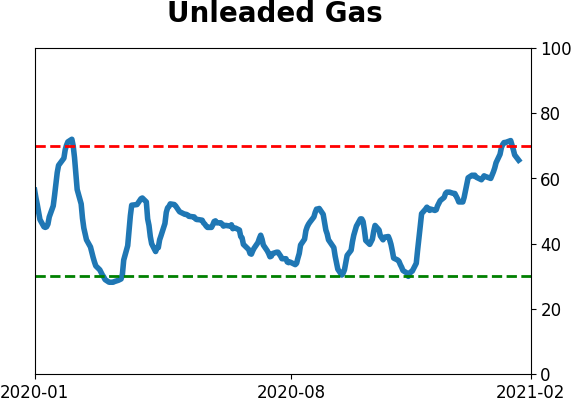
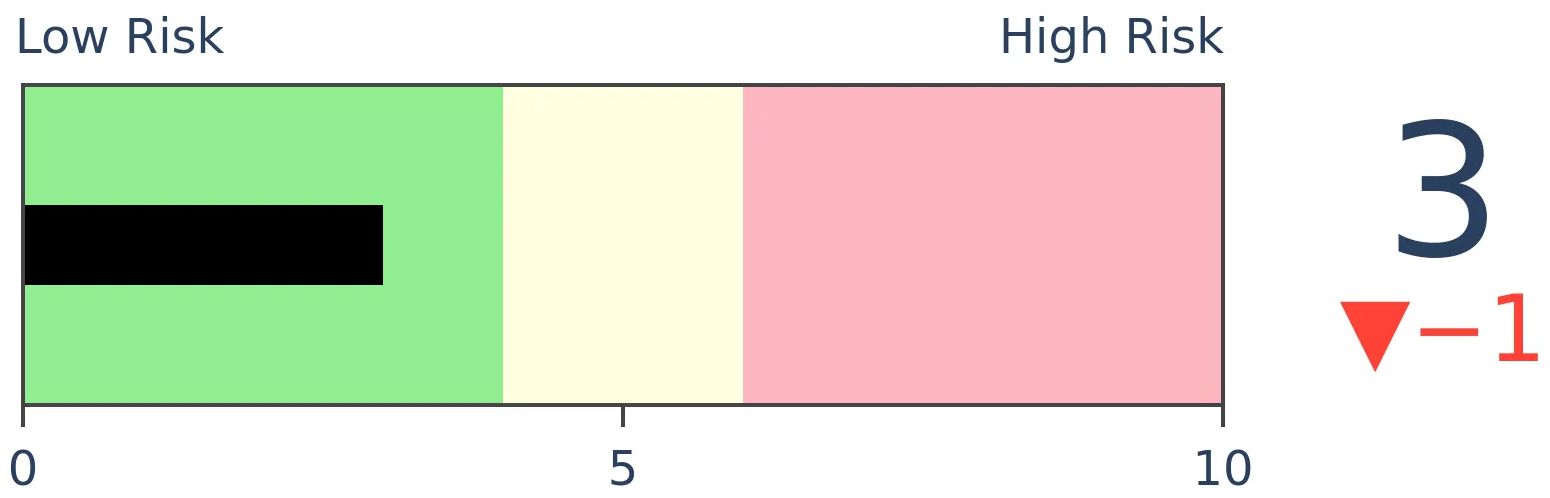
Crude Oil
|
|
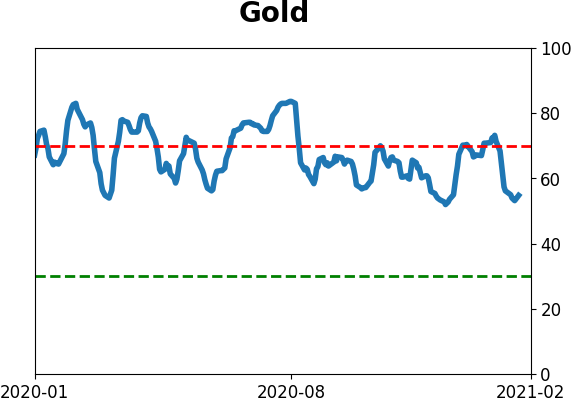
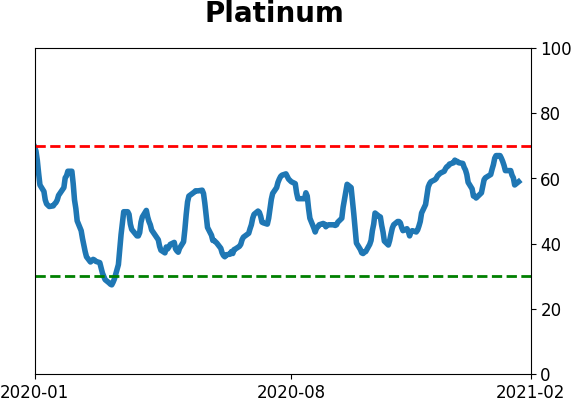
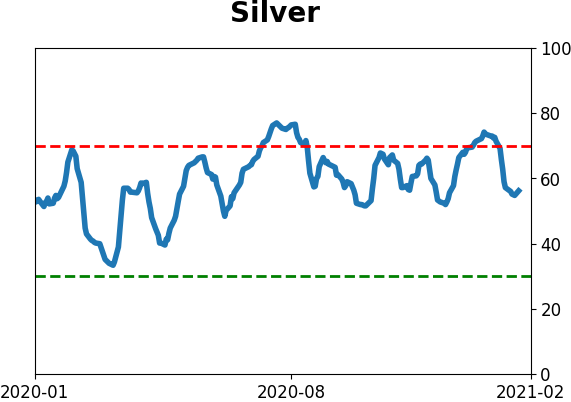
Gold
|
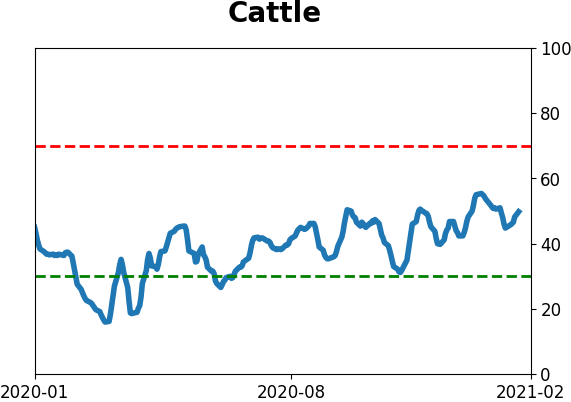
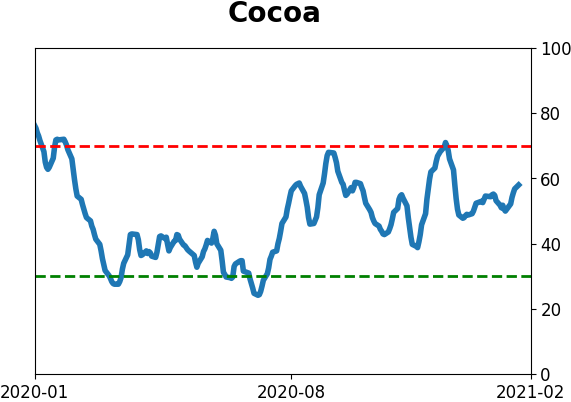
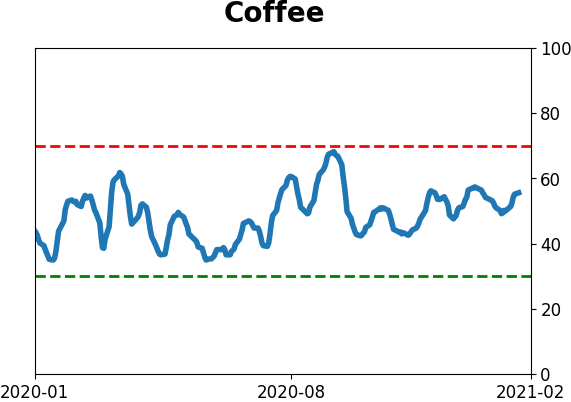
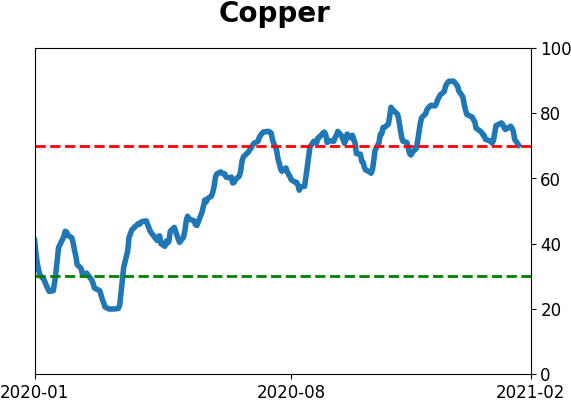
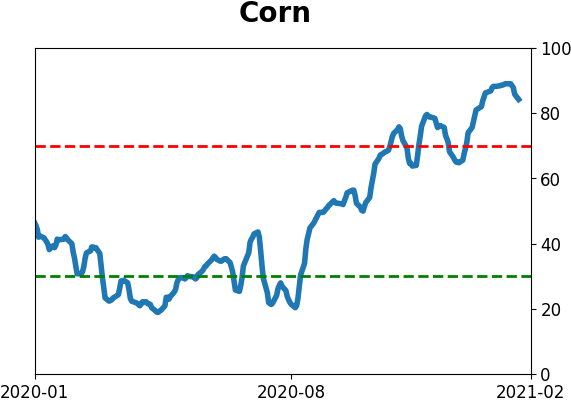
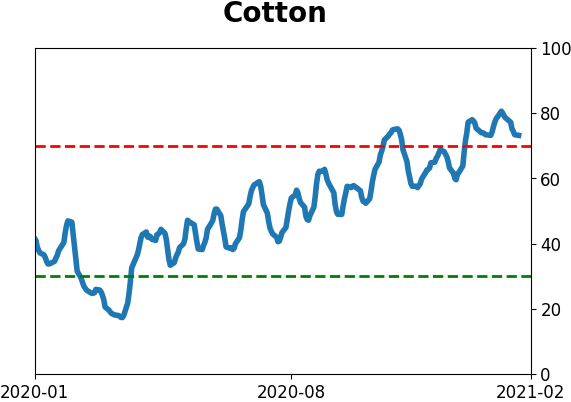
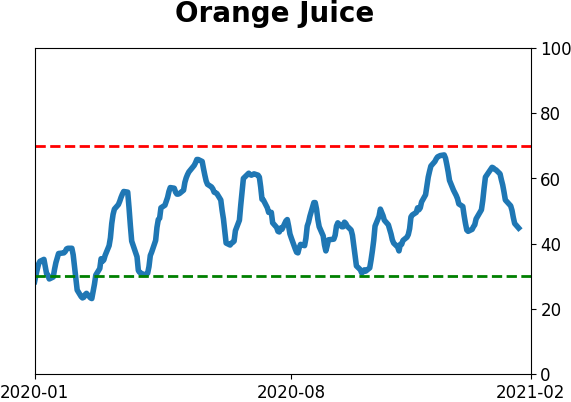
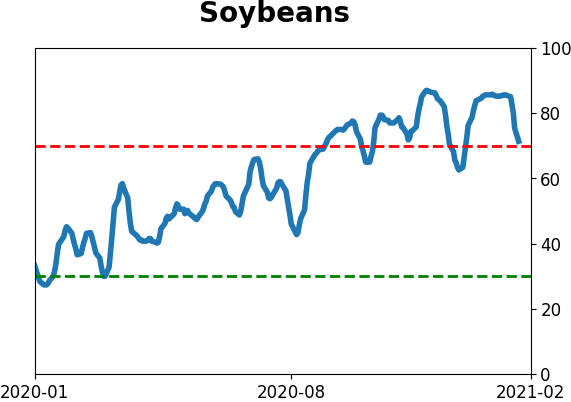
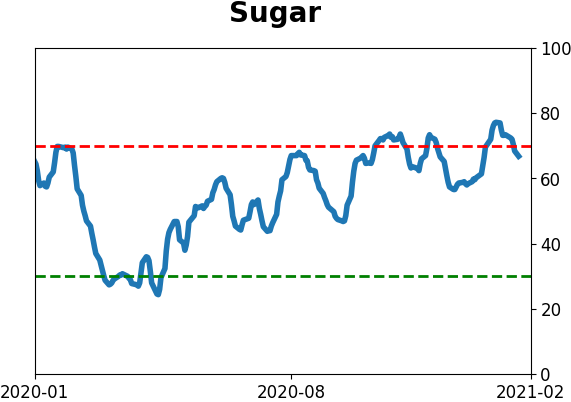
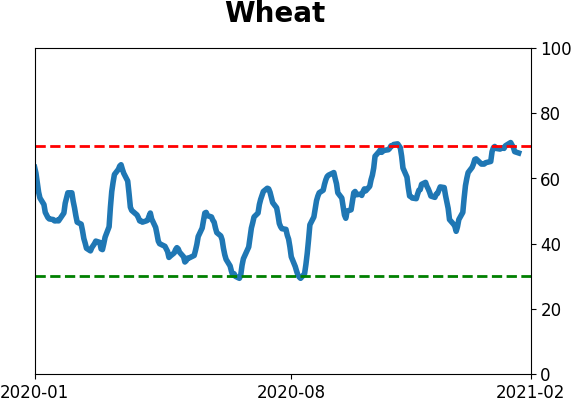
Agriculture
|
|
Research
BOTTOM LINE
As the S&P 500 moves to new highs, fewer stocks are trading above their short-term moving averages, and the McClellan Oscillator has been hanging below the zero line.
FORECAST / TIMEFRAME
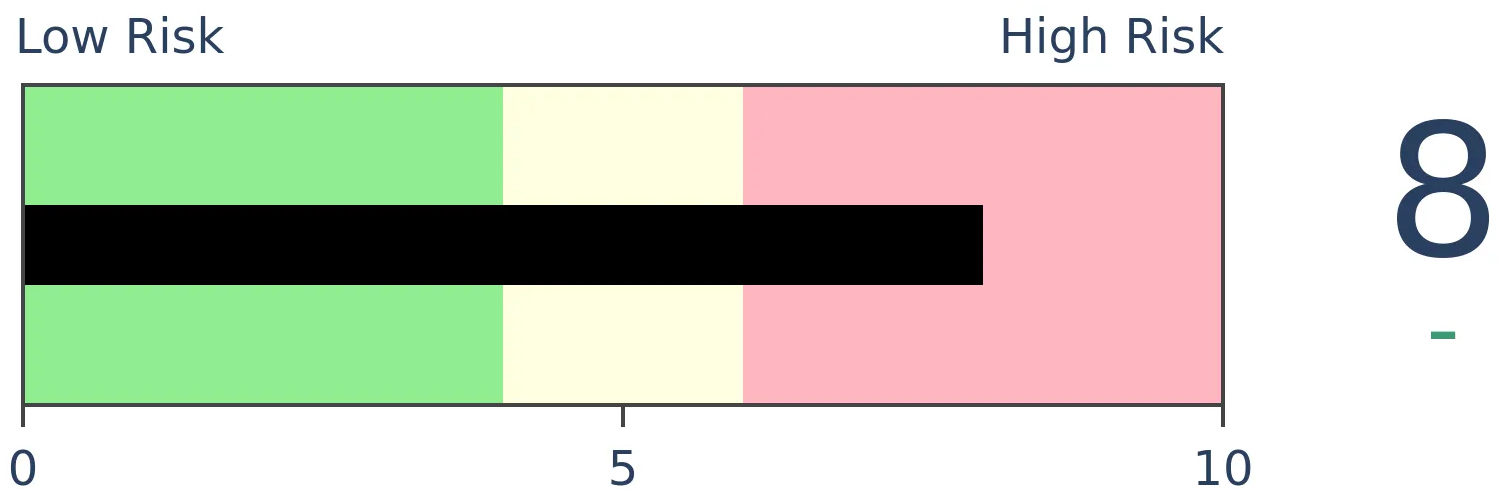
SPY -- Down, Medium-Term
|
Since markets bottomed last fall, both Dean and I have highlighted the impressive participation and thrusts underlying the rise in the indexes. A lot of stocks (and bonds) were rising, and the buying pressure was impressive. That kind of activity tends to lead to longer-term gains.
Shorter-term is a different matter, but even that has led to only inconsistent losses. The biggest issues have come when underlying momentum wanes and we see cracks under the surface.
That's what's happening now.
In multiple Daily Reports over the last couple of weeks, we've pointed out oddities on days the indexes rallied. That's a change from recent months, and by themselves, they're not a big warning sign. When it starts to spread, and we see clusters, then it's more of a worry.
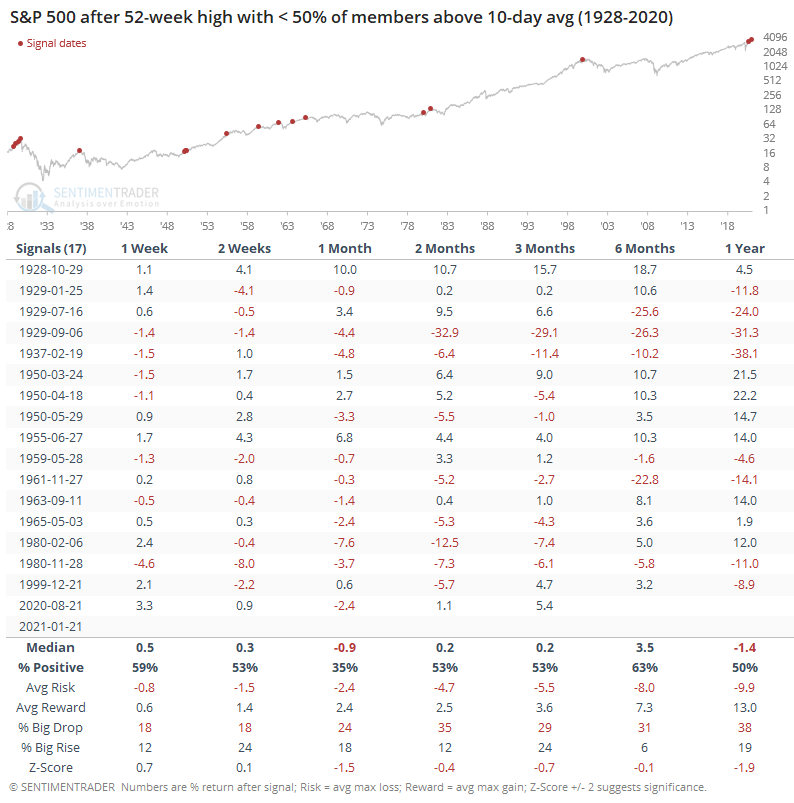
As noted yesterday, the S&P 500 closed at another record high on Monday, and yet fewer than 45% of its stocks managed to close above their 10-day moving averages. That's a lot of short-term downtrends on a day the index closed at a high.
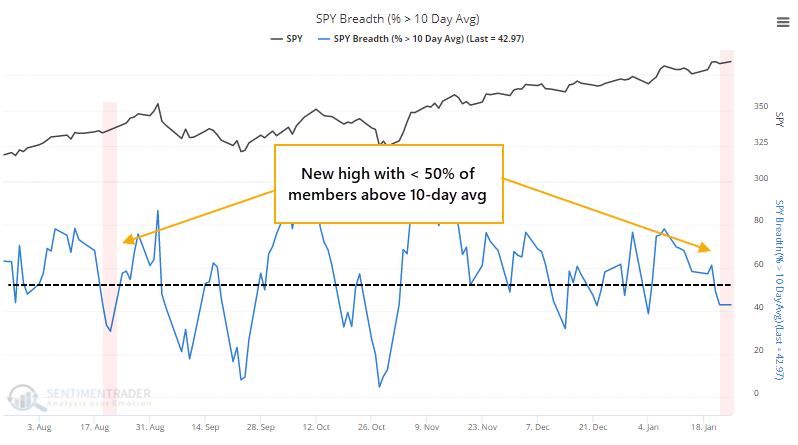
The only time in recent years that we've pointed out similar behavior was last August. The indexes managed to run for a couple more weeks, then suffered corrections in September. If we relax that to 50%, then it's still unusual, and forward returns were not impressive.
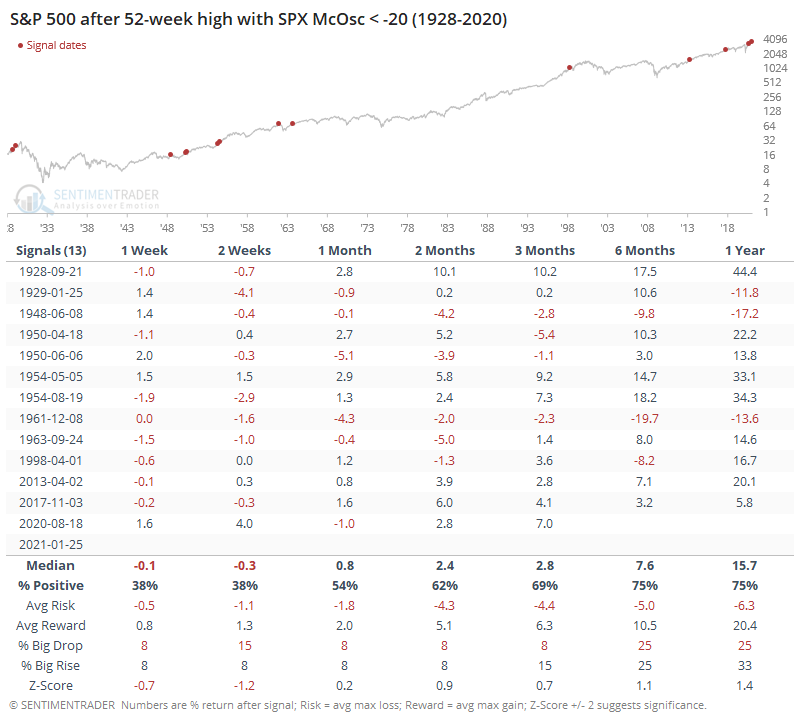
The reason why relatively few stocks are above their 10-day averages is that relatively few have been rising on days the S&P showed a gain. That difference between advancing and declining stocks has been negative enough that the McClellan Oscillator for the S&P 500 is well below zero.
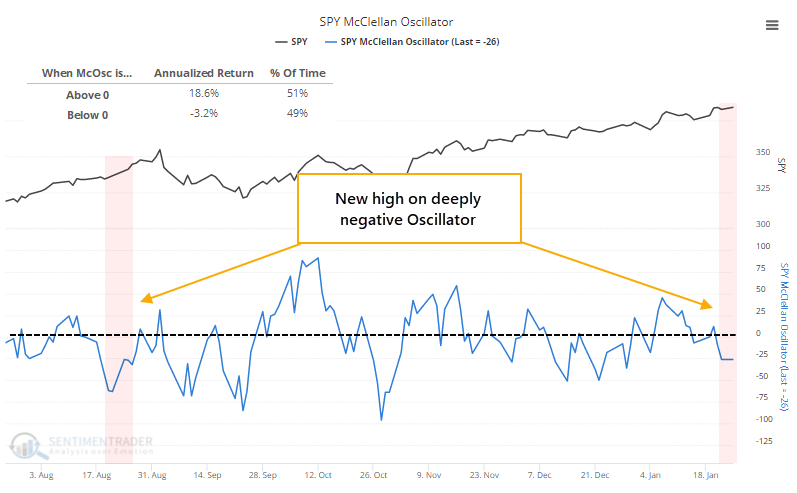
We can see from the chart that the S&P's annualized return since 1928 when its Oscillator was below zero is an abysmal -3.2%.
Once again, it's unusual to see it below zero, and especially well below zero, when the index itself closes at a 52-week high. The only time in recent years that it triggered was last August.
Markets are currently being held in captivity by another wave of speculation among options traders. The only time in 20 years that speculation neared the current level was in the latter half of last August. It's probably not a coincidence that that was also when we started to see initial signs of deterioration in stocks underlying the major indexes like we are now.
Growing up in the frigid Upper Midwest, we quickly learn to identify "bad" ice versus "good" ice. Mistaking one for the other leads to a very unpleasant outcome. Until the last week or so, markets have been skating on good ice. Recent sessions have started to pop off that cracking sound that makes the hairs stand up on the back of the neck of anyone walking across a frozen lake. Sometimes it's just new ice forming. Most of the time, it's the precursor to a fall.
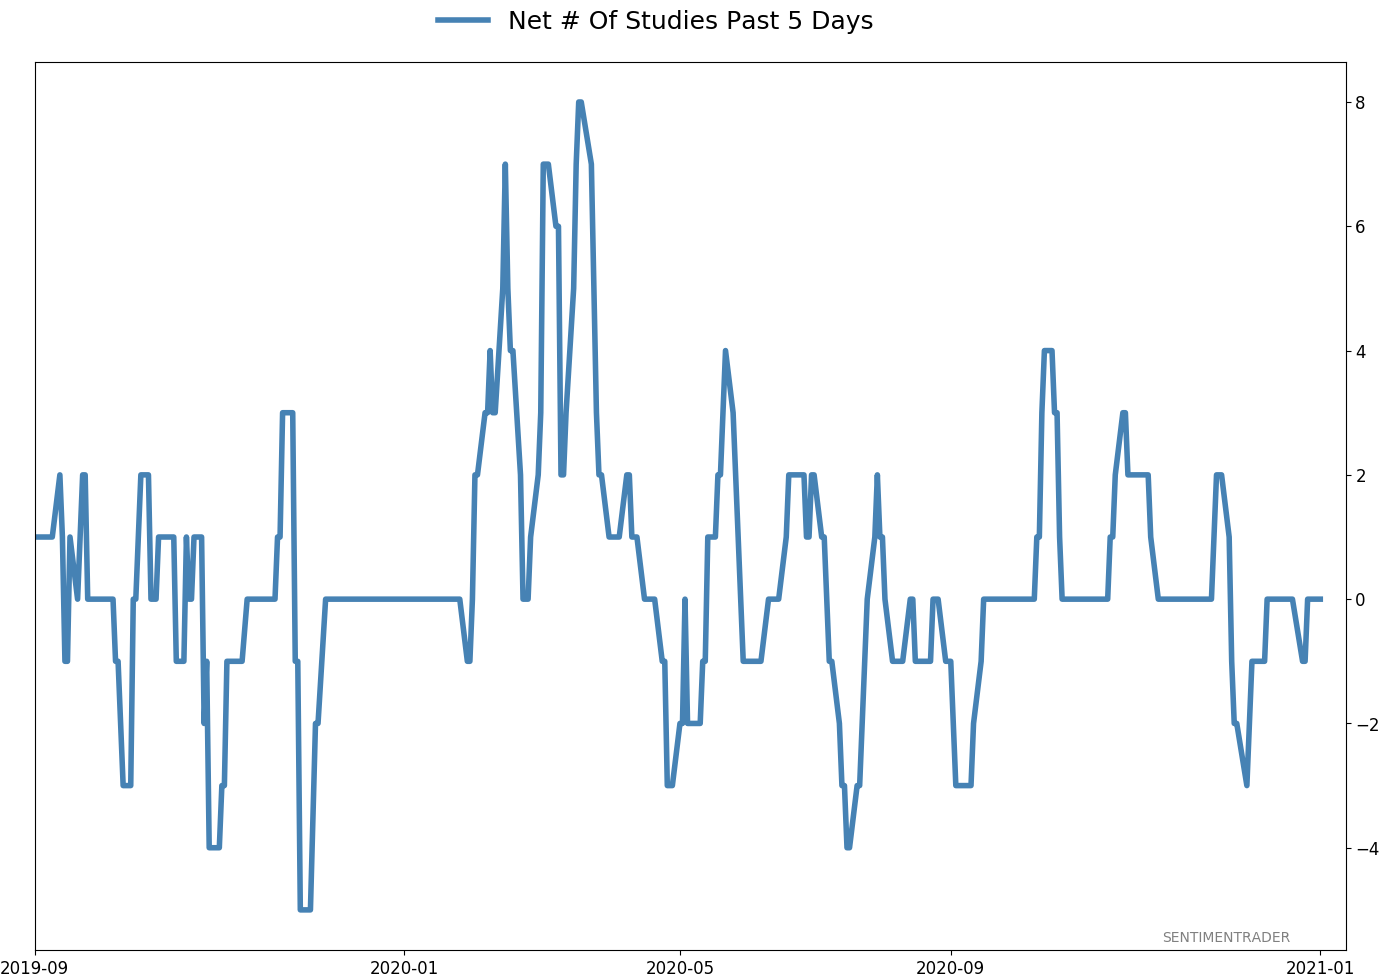
Active Studies
| Time Frame | Bullish | Bearish | | Short-Term | 0 | 0 | | Medium-Term | 2 | 3 | | Long-Term | 15 | 2 |
|
Indicators at Extremes
Portfolio
| Position | Description | Weight % | Added / Reduced | Date | | Stocks | 8.7% RSP | 8.7 | Reduced 28.8% | 2021-01-26 | | Bonds | 9.5% ANGL, 9.1% SCHP, 9.0% BND | 27.6 | Reduced 0.2% | 2021-01-26 | | Commodities | GCC | 2.3 | Reduced 2.1%
| 2020-09-04 | | Precious Metals | GDX | 8.9 | Added 4.8% | 2020-12-01 | | Special Situations | 10.3% XLE, 8.9% PSCE | 19.2 | Added 19.2% | 2021-01-26 | | Cash | | 33.4 | | |
|
Updates (Changes made today are underlined)
With a market that has seen the kinds of broad participation and big breath thrusts like we did in the fall, it's hard to become too negative. Those kinds of conditions have consistently preceded higher returns over the next 6-12 months. It's the interim that's more of an issue. Even conditions like that haven't prevented some shorter-term pullbacks. And when we combine an environment where speculation is rampant and recent days have seen an increase in cracks under the surface of the indexes, it's enough to become more defensive over a short- to medium-term time frame. We still don't have much confirmation from the price action in the indexes, so those who are more conservative would likely wait before increasing cash levels. In a bid to more closely align the portfolio with what most of our members consider "stocks", we have moved any sector-specific investments to the "special situations" category instead of "stocks." This way, the "stocks" category is essentially the most benchmarked index in the world, the S&P 500. RETURN YTD: 3.0% 2020: 8.1%, 2019: 12.6%, 2018: 0.6%, 2017: 3.8%, 2016: 17.1%, 2015: 9.2%, 2014: 14.5%, 2013: 2.2%, 2012: 10.8%, 2011: 16.5%, 2010: 15.3%, 2009: 23.9%, 2008: 16.2%, 2007: 7.8%
|
|
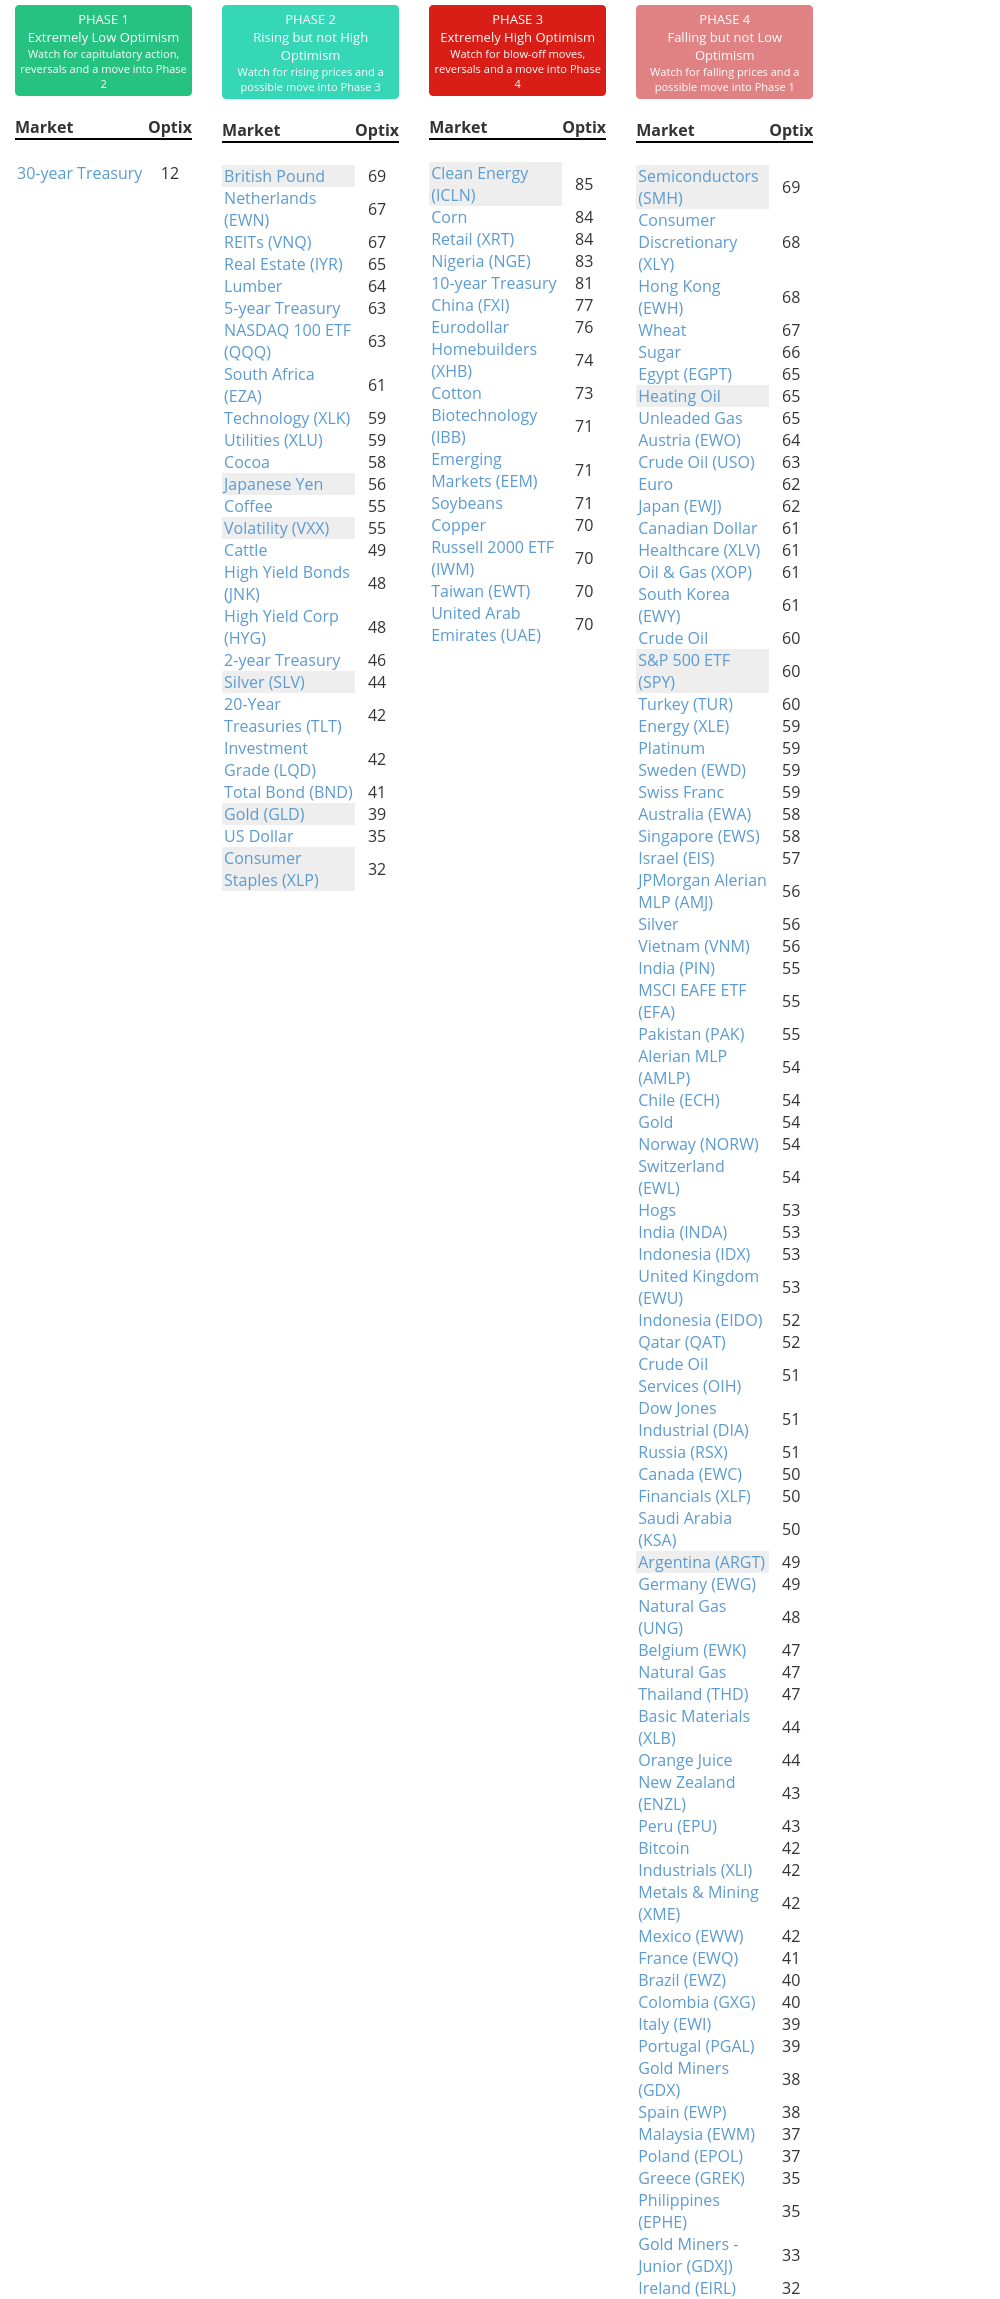
Phase Table
Ranks
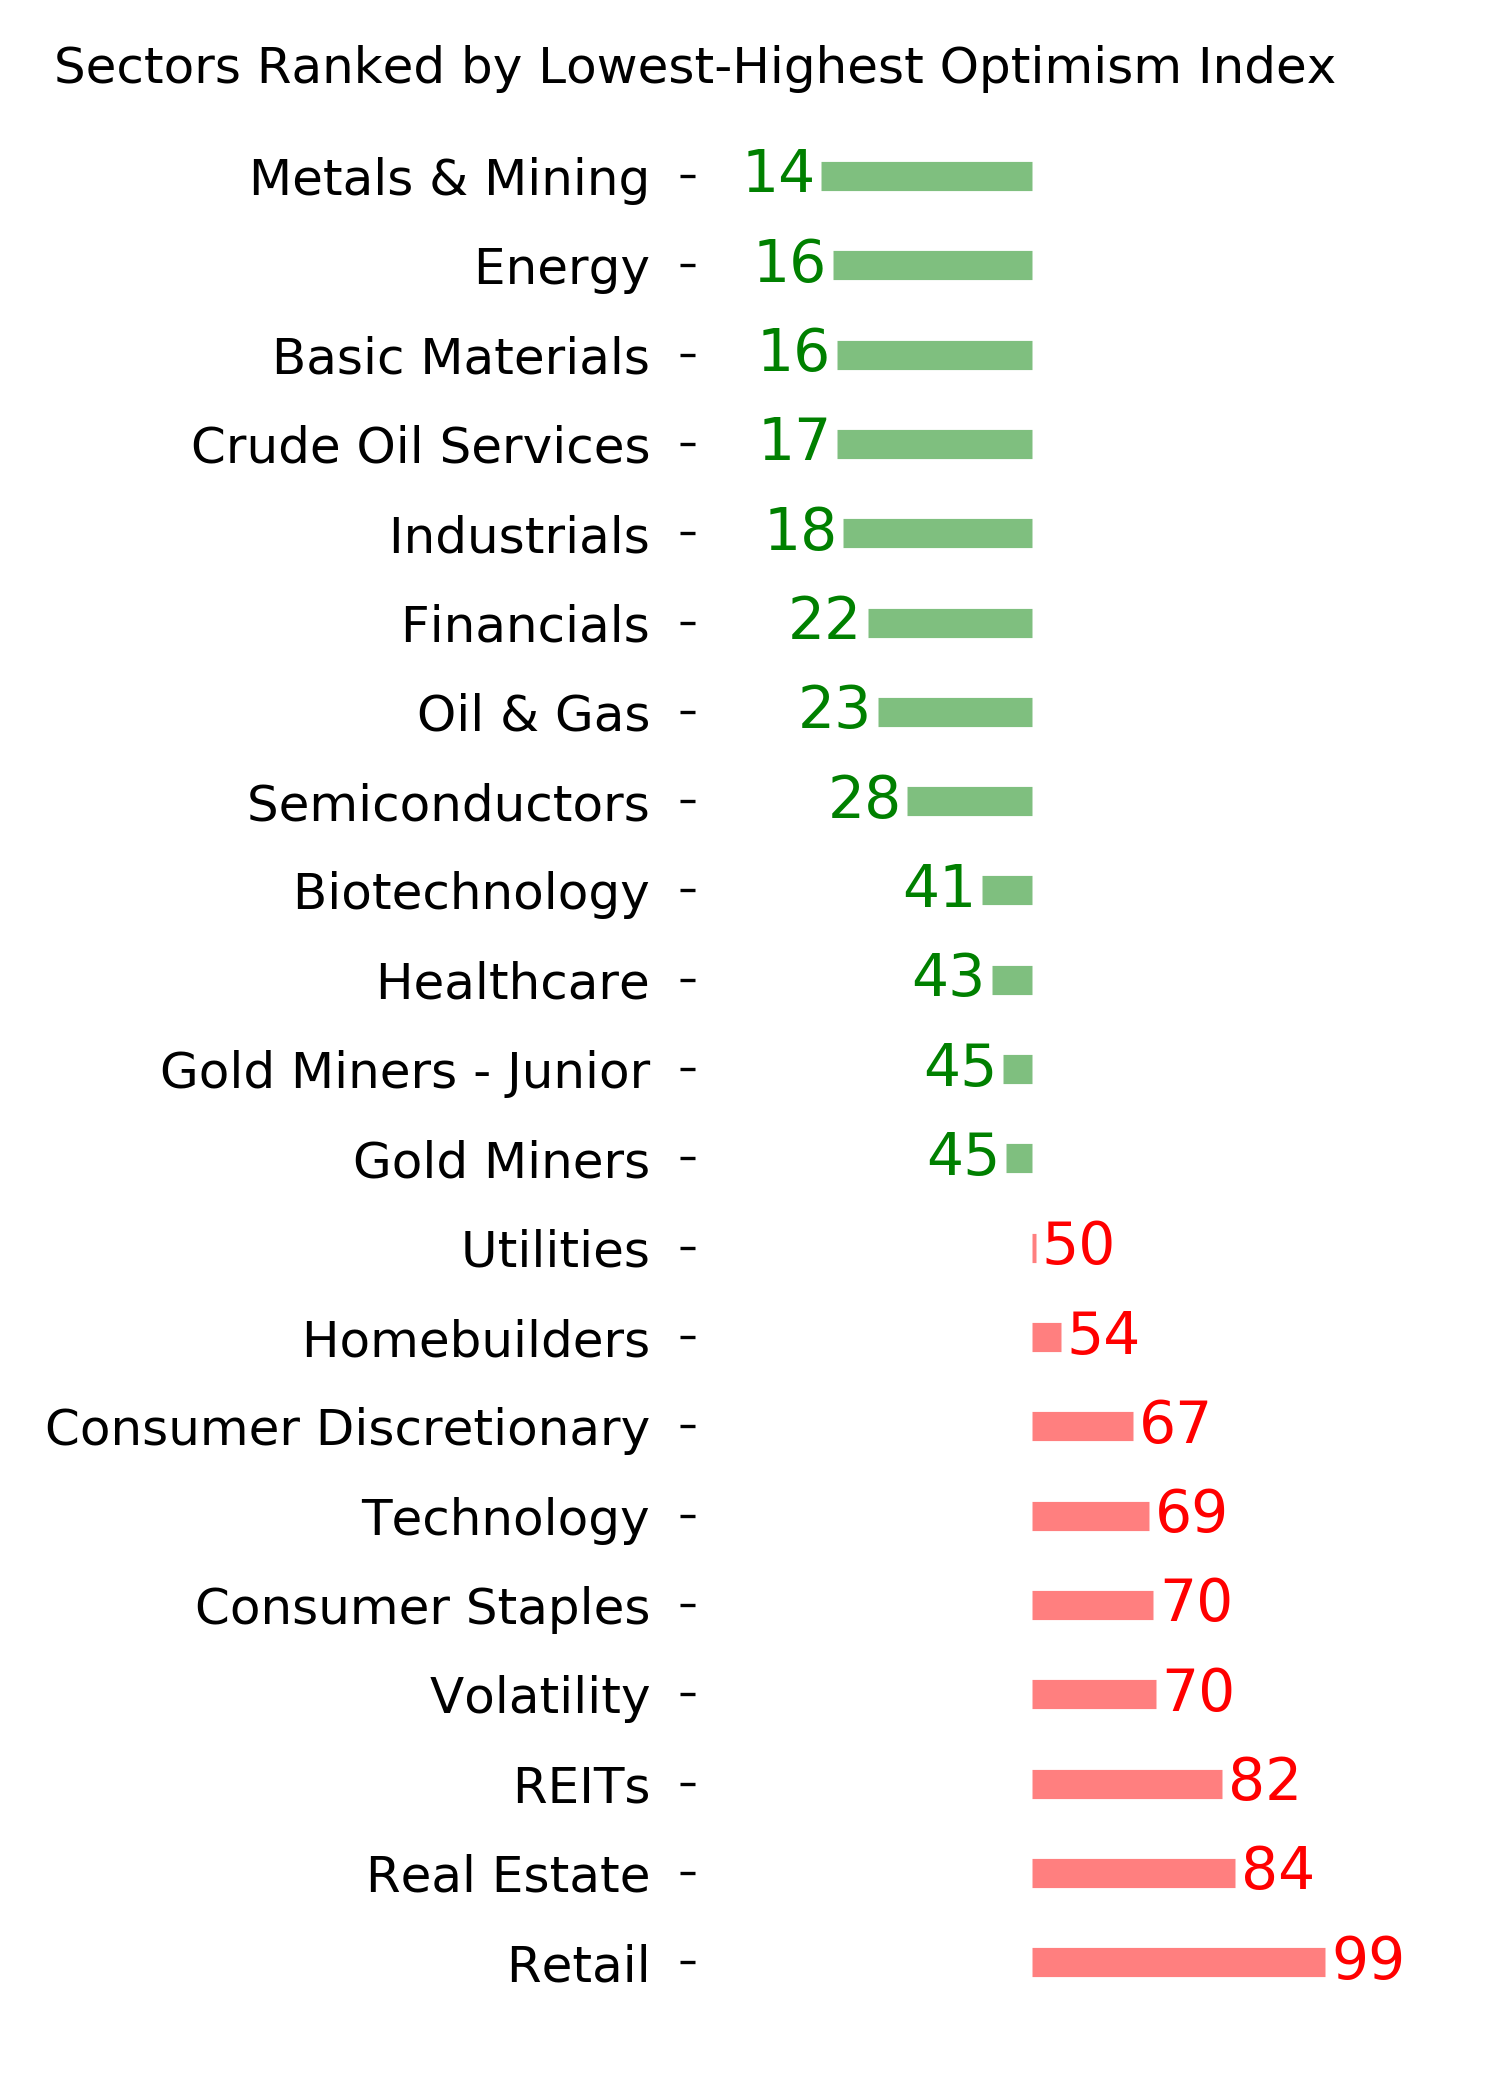
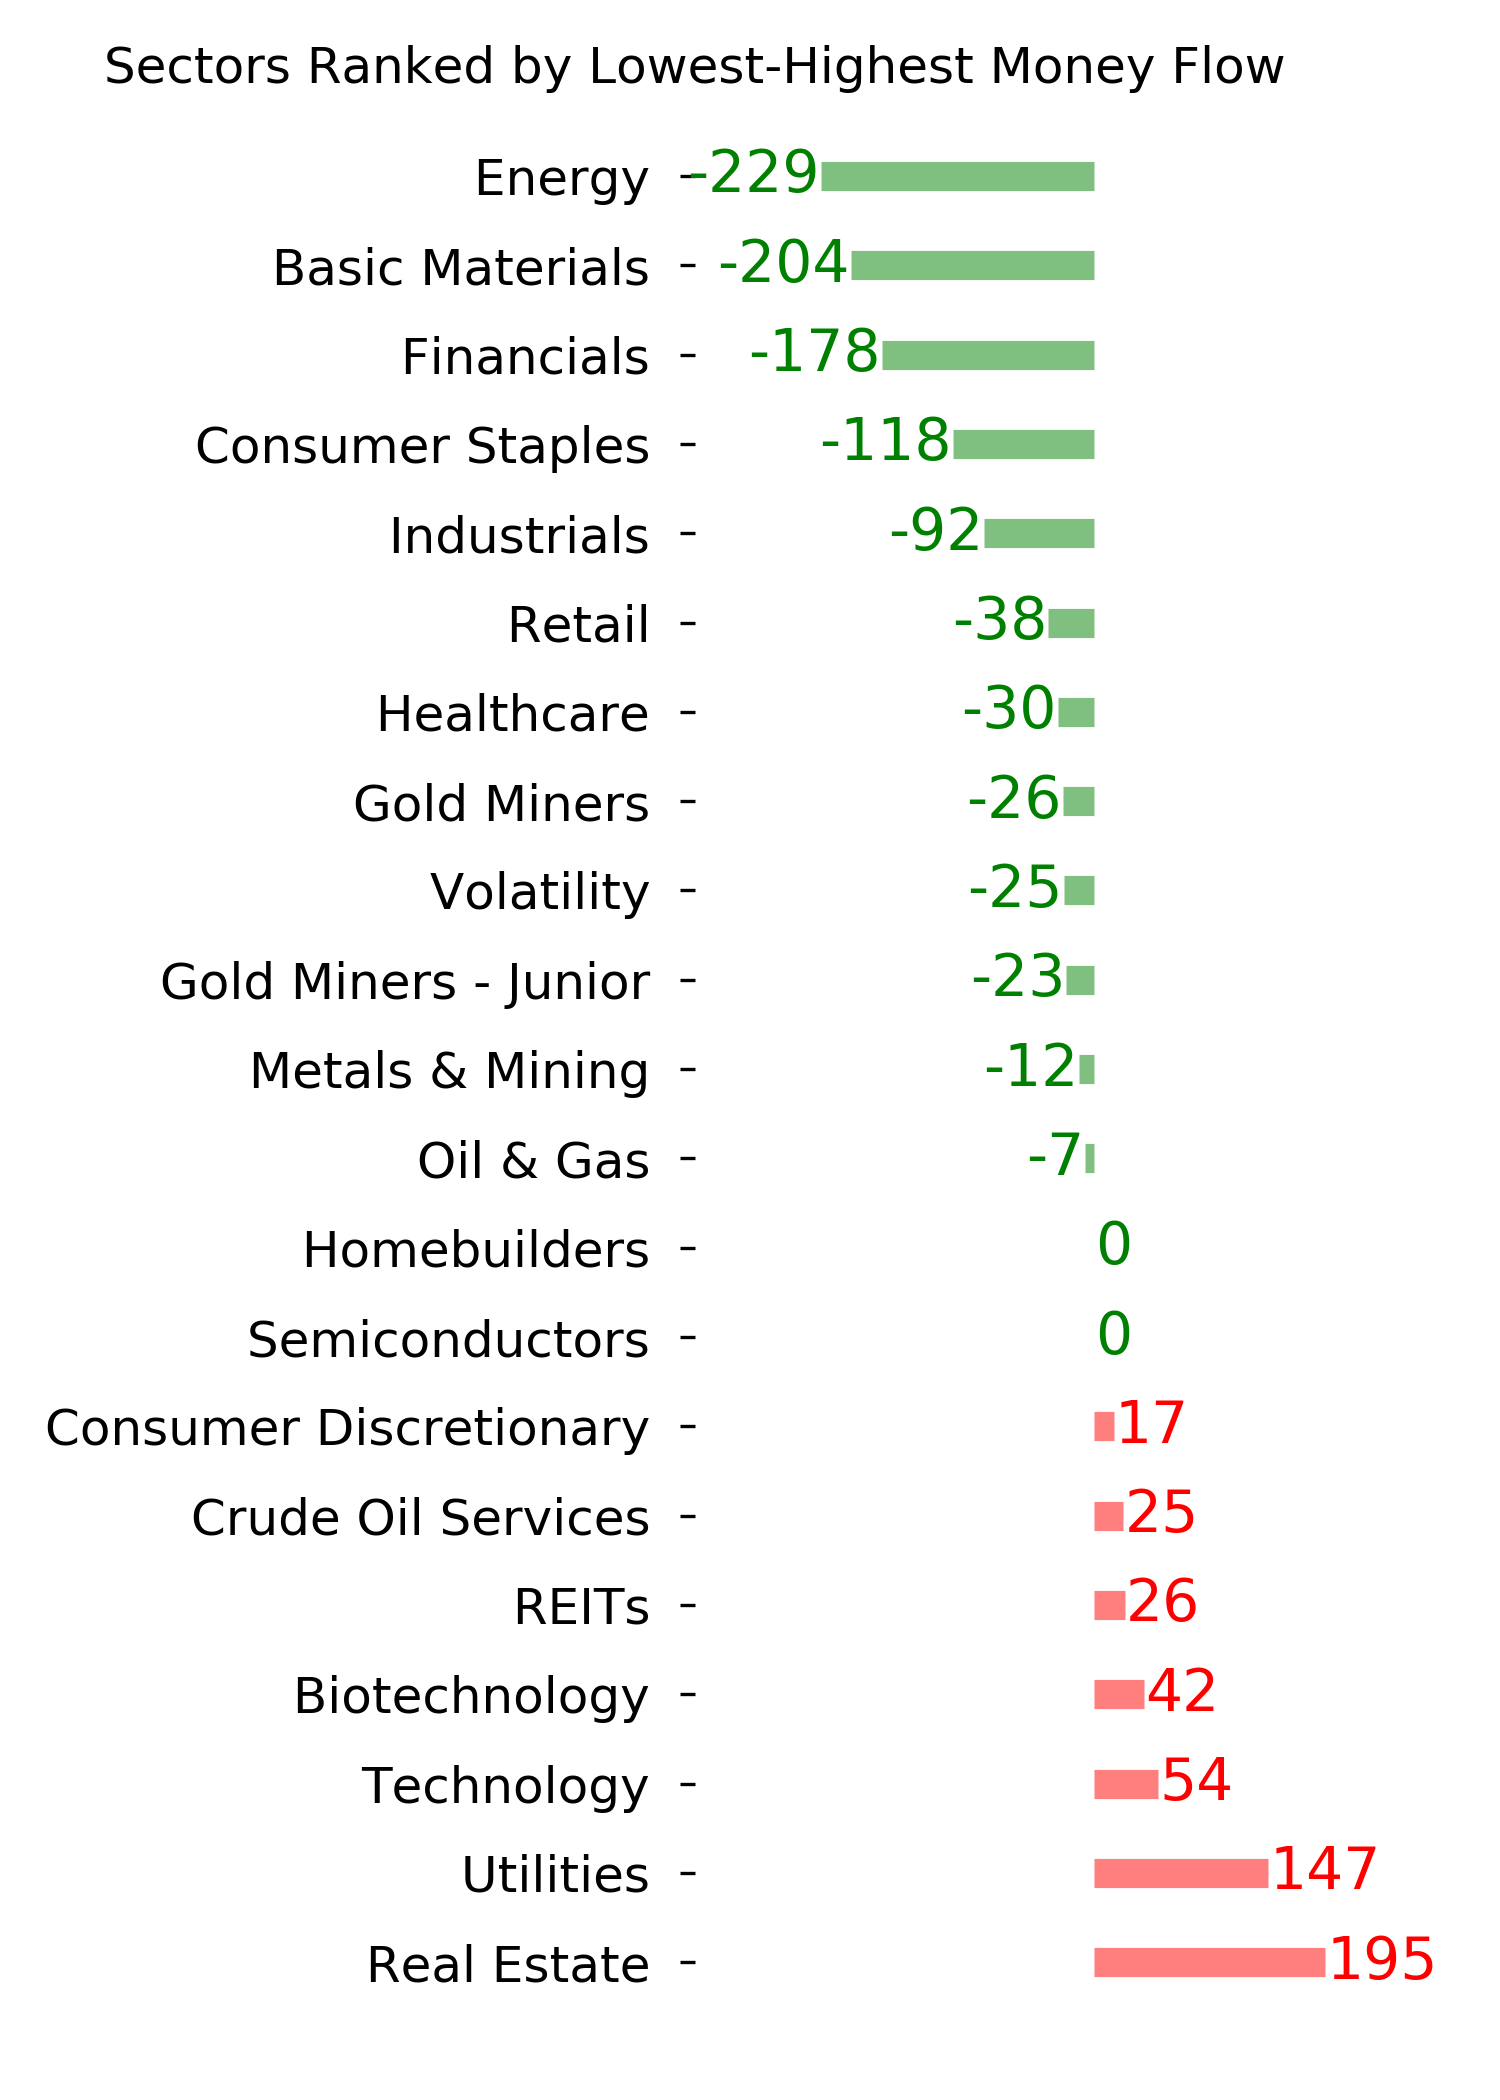
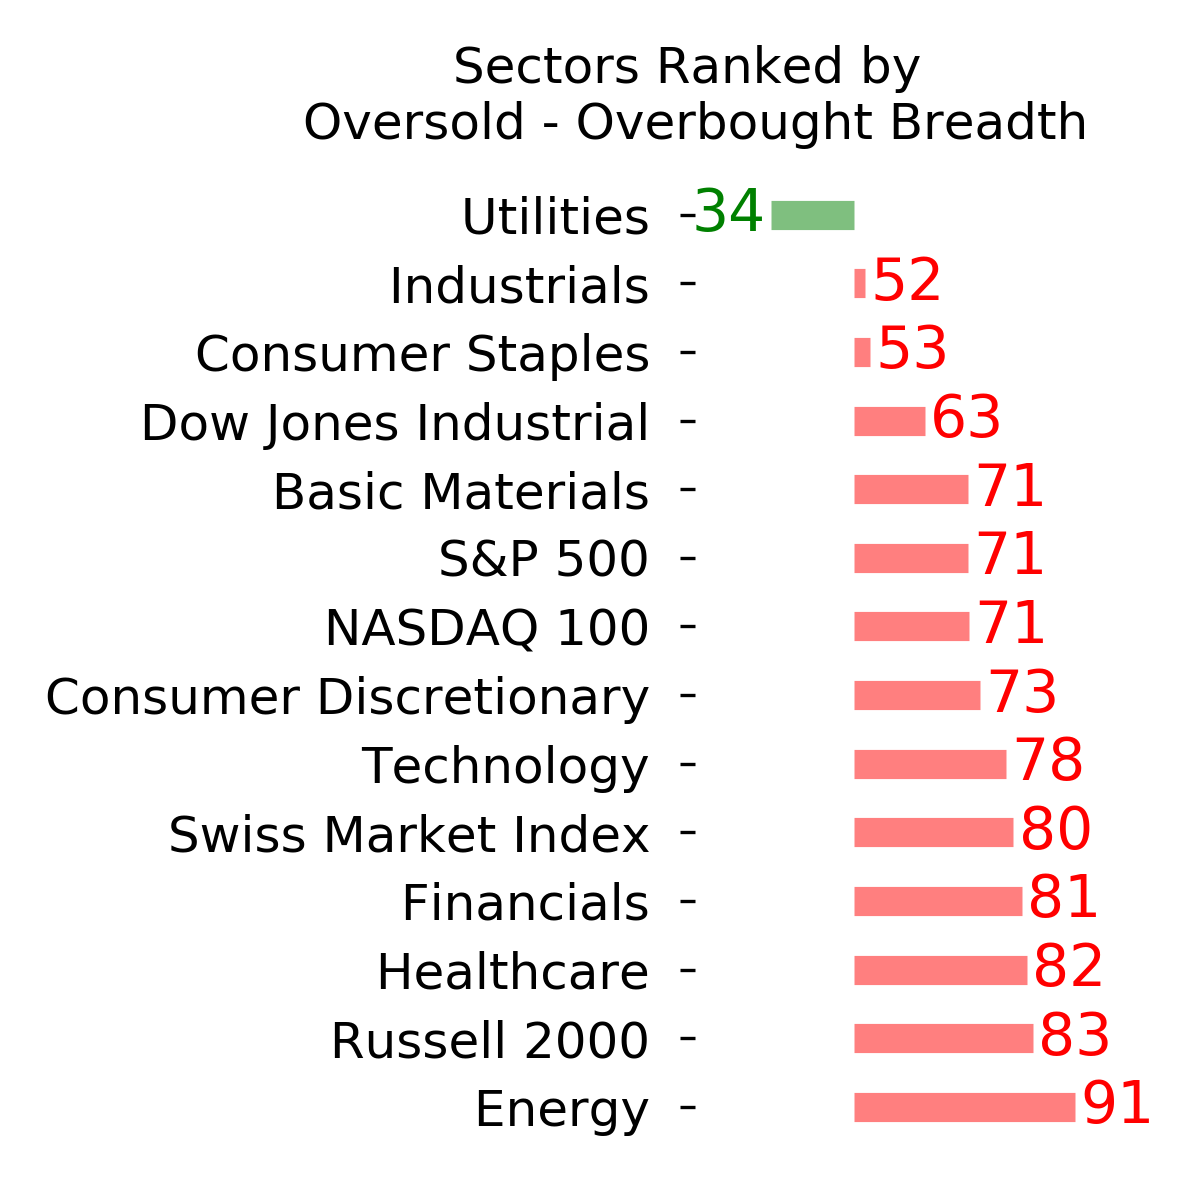
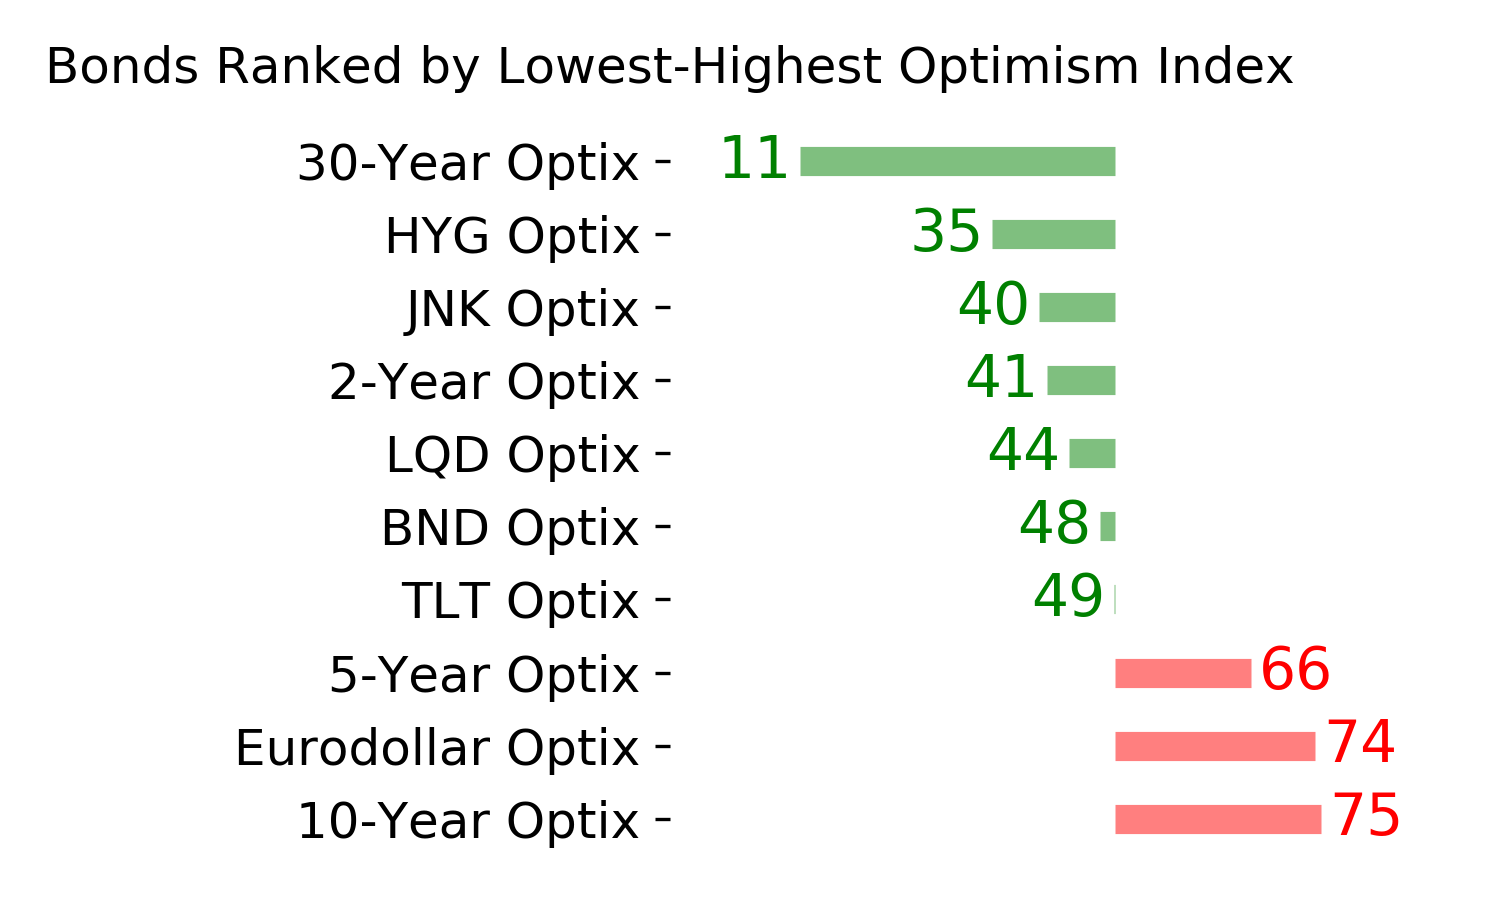
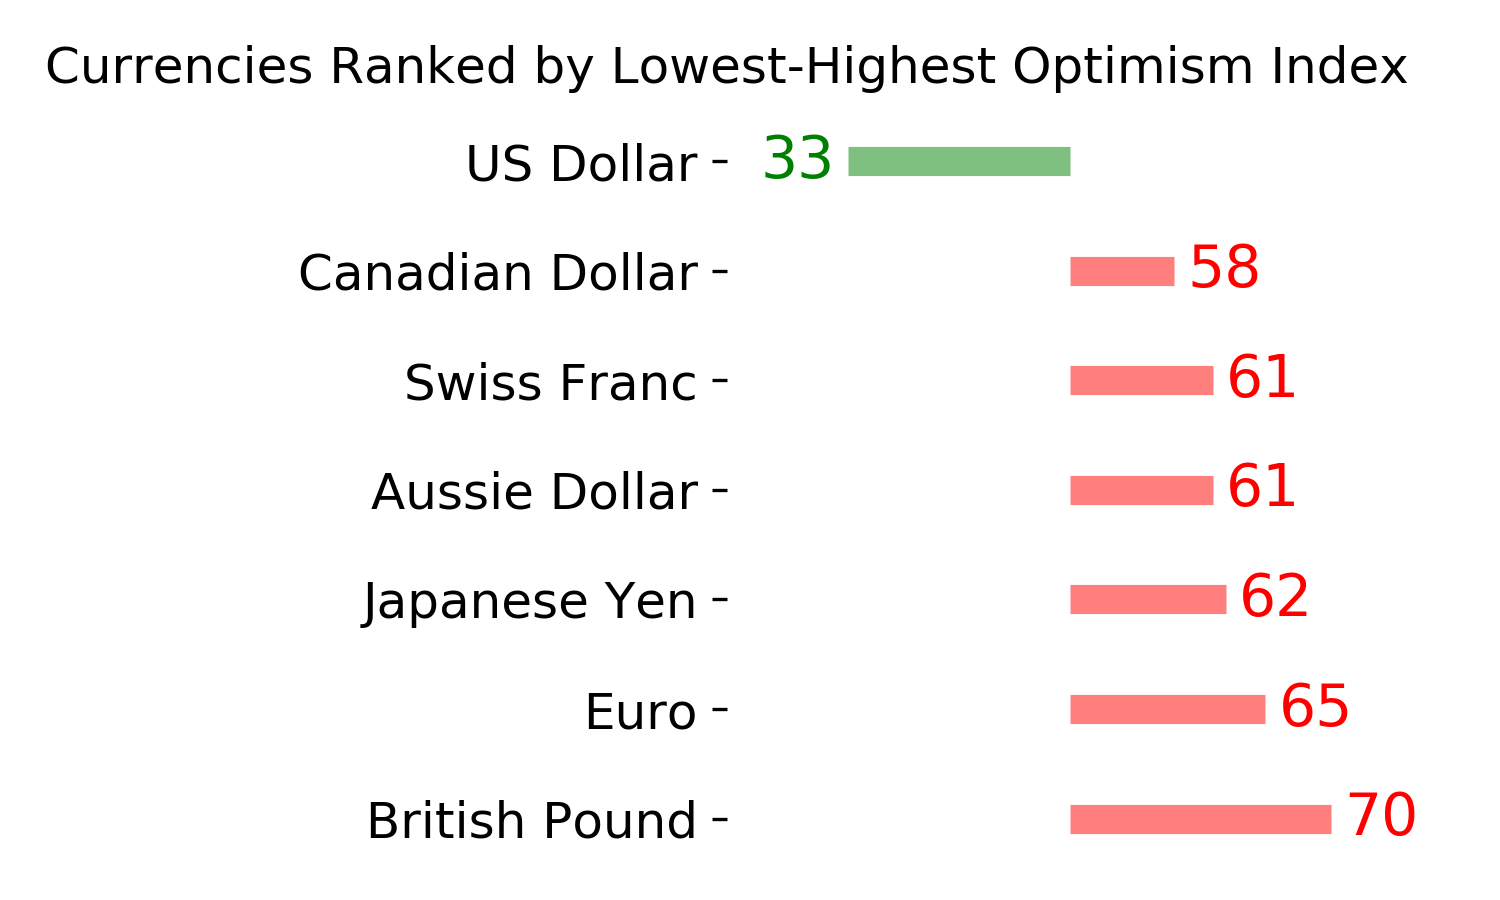
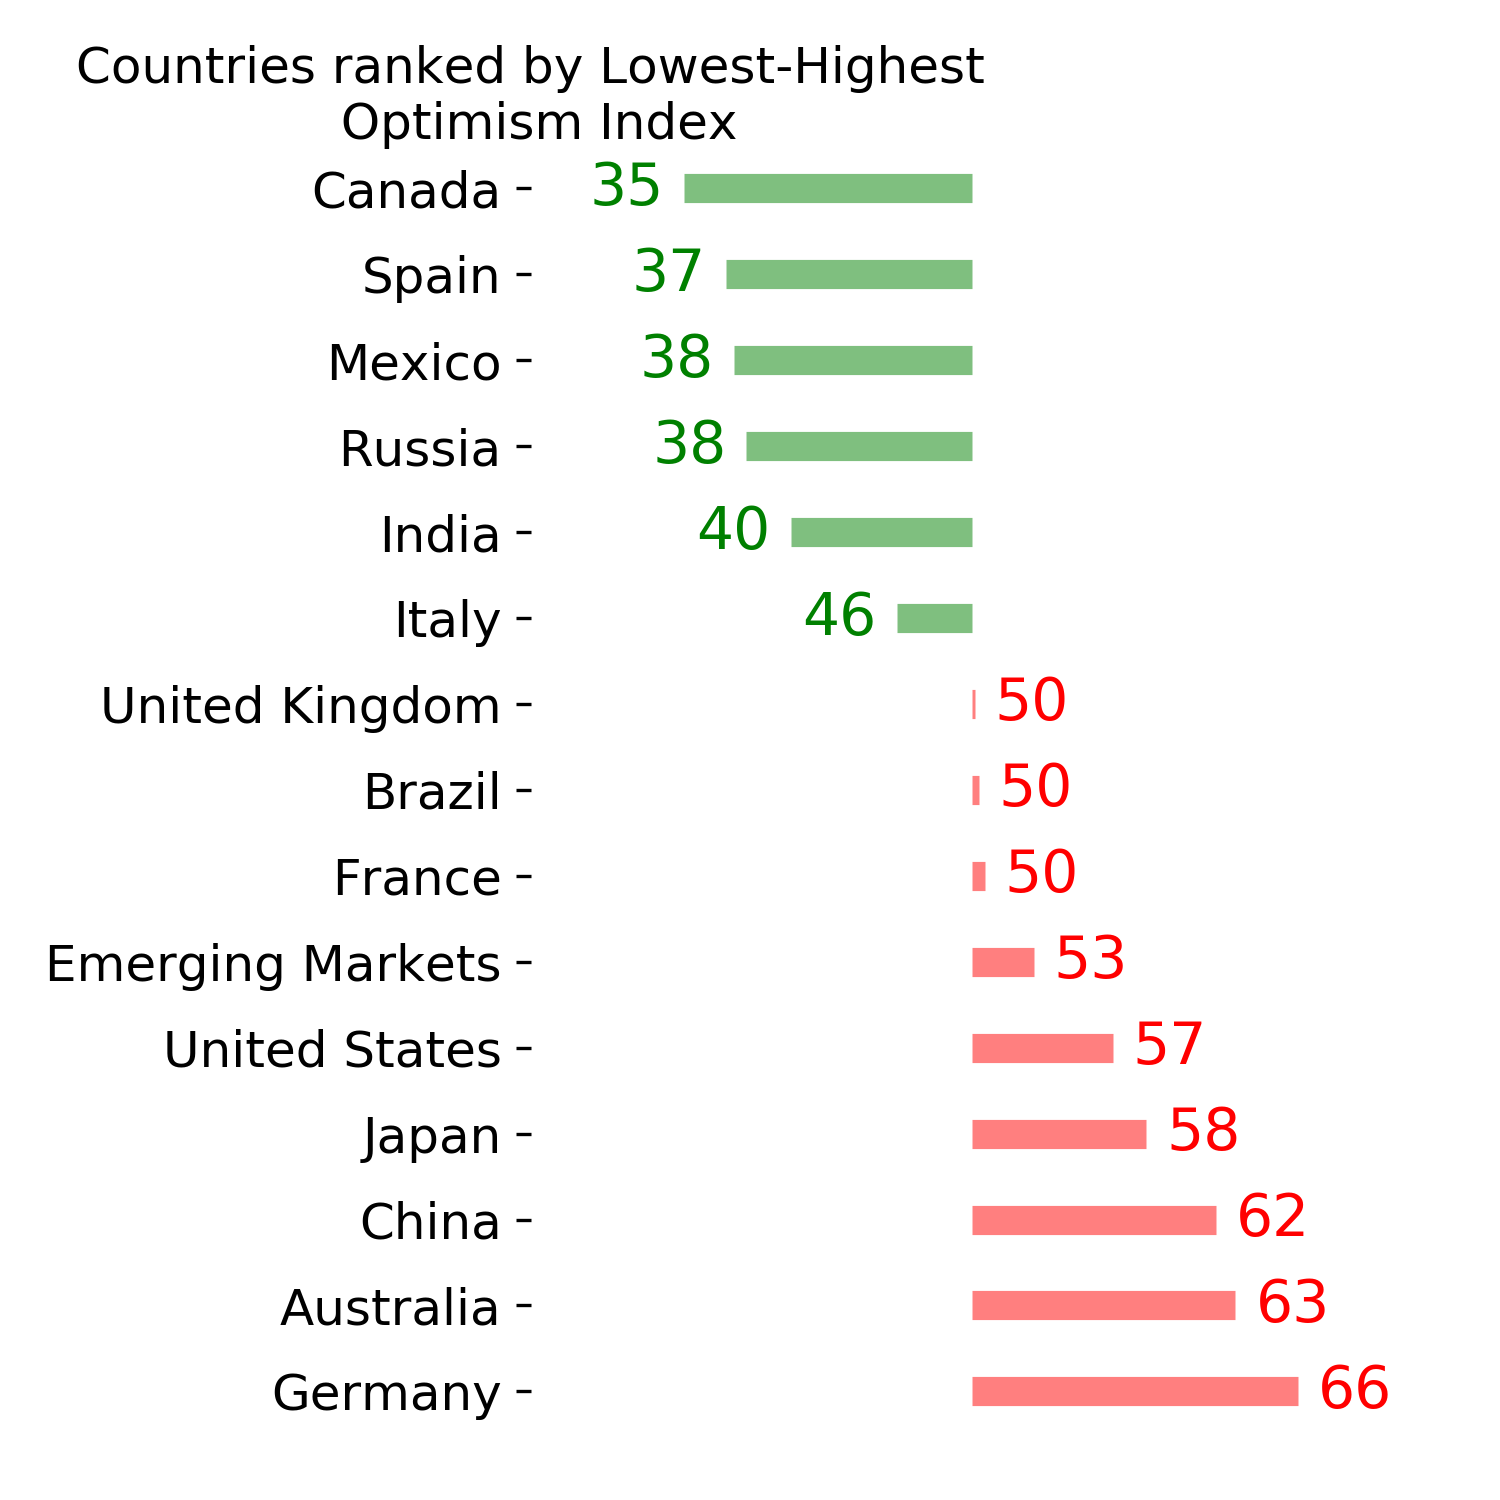
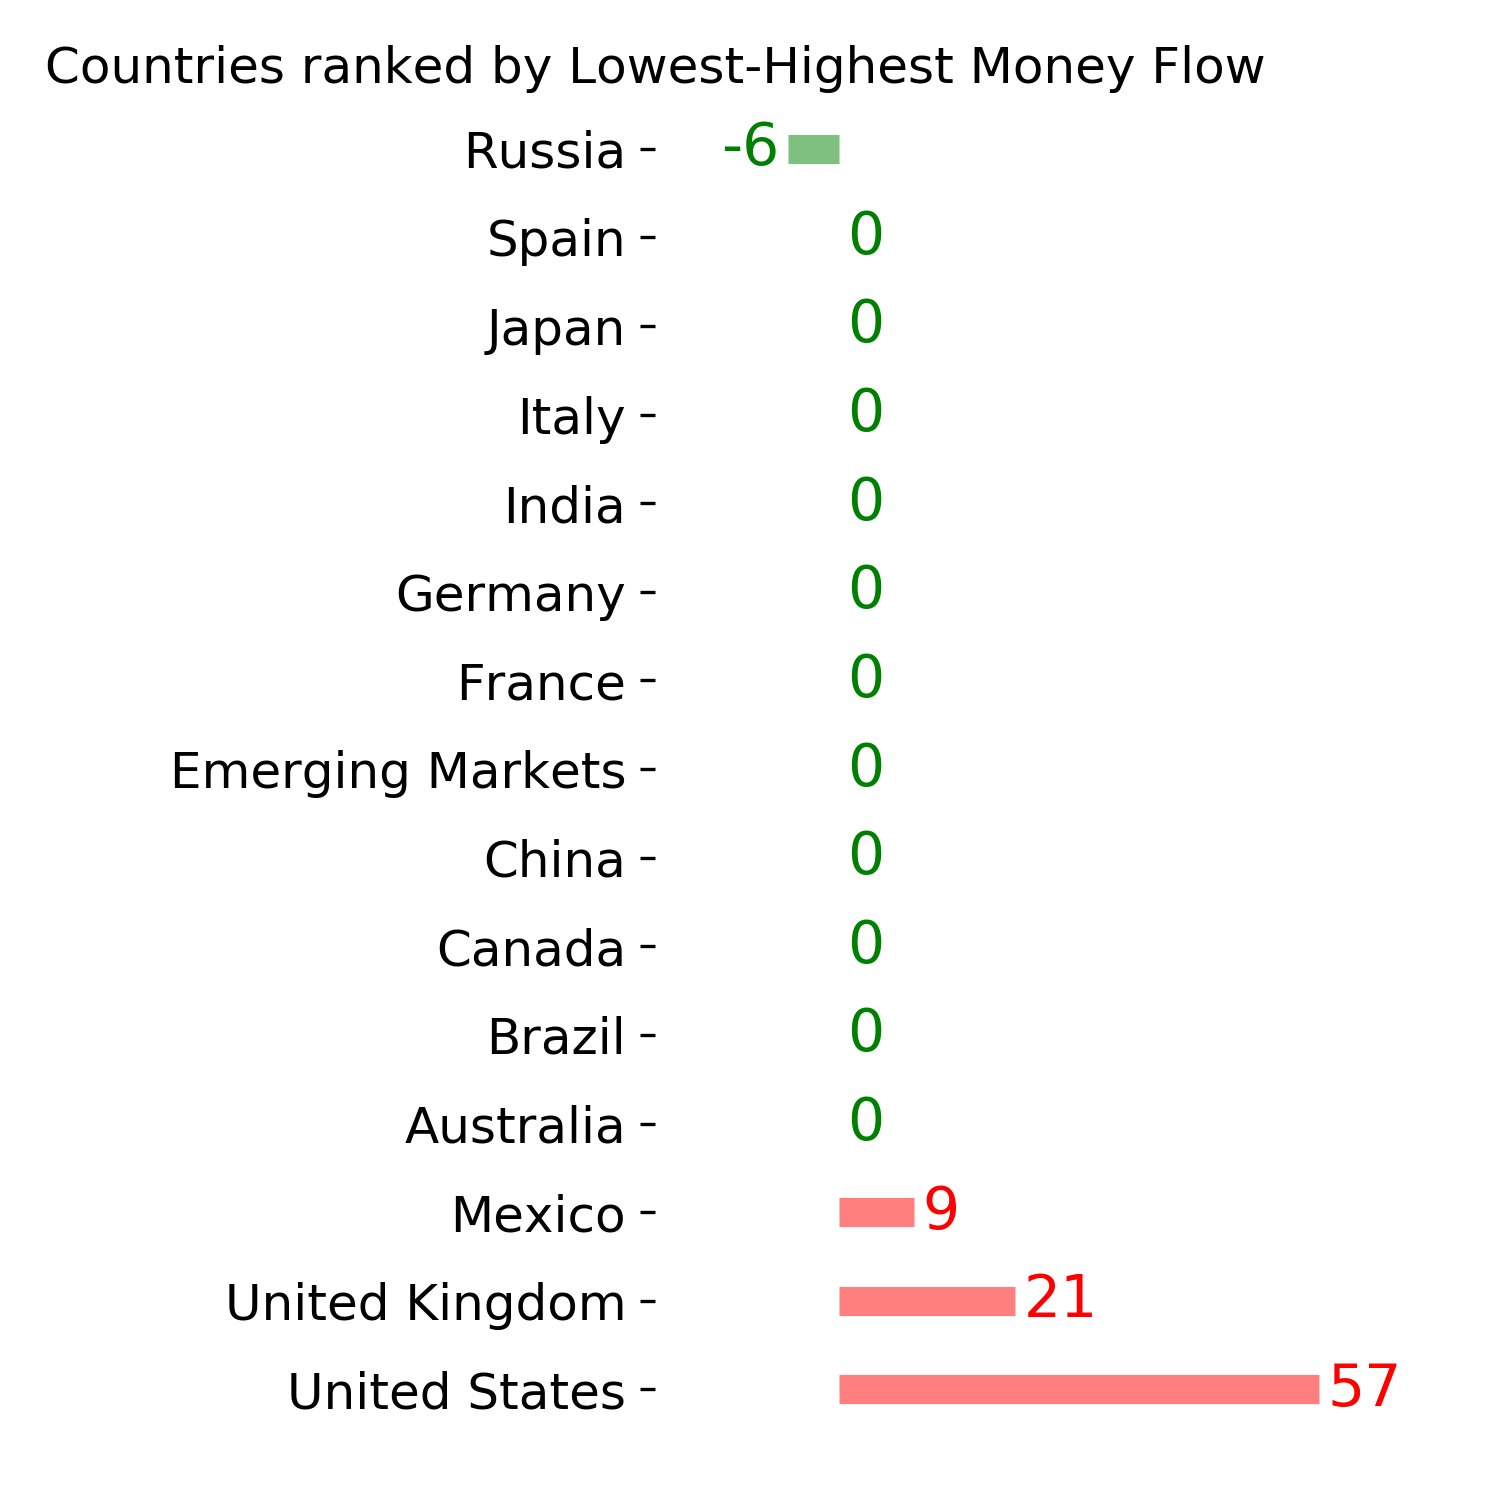
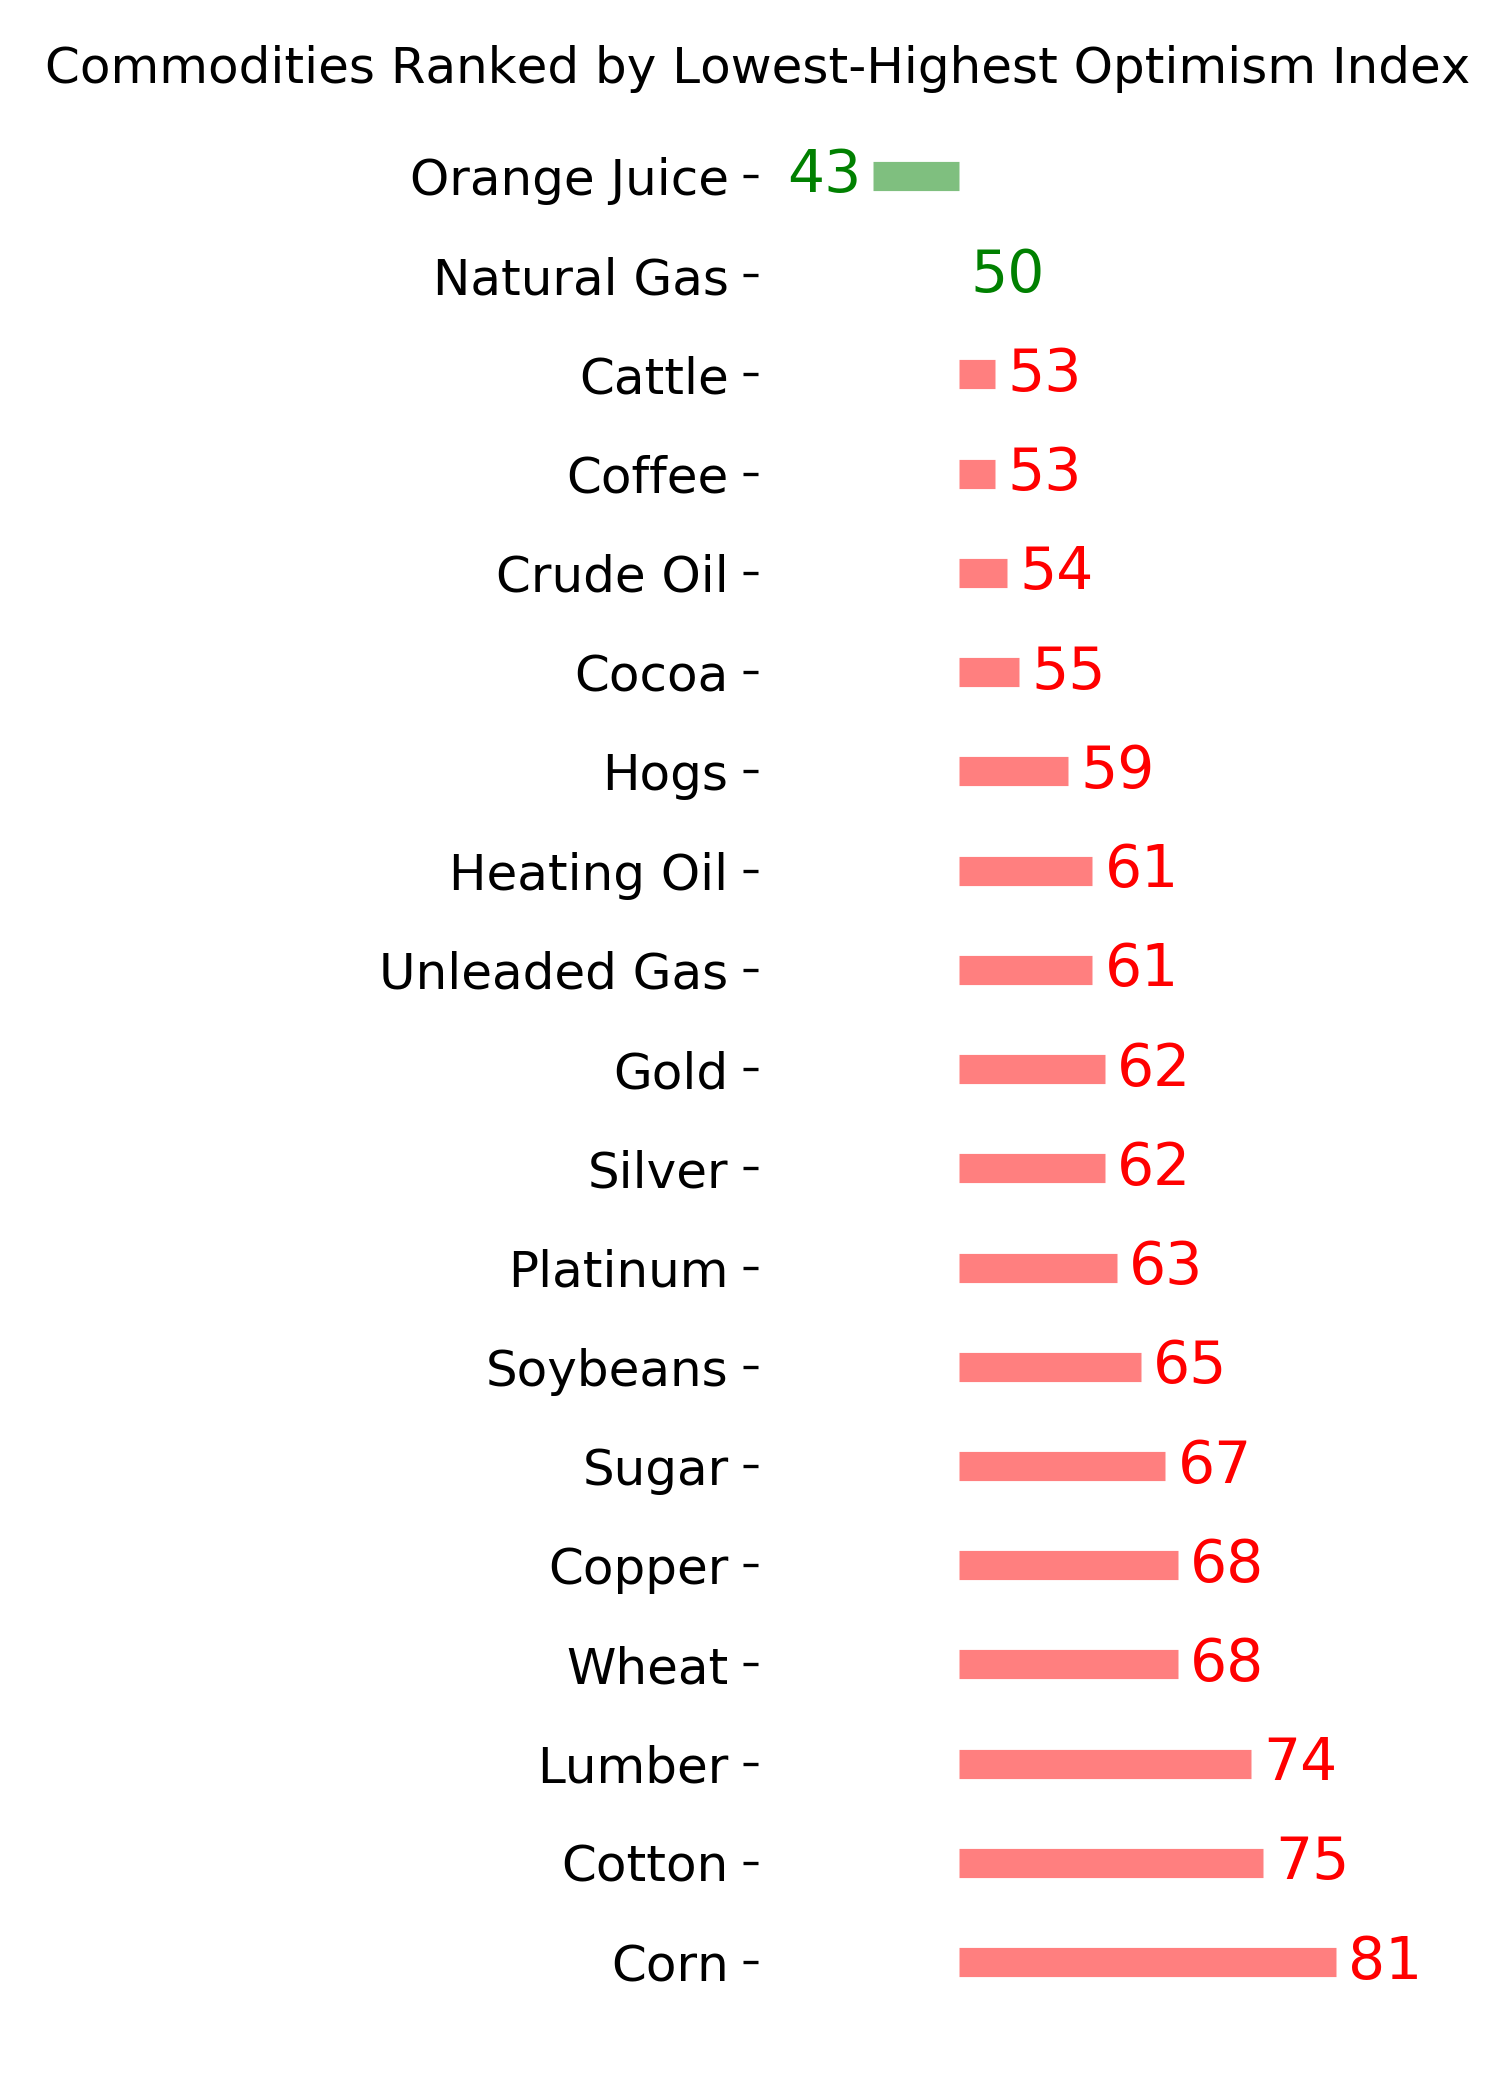
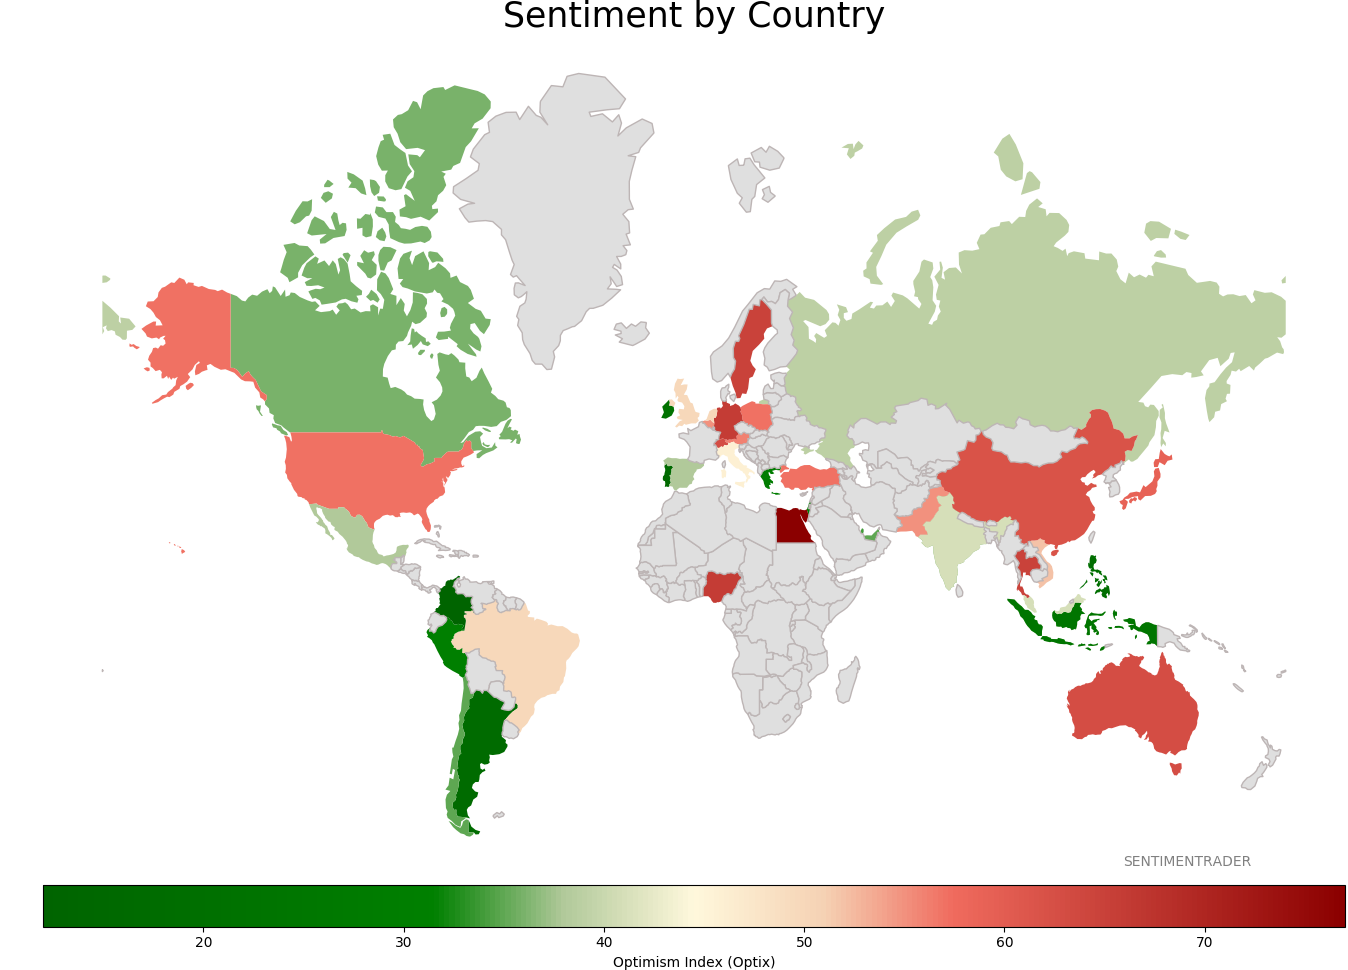
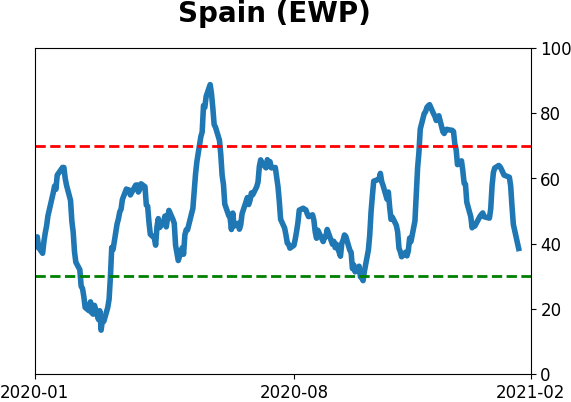
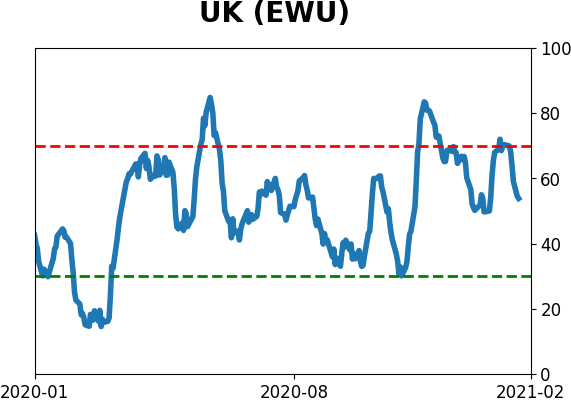
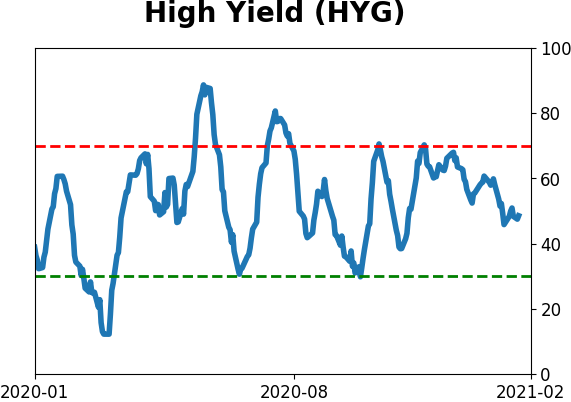
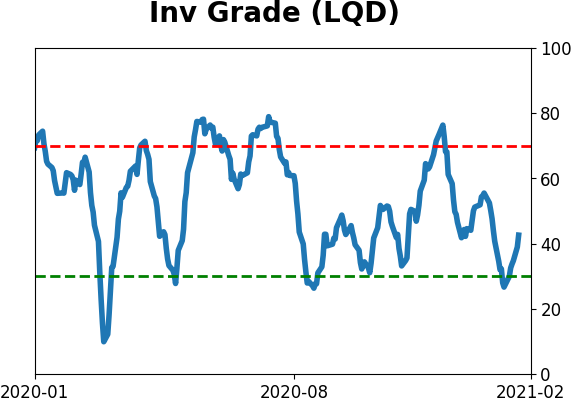
Sentiment Around The World
Optimism Index Thumbnails
|
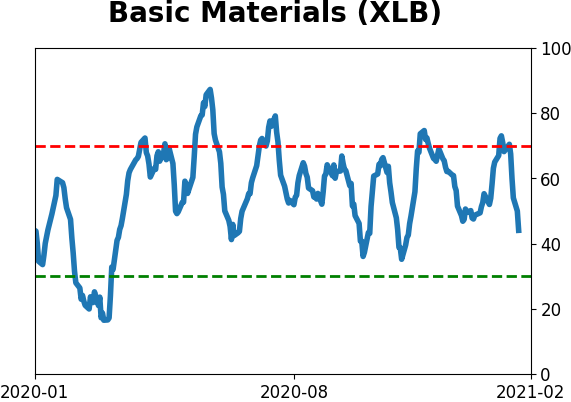
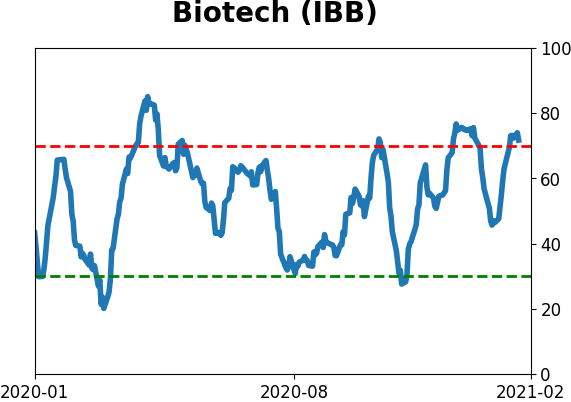
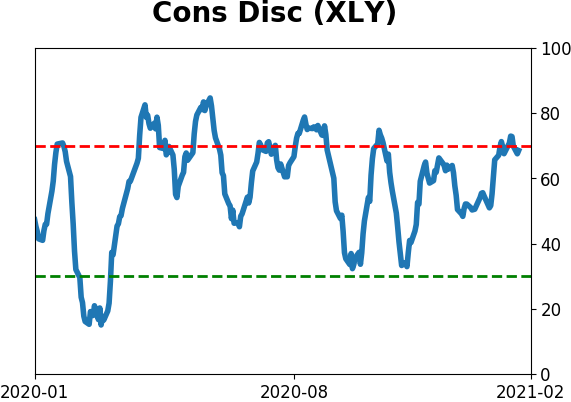
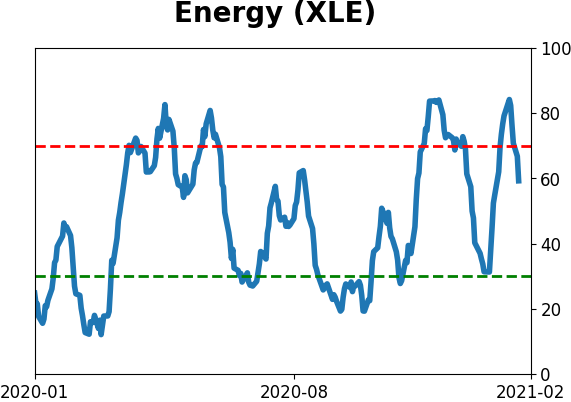
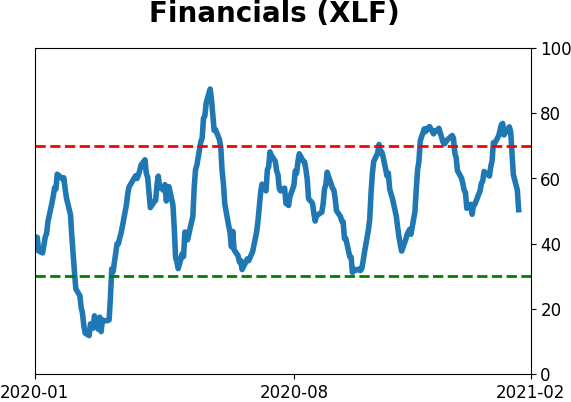
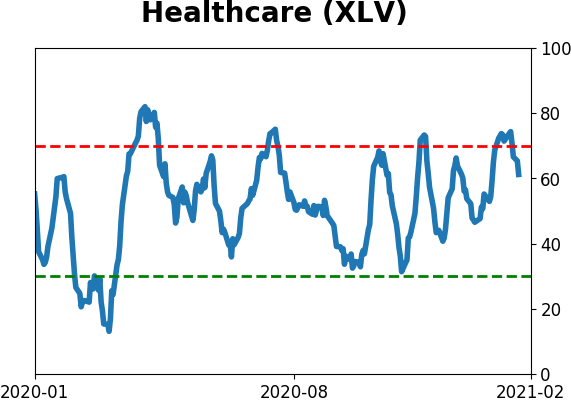
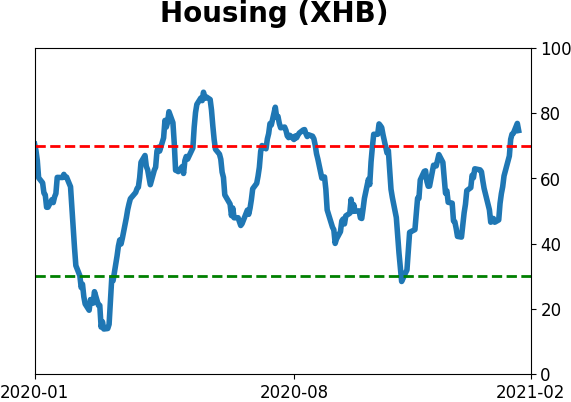
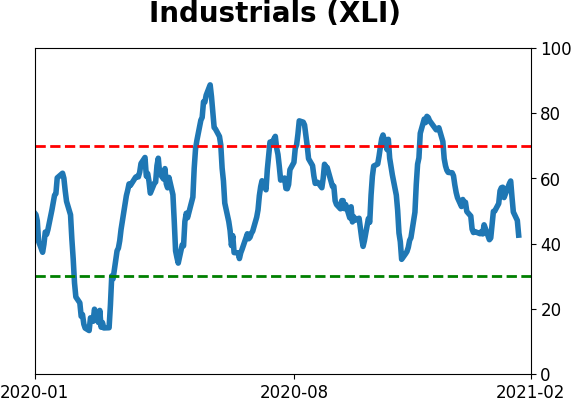
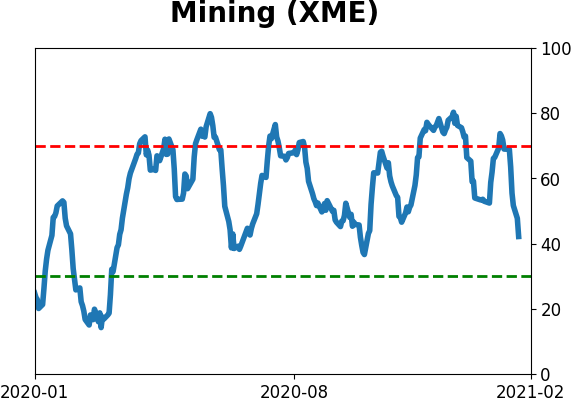
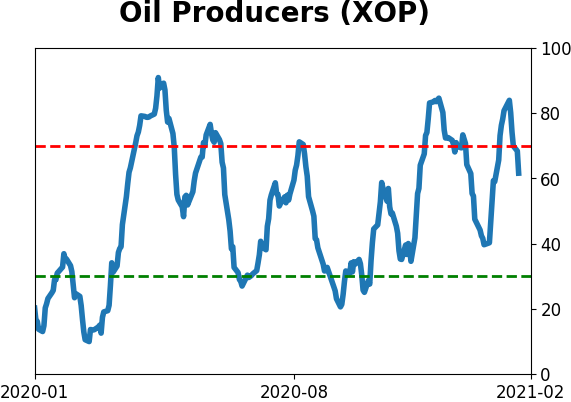
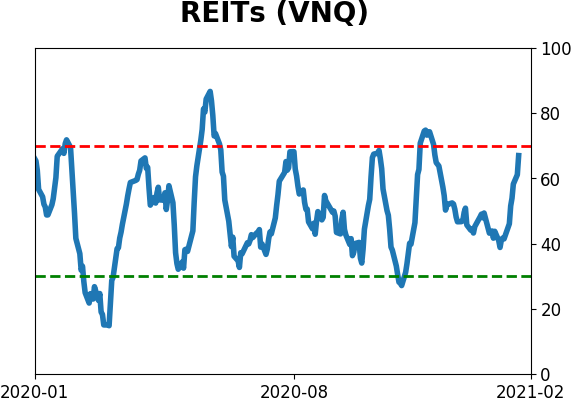
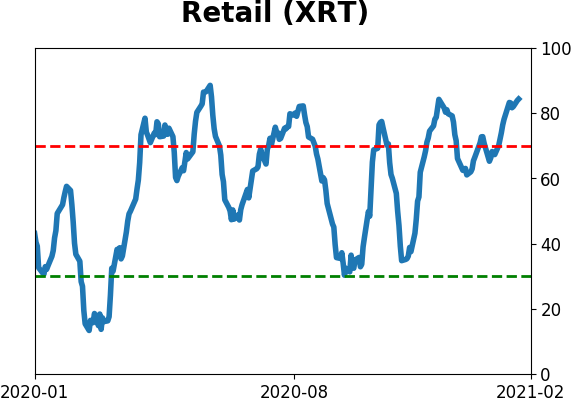
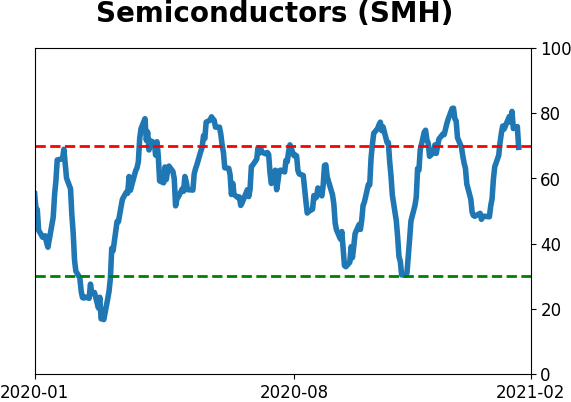
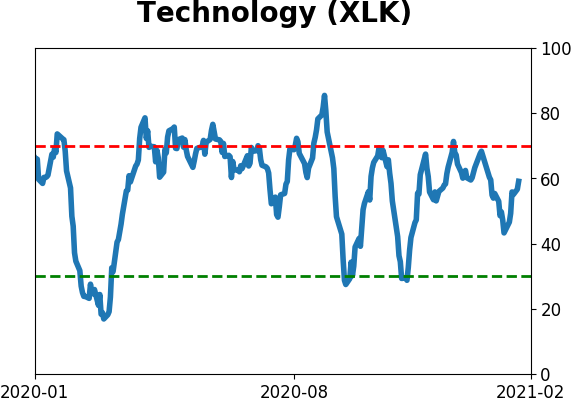
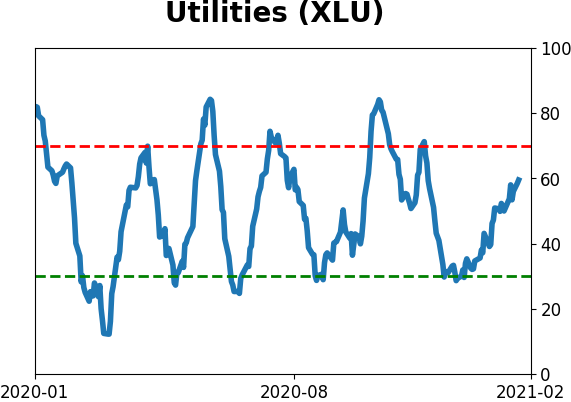
Sector ETF's - 10-Day Moving Average
|
|
|
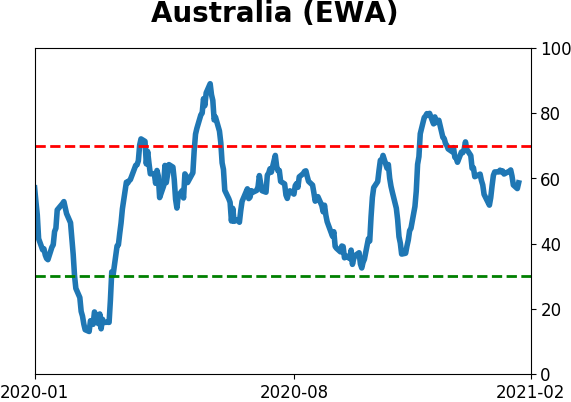
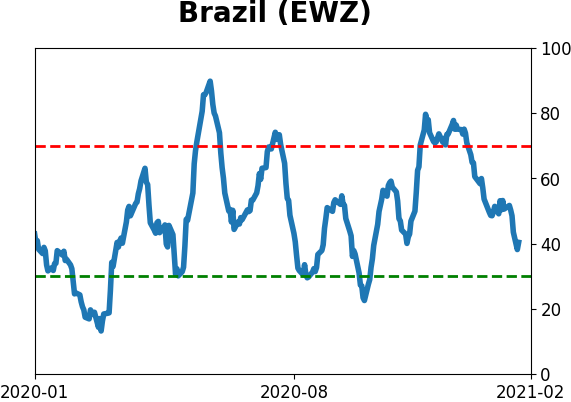
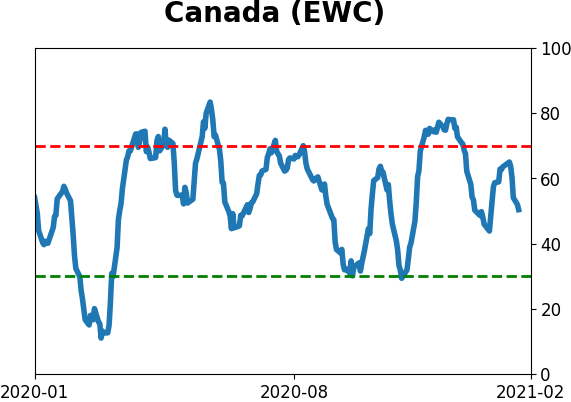
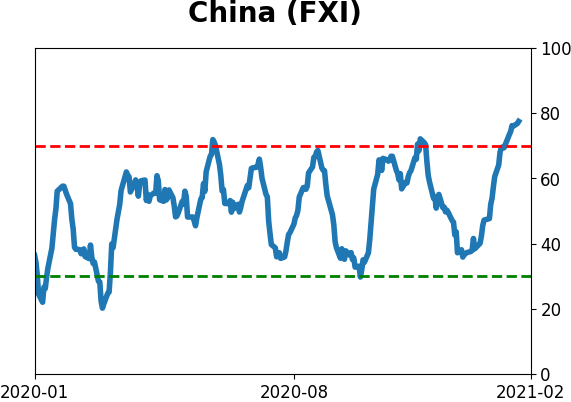
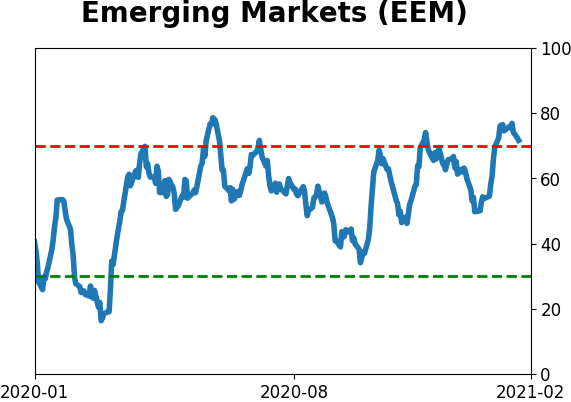
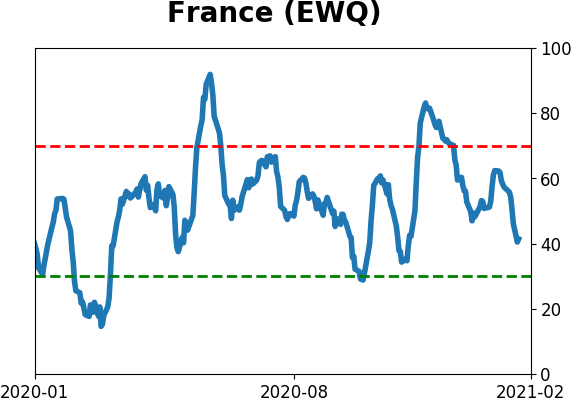
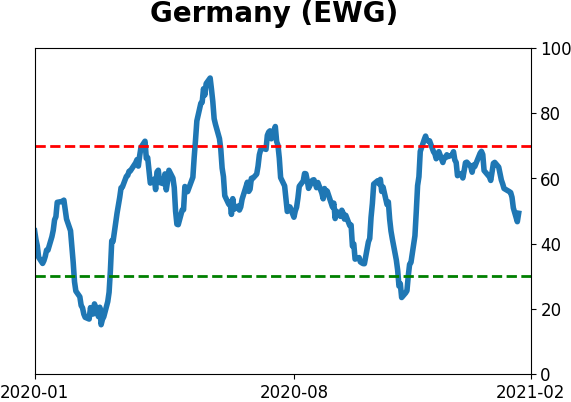
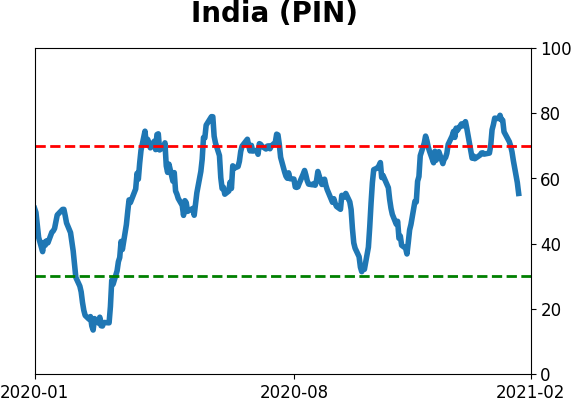
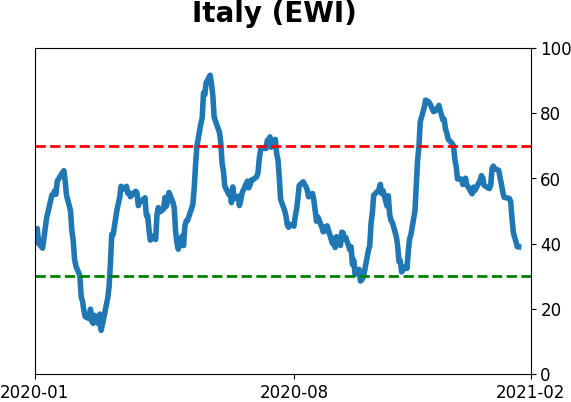
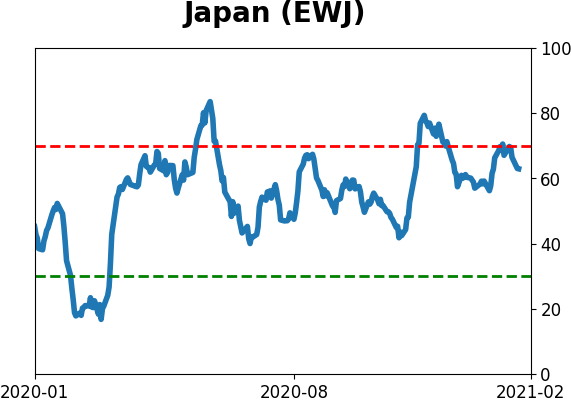
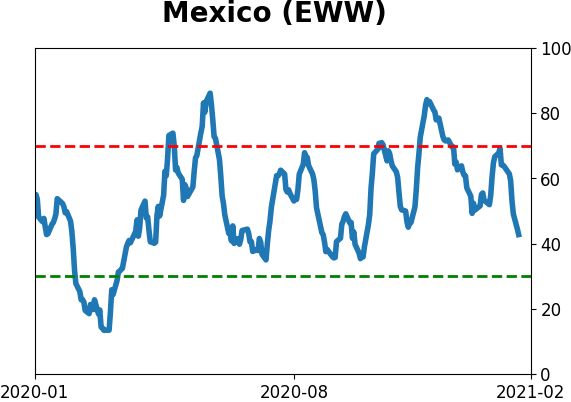
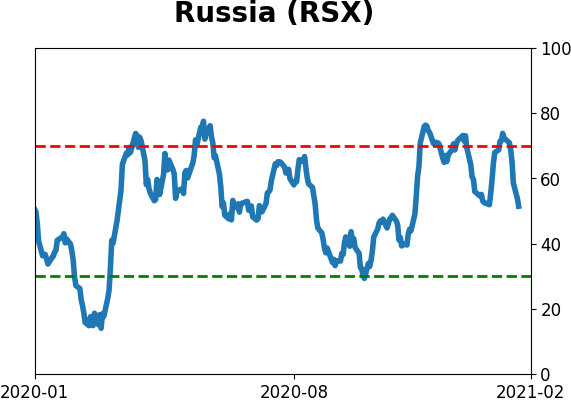
Country ETF's - 10-Day Moving Average
|
|
|
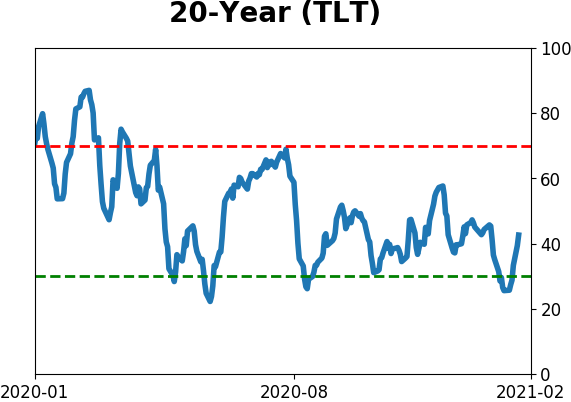
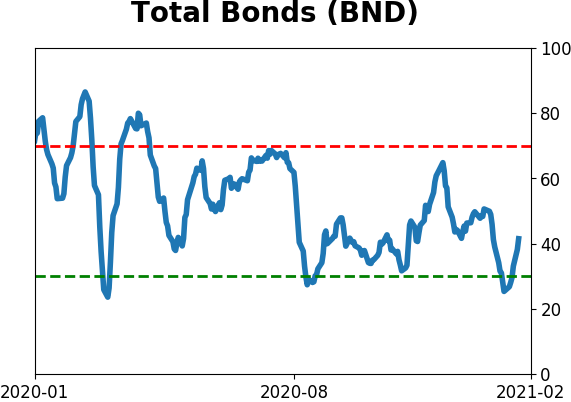
Bond ETF's - 10-Day Moving Average
|
|
|
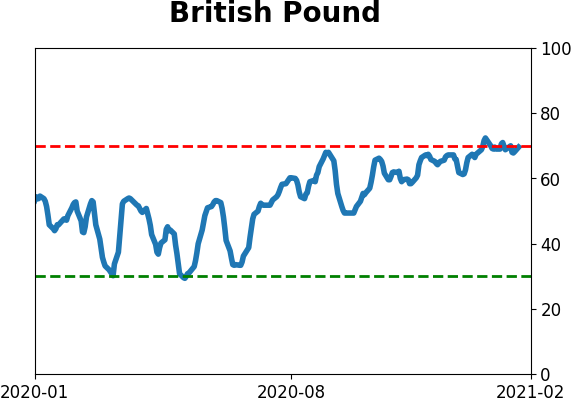
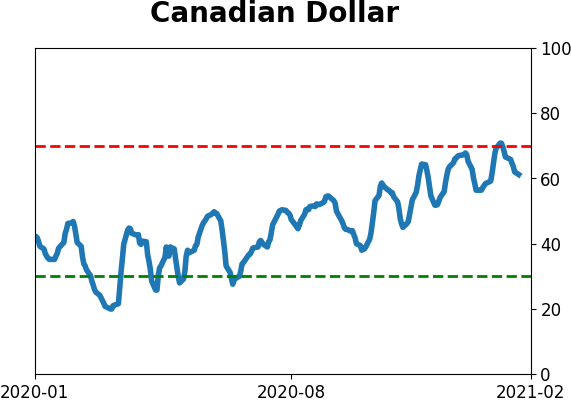
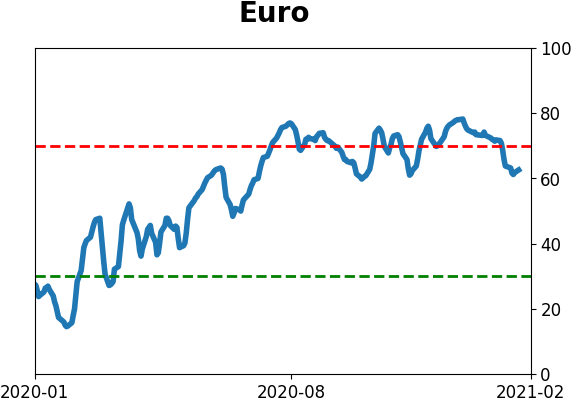
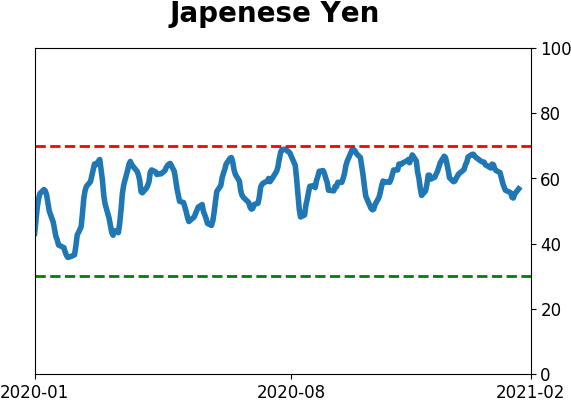
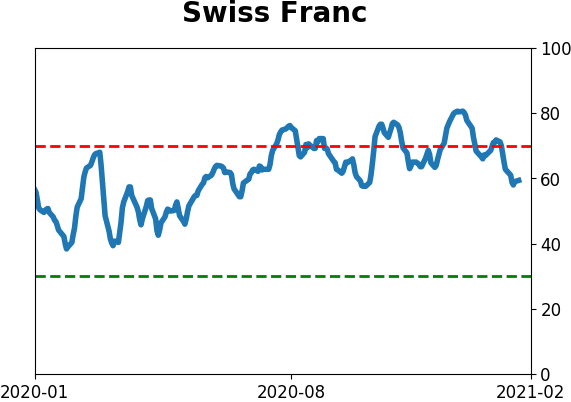
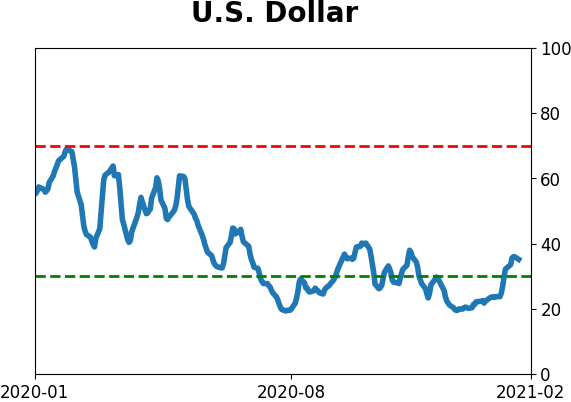
Currency ETF's - 5-Day Moving Average
|
|
|
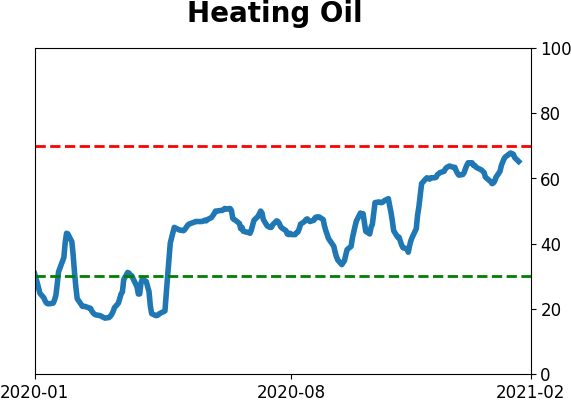
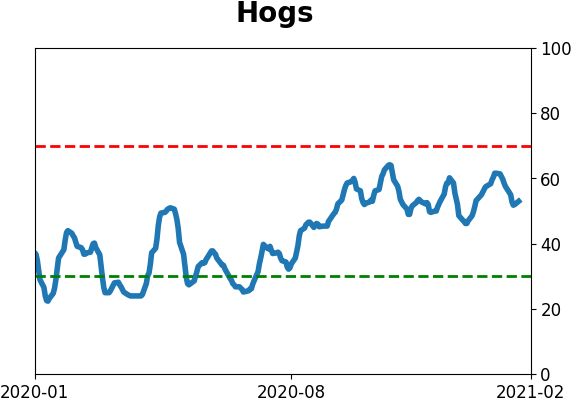
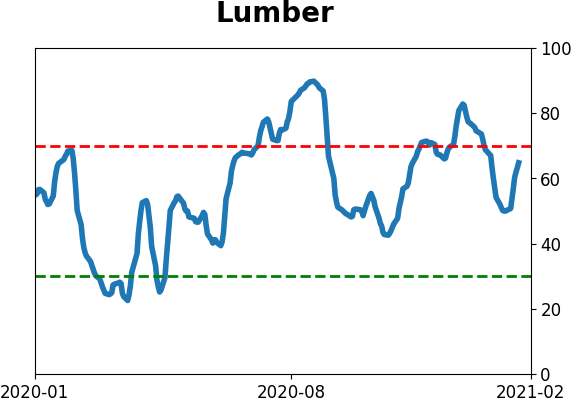
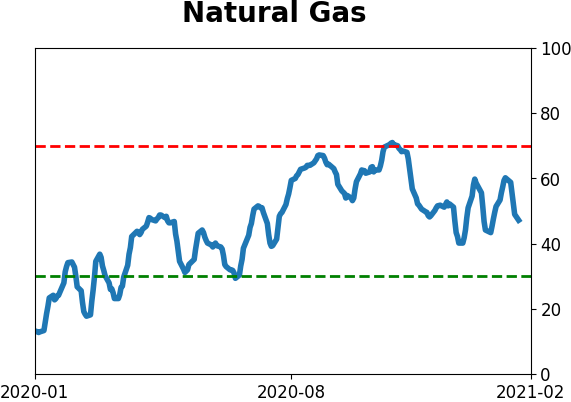
Commodity ETF's - 5-Day Moving Average
|
|