Headlines
|
|
Weekly Wrap for Jan 21 - Risk-off sentiment abounds and trends are failing across the board:
This week, we saw a peak in technical warning signs on stocks. There has been continued deterioration under the surface, and investors are showing risk-off behavior. The Nasdaq Composite lost a couple of its positive long-term trends, while negative options bets on Energy stocks are reversing.
The latest Commitments of Traders report was released, covering positions through Tuesday: The 3-Year Min/Max Screen shows that "smart money" commercial hedgers established only one new multi-year extreme this week, in eurodollars. Their net long position now accounts for more than 20% of open interest, among the largest positions in 20 years. Extremes in hedger positions in eurodollars have a decent record when compared to 10-year Treasuries and gold, suggesting both could rise off this extreme. Hedgers continue to hold a large net long position in 10-year Treasuries though they reduced it a bit this week. They didn't buy the dip in stocks, adding to massive net shorts in the S&P 500 and other major equity index futures where they once again are holding about $100 billion worth of net short positions. One of the few markets where they have held - and continue to hold - a massive net long position is palladium.
|
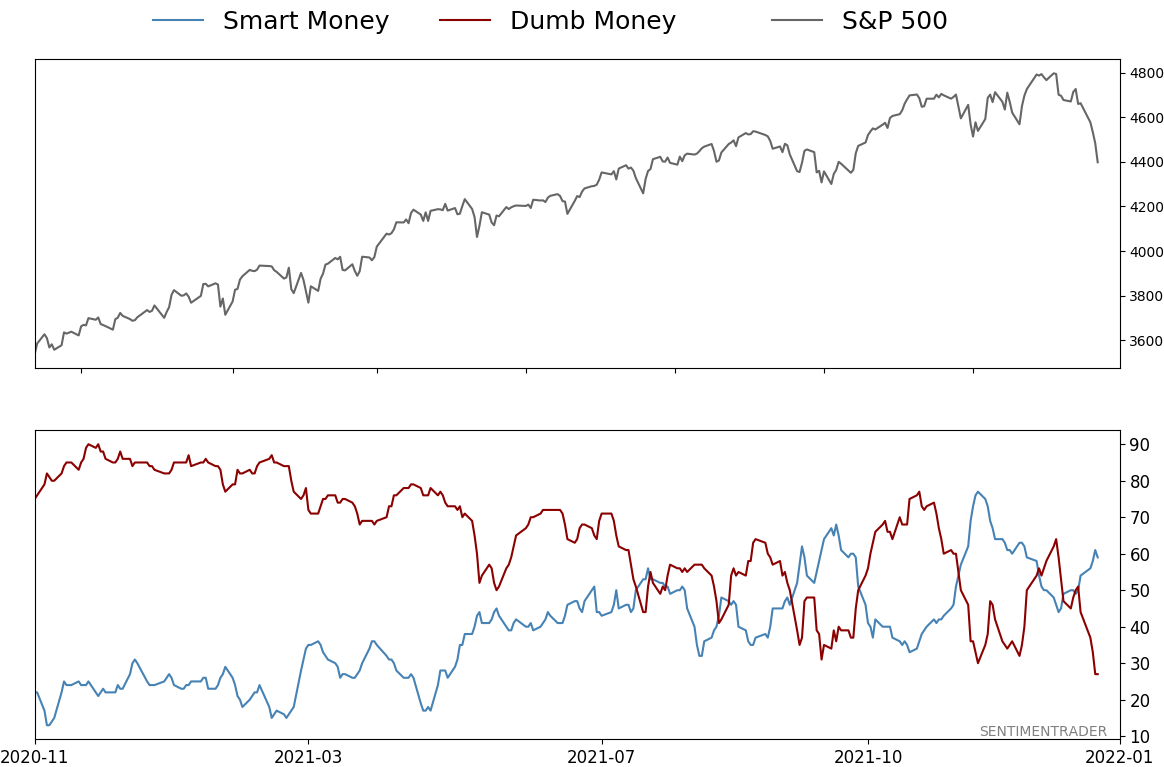
Smart / Dumb Money Confidence
|
Smart Money Confidence: 59%
Dumb Money Confidence: 27%
|
|
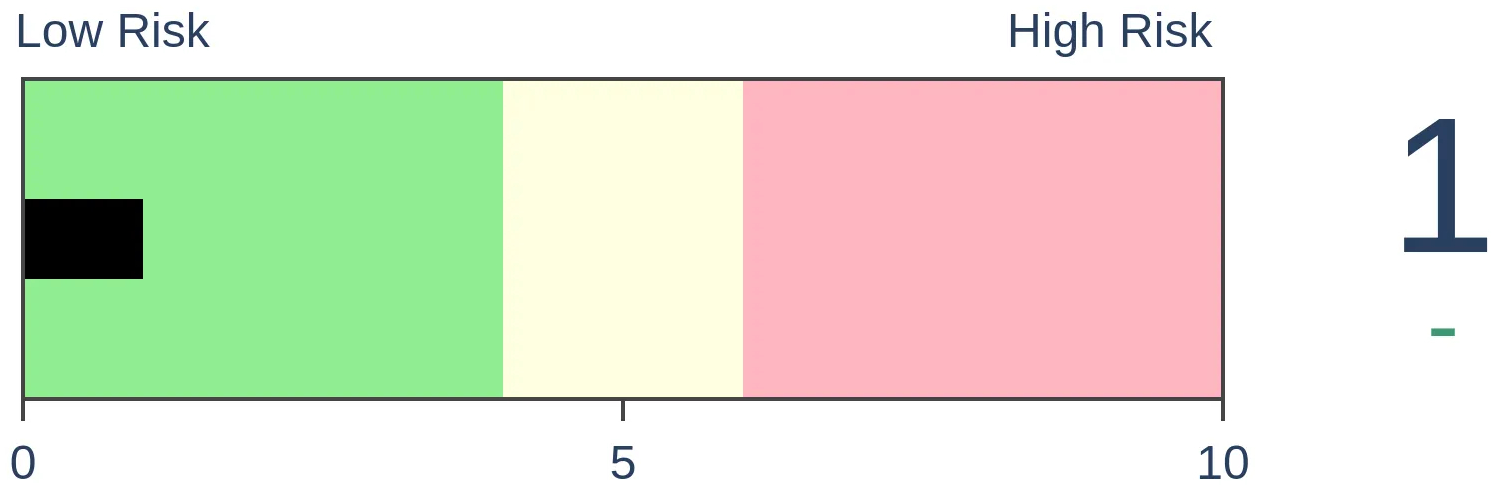
Risk Levels
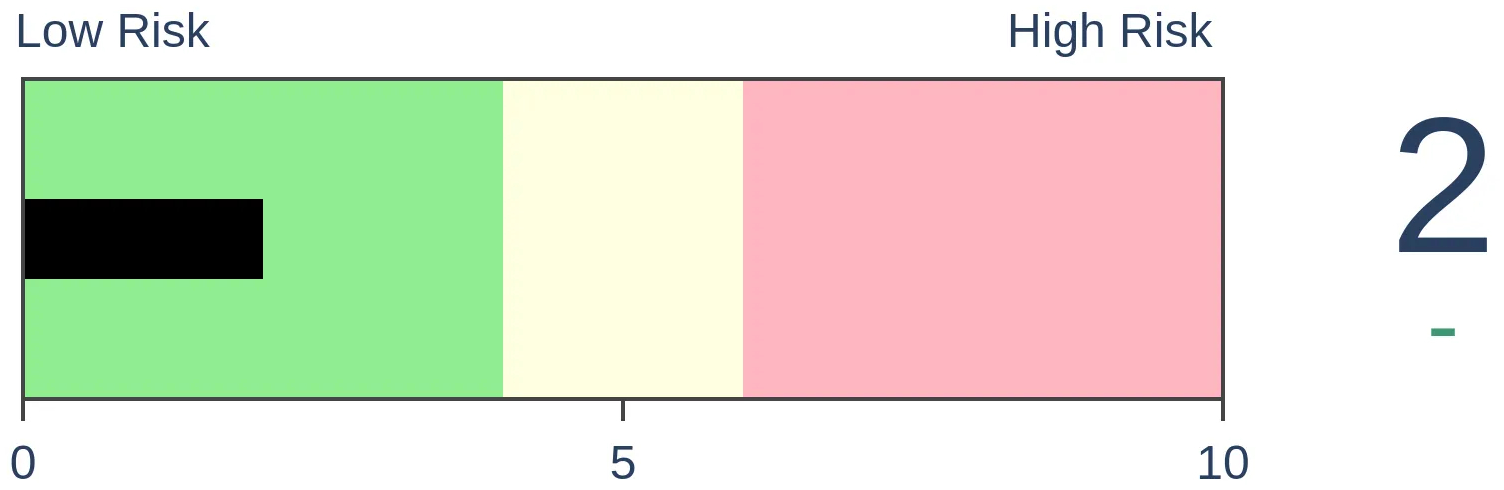
Stocks Short-Term
|
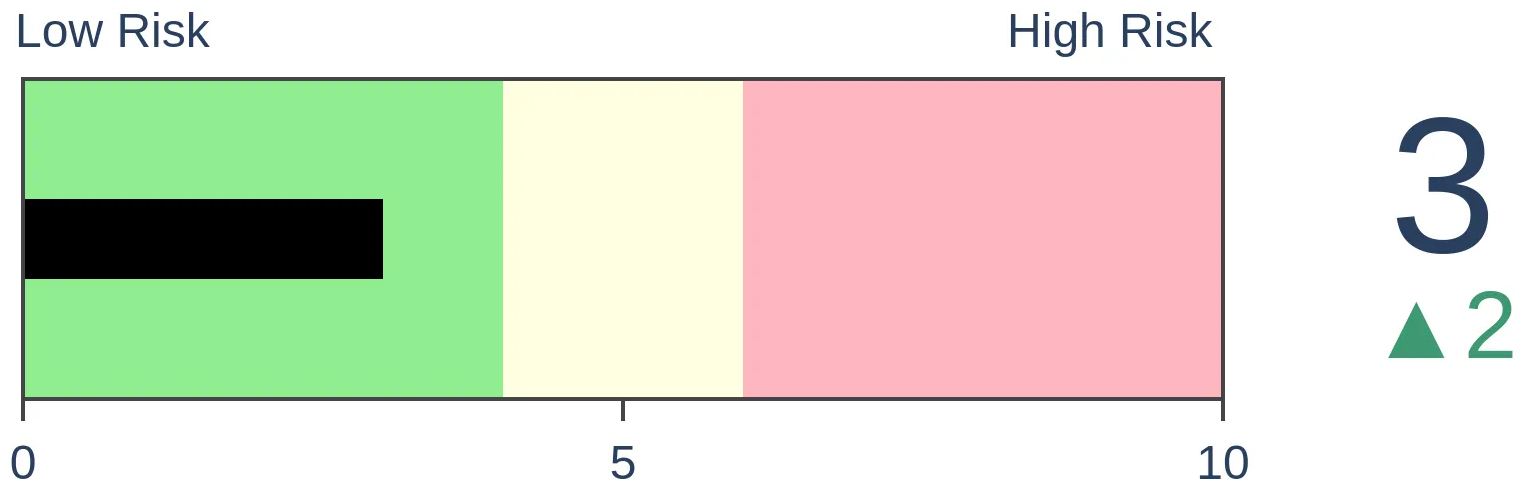
Stocks Medium-Term
|
|
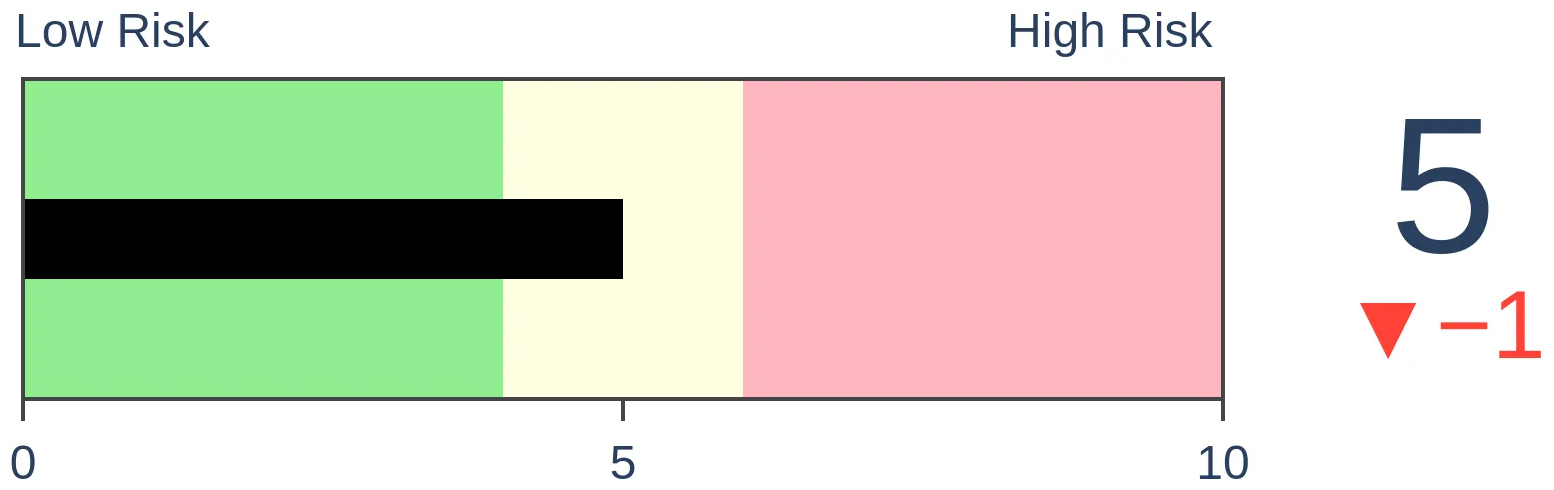
Bonds
|
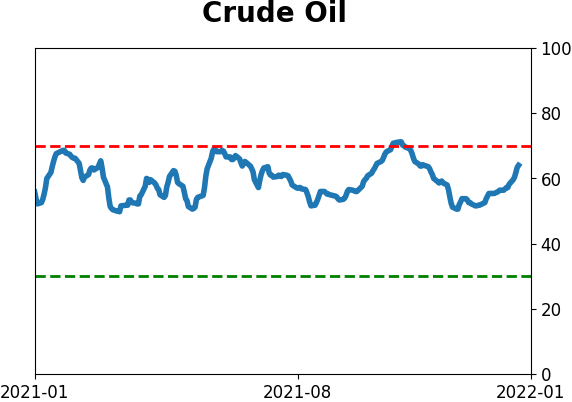
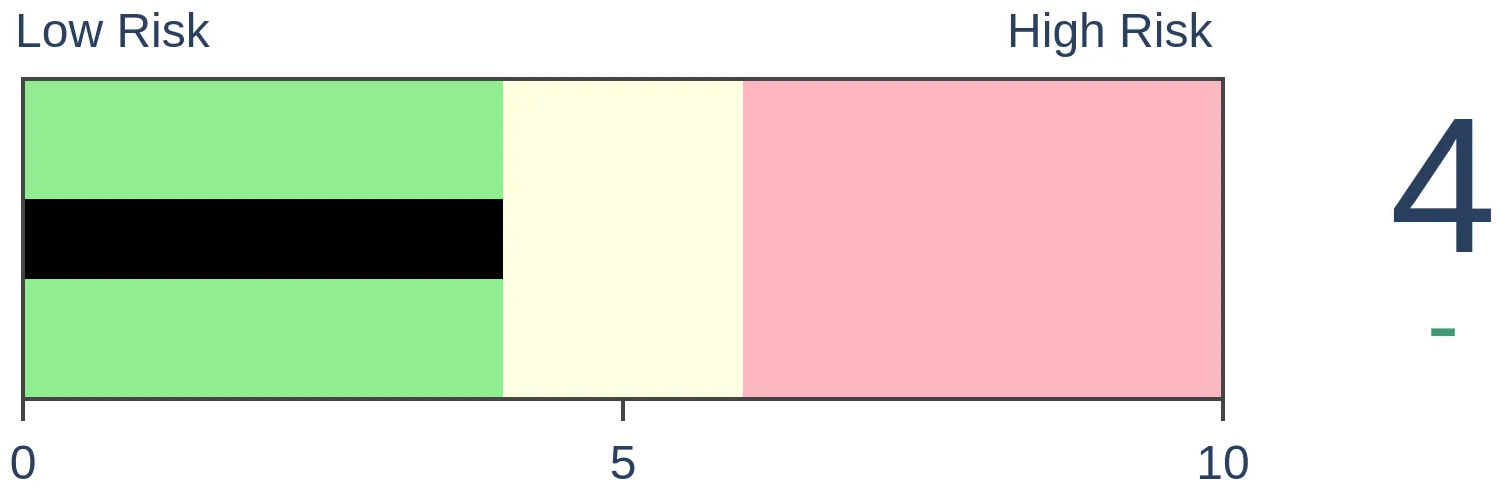
Crude Oil
|
|
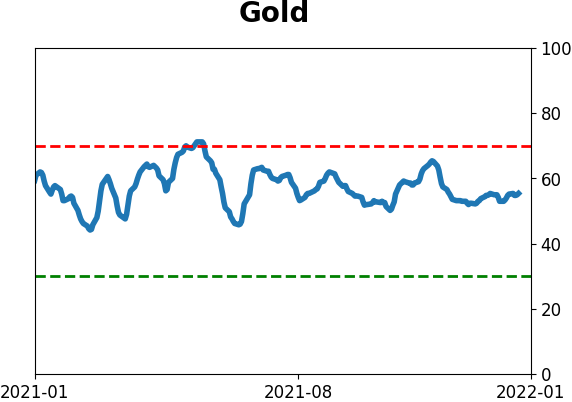
Gold
|
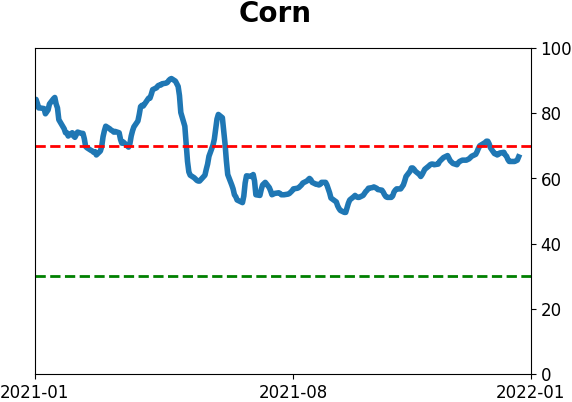
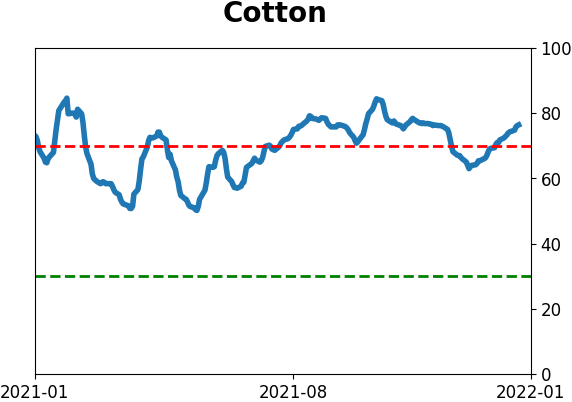
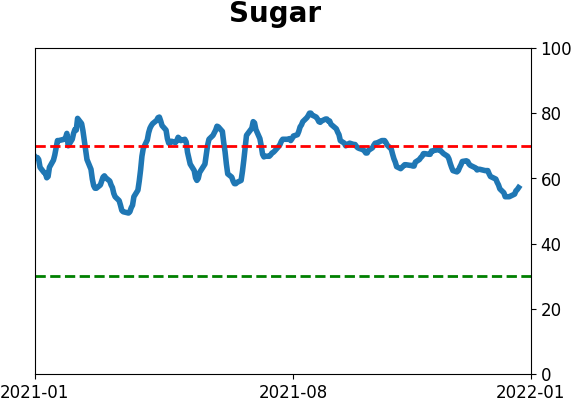
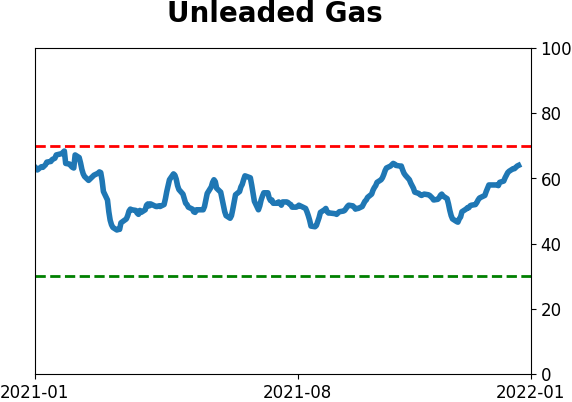
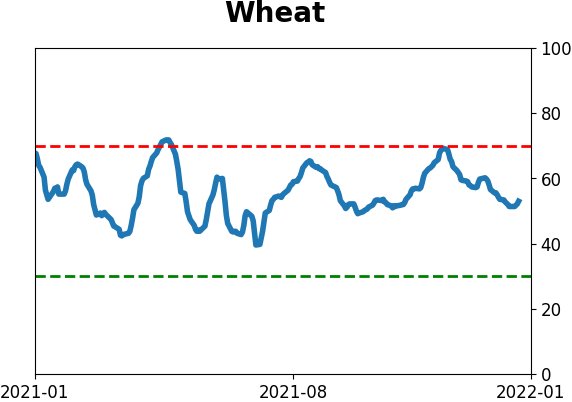
Agriculture

|
|
Research
By Jason Goepfert
BOTTOM LINE
This week, we saw a peak in technical warning signs on stocks. There has been continued deterioration under the surface, and investors are showing risk-off behavior. The Nasdaq Composite lost a couple of its positive long-term trends, while negative options bets on Energy stocks are reversing.
FORECAST / TIMEFRAME
None
|
Key points:
- There has been a cluster of technical warning signs over the past 6 months
- The market environment for stocks has deteriorated, and investors are showing risk-off behavior
- A market regime indicator has flipped negative for the first time since February 2020
- The Nasdaq Composite has lost a couple of its positive long-term trends
- Bearish options bets on Energy are reversing
- There is a seasonality and sentiment setup in semiconductors
A cluster of technical warnings
Over the past six months, there have been many days when indexes like the S&P 500 or Nasdaq Composite have reached a 52-week high. However, within mere days, more stocks and other securities were trading at 52-week lows than 52-week highs.
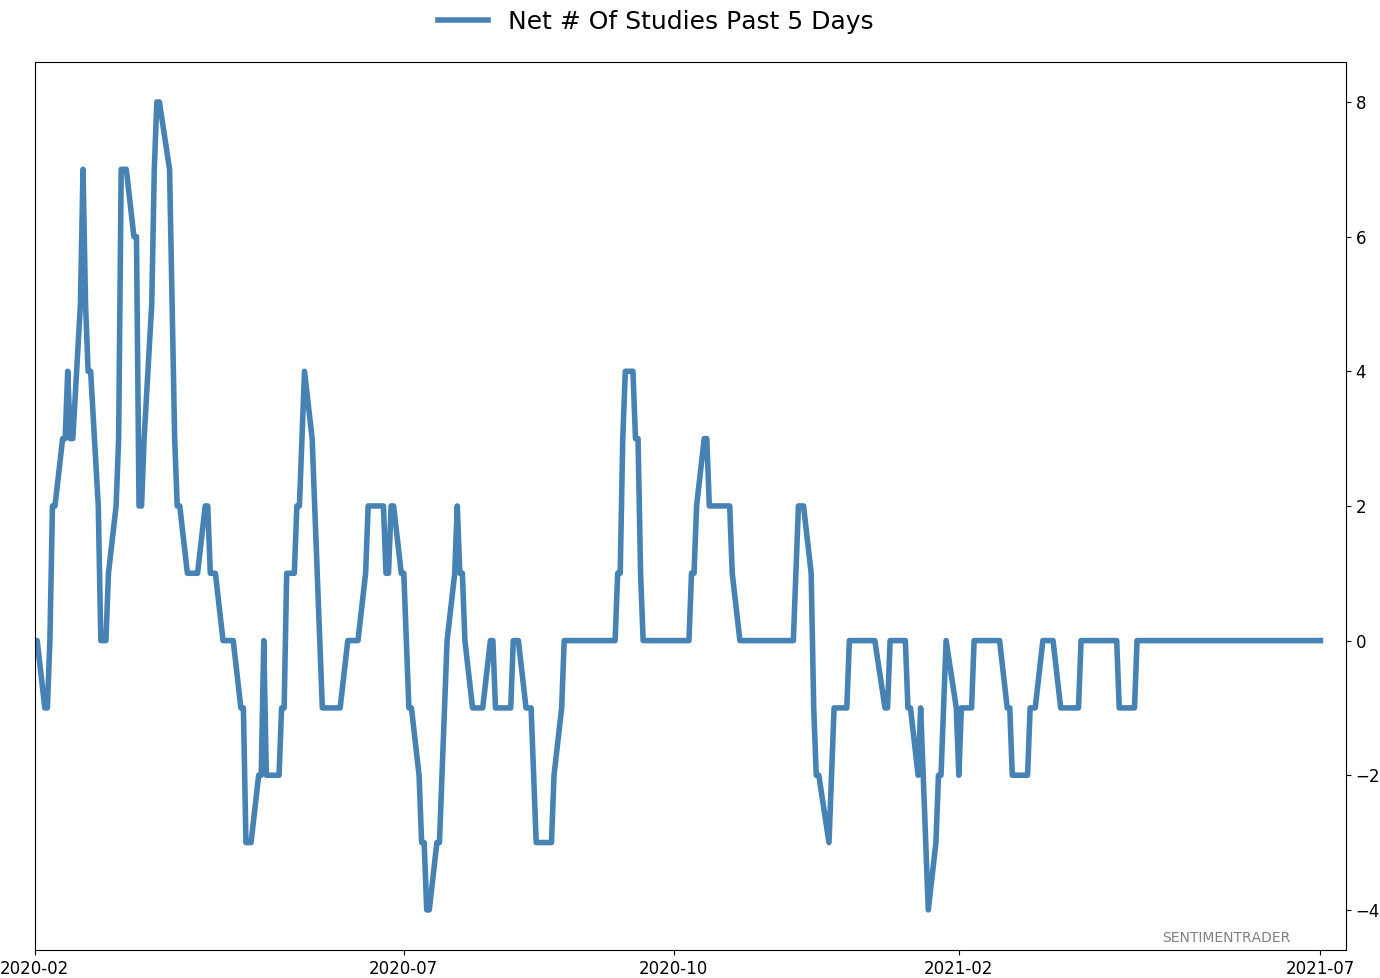
That type of behavior has triggered a cluster of Titanic Syndrome warnings for securities on the NYSE and Nasdaq.
When we combine the signals on both exchanges and tally them up over the past 6 months, there have been 34 signals. In other words, nearly 30% of all days since July have seen a Titanic Syndrome warning on either the NYSE or Nasdaq exchanges. This is the 3rd-highest reading in almost 40 years, next to 1999-2000 and 2007. Early 2015 is the only other environment that comes close.
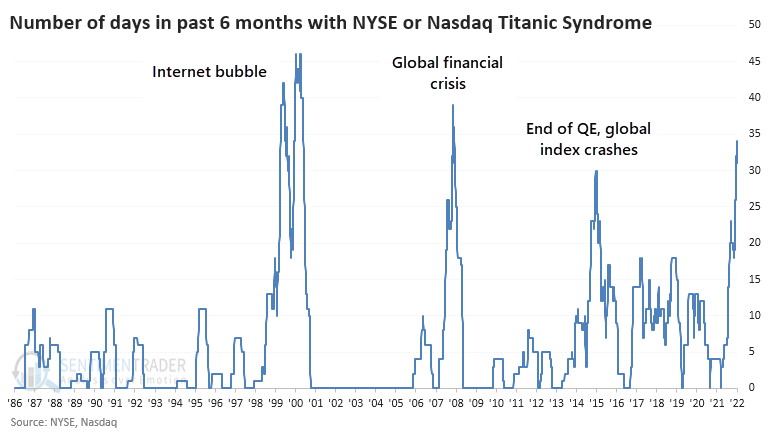
The 6-month rolling sum has just started to curl down, suggesting it may have peaked. After other peaks, the S&P 500 showed minimal upside.
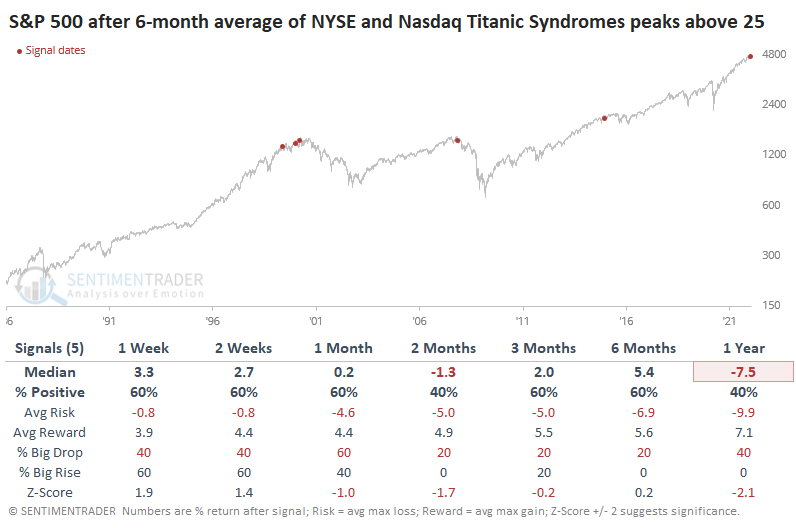
Not one of the signals showed more than a 10% gain at any point within the next six months. Granted, the sample size is tiny. After the same signals, returns in the Nasdaq Composite weren't exactly inspiring, either. While it managed some double-digit gains, its returns were highly volatile.
Rallies are being met with less enthusiasm
There have been some worrying signs lately. Rallies are being met with less and less enthusiasm, while declines, even tiny ones, are greeted with high anxiety.
We've seen an extended period now where good news is being met with a collective yawn, or even aggressive selling pressure, while bad news is being exaggerated and extrapolated. In the first week of the New Year, there was a thrust in short-term positive trends in the S&P 500. Instead of generating even more positive momentum as more buyers got sucked in, we've seen almost nothing but selling pressure. This runs counter to most of the other signals.
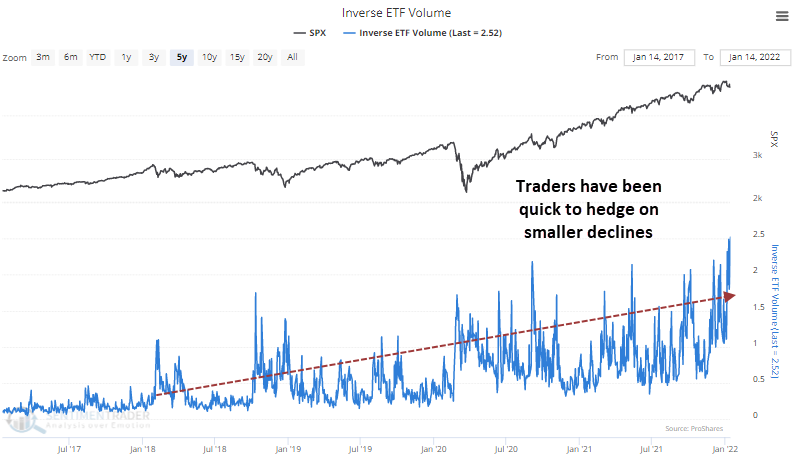
The anxiety has reached a point where inverse ETF volume, funds that profit when stocks decline, reached a record high last Friday. The 5-day average is now 20% higher than the previous peak from October 2021. Each successive dip has coincided with higher and higher anxiety. We can blame the new cadre of retail traders, but it's deeper than that.
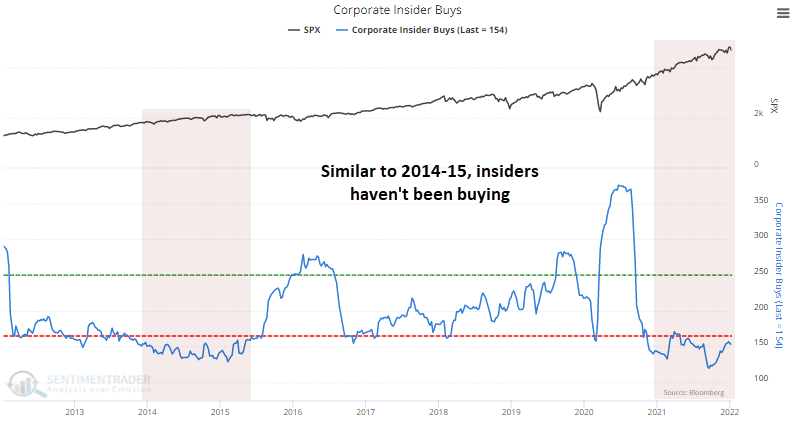
Corporate insiders have not been interested in buying stock in their own companies.
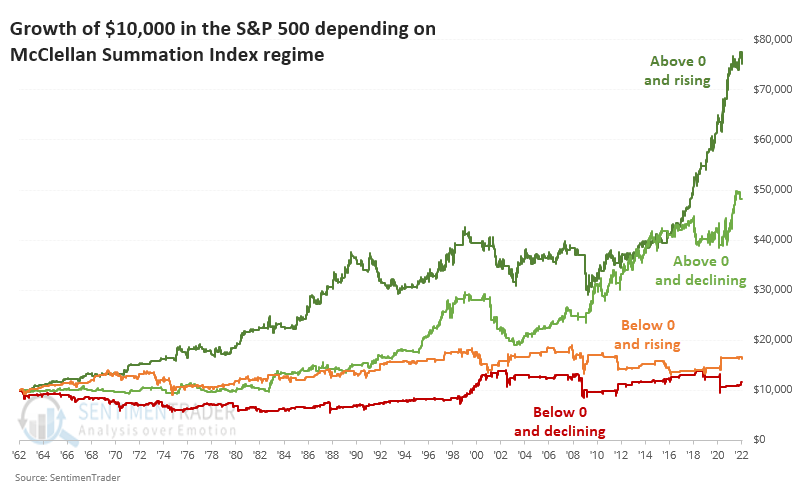
Among other worrying breadth metrics, the long-term McClellan Summation Index briefly turned positive but it was weak. It's already back below zero and declining.
This is the worst possible regime for the indicator. The chart below shows the growth of $10,000 invested in the S&P 500 (using next-day returns) depending on the behavior of the Summation Index. Returns are far and away better when it's above zero, preferably also rising.
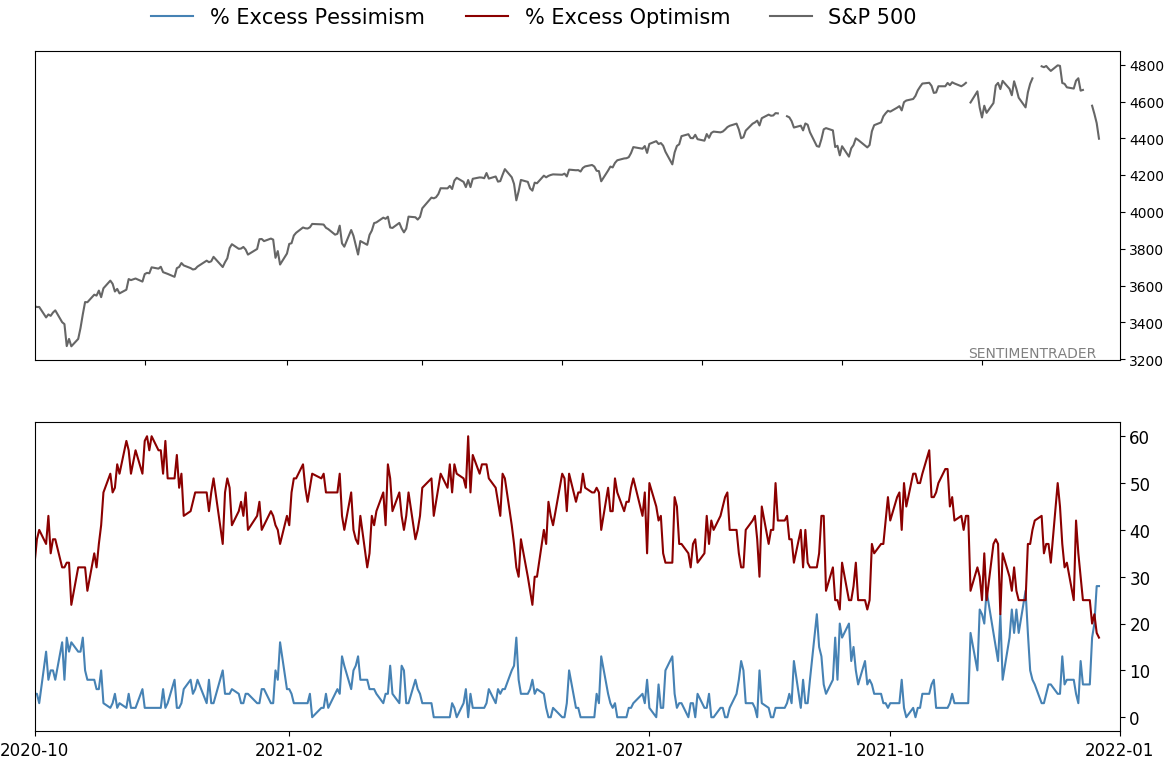
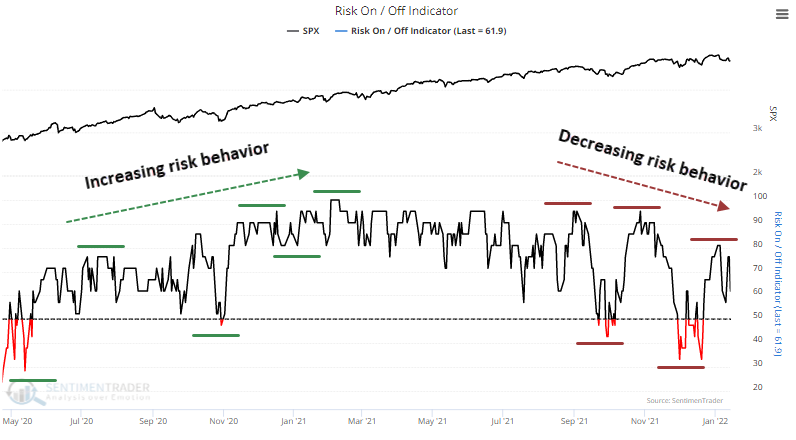
All of this can be seen in the increasingly hesitant amount of risk behavior. Since September, the Risk-On / Risk-Off Indicator has had a series of lower highs and lower lows.
Not surprisingly, this sentiment is also reflected in the spread between Smart Money and Dumb Money Confidence. Rallies are met with less enthusiasm, while selloffs are greeted with high anxiety. Maybe the pessimism in December was enough for a medium-term low, but this kind of behavior is not healthy on a long-term basis.
The lack of follow-through after recent breadth thrusts is troubling, as is the general risk-off attitude. It hasn't cycled down to a pessimistic extreme and is looking more and more like a trading range type of market at best. That means waiting for deeper pessimistic extremes than we've seen since the summer of 2020.
A simple market regime indicator has flipped negative
Dean showed that a new signal from a market regime indicator registered a risk-off alert on Thursday. It signals "risk-off" if the S&P 500 closes at a 40-day low and fewer than 56% of S&P 500 members are above their 200-day averages.
A 40-day breakout provides an intermediate-term external assessment of the index price trend while the percentage of members above the 200-day average provides an internal evaluation of long-term member trends.
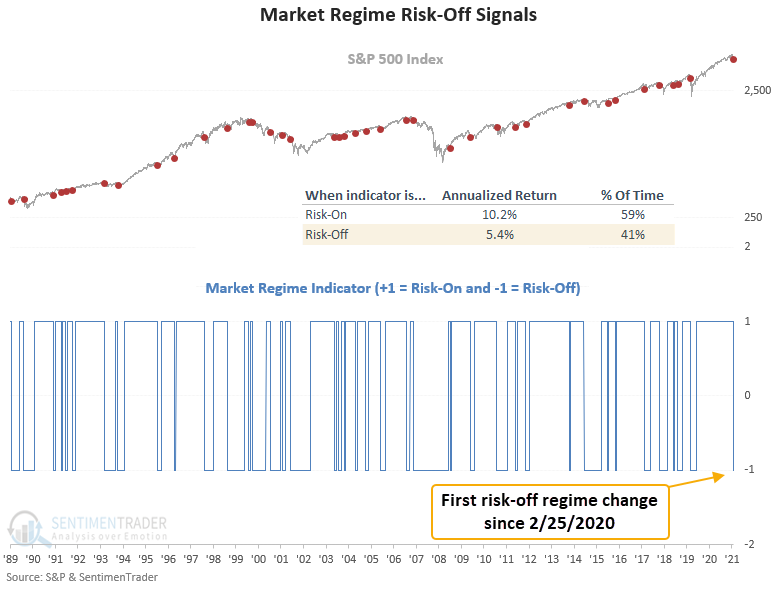
After 410 trading sessions in the risk-on regime, the indicator flipped to risk-off, ending the 4th longest streak since 1927. There were 10 other times over the past 76 years when we went so long in a positive regime. After the others, S&P 500 future returns and win rates were slightly weak to flat in the 1-8 week timeframes.
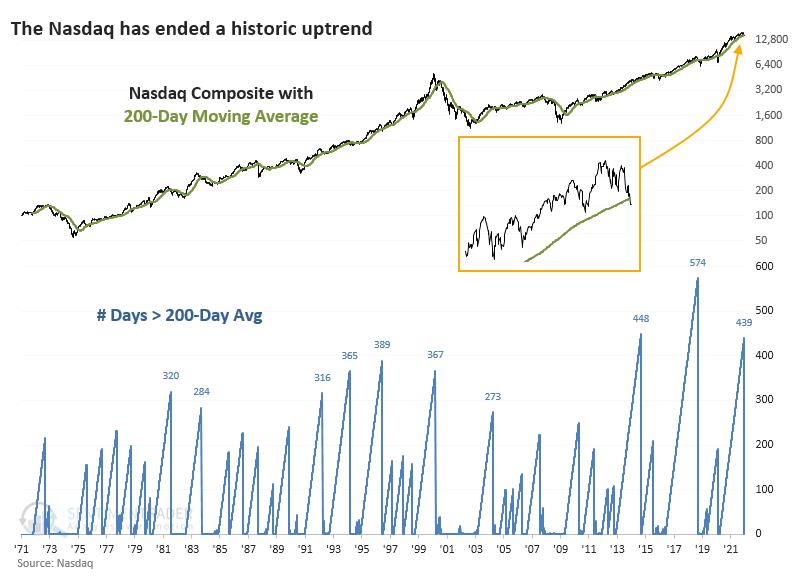
The Nasdaq loses some long-term positive trends
Internal deterioration has come home to roost, and the Nasdaq Composite has declined below its 200-day moving average for the first time in more than 400 days, ending its 3rd-longest streak above that long-term average.
After other times the Nasdaq fell below its average for the first time in at least a year, waning momentum weighed on the index. In 1996 and 2014, the Nasdaq almost immediately reversed and charged higher. Other than those two exceptions, the index tended to struggle for months.
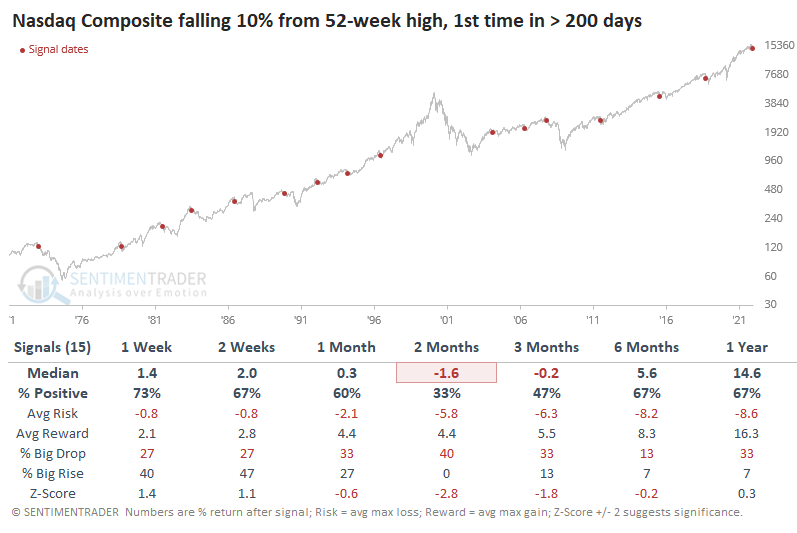
The selling pressure in recent days has also been enough to drag the Composite into correction territory, down more than 10% from its peak. This is the first time in more than 200 sessions that the index was more than 10% below its high.
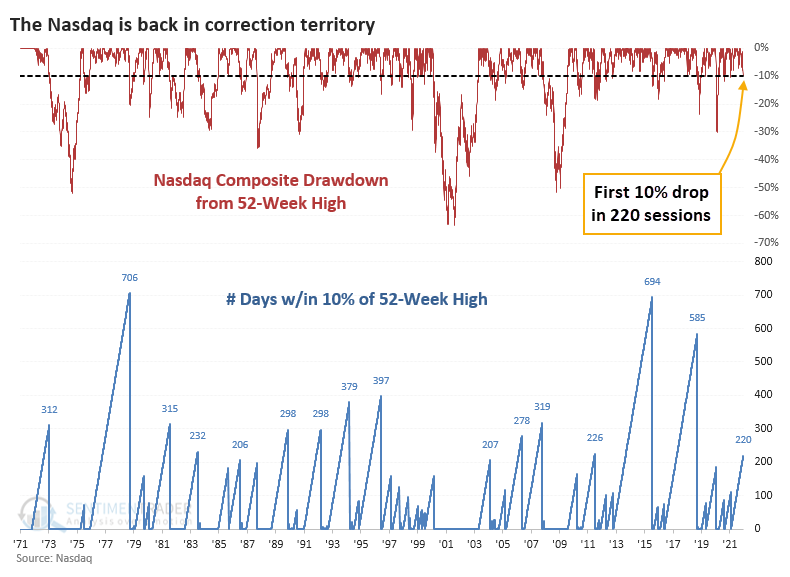
Once these streaks ended, the sellers tended to stick around. Over the next 2 months, the Nasdaq showed a positive return only 33% of the time, and all but 2 of the signals saw a negative return either 2 or 3 months later.
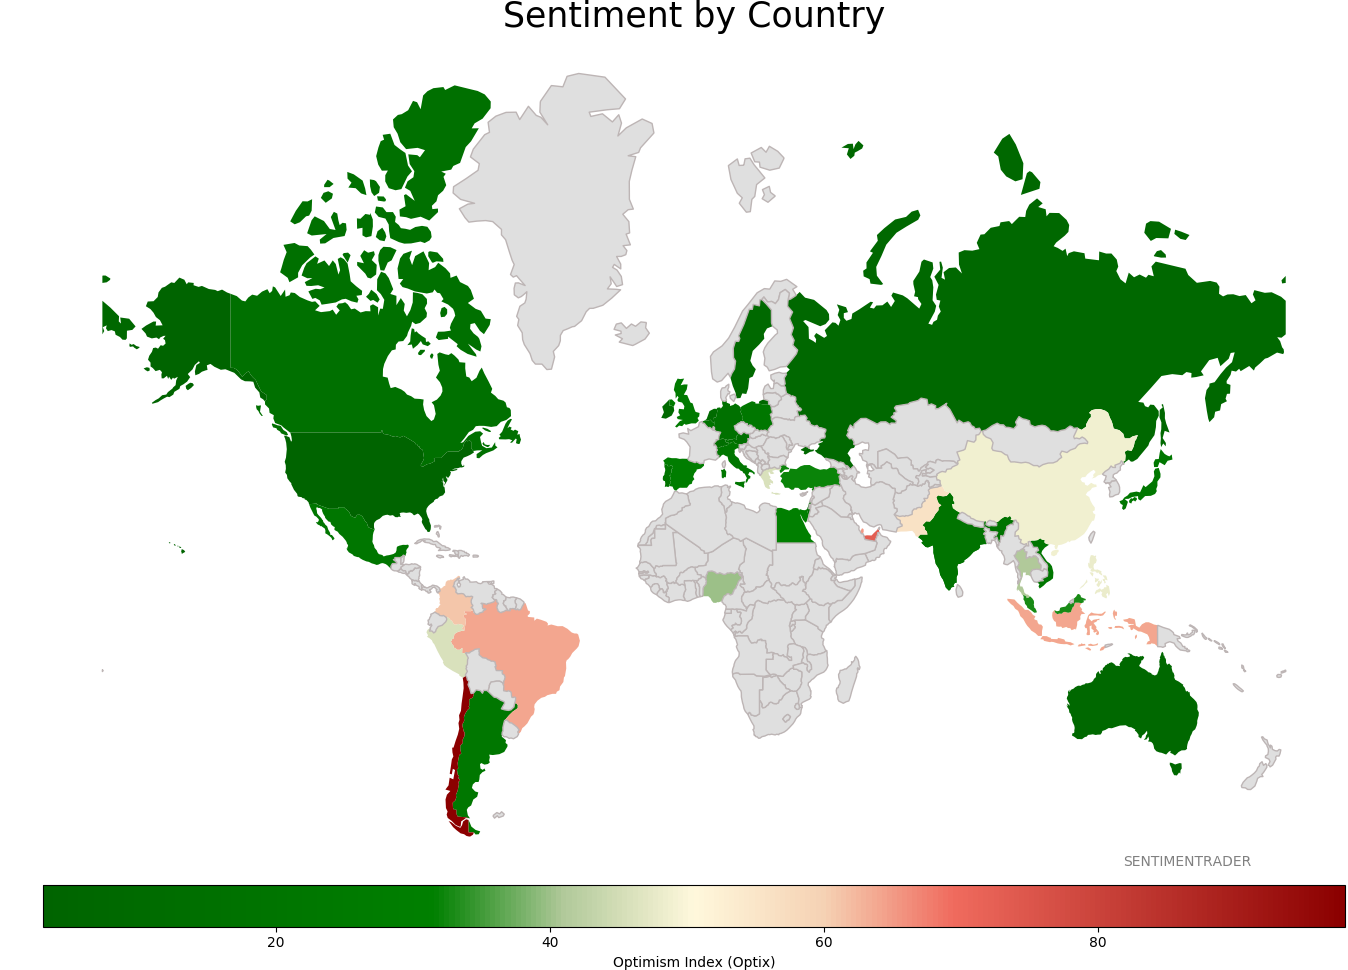
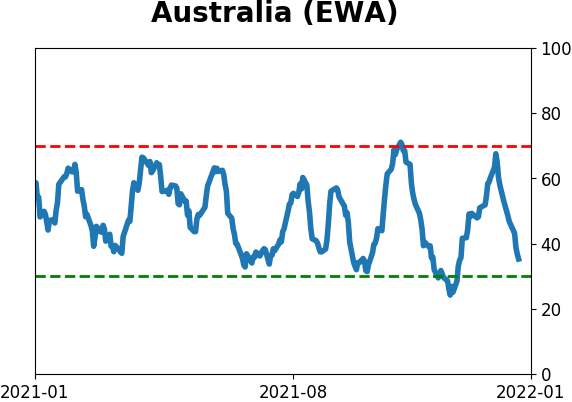
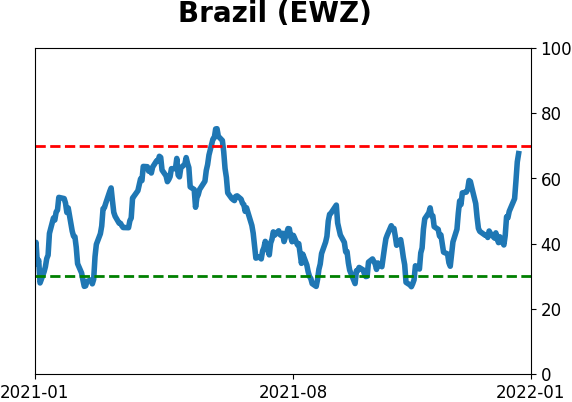
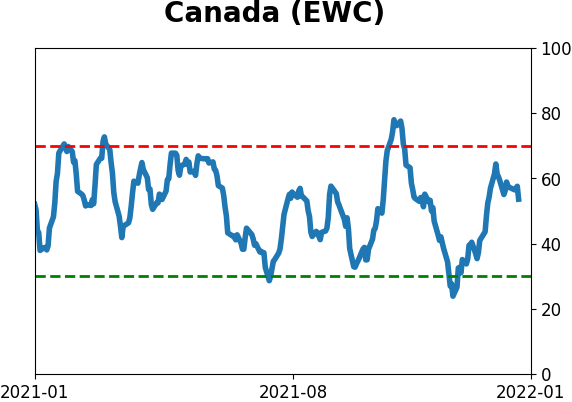
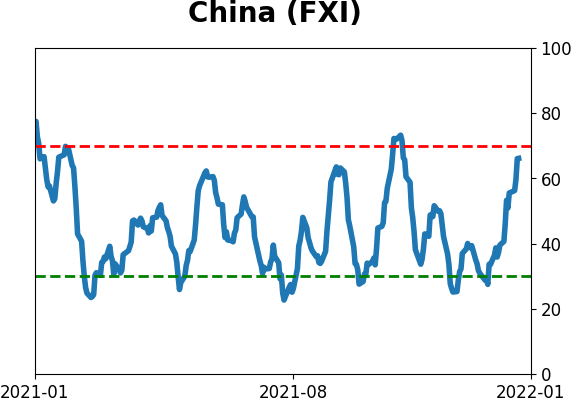
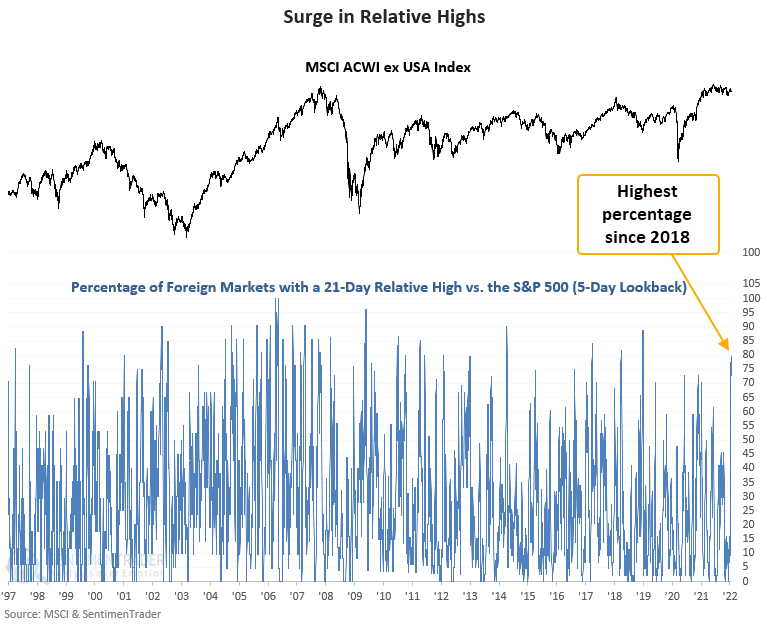
At least overseas markets are doing (relatively) well
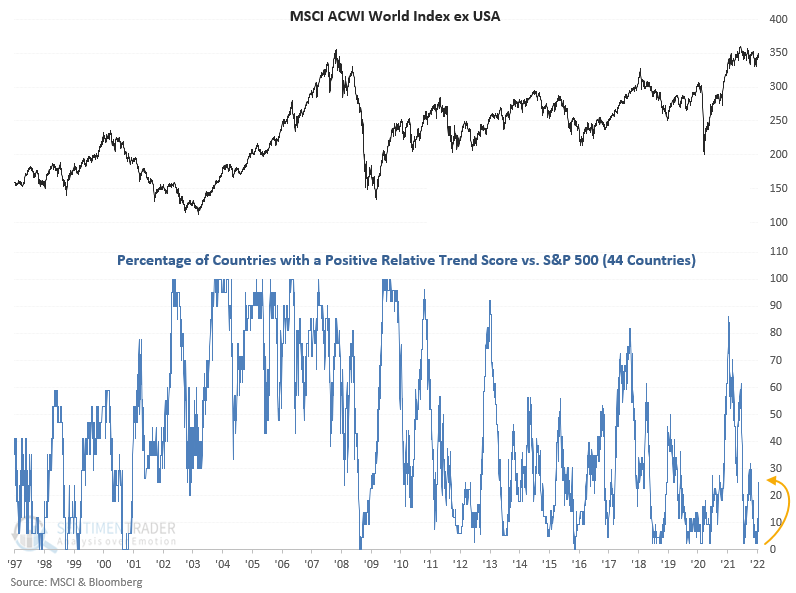
In 2021, most foreign markets underperformed the most widely followed domestic benchmark. The underperformance is now reversing, with 86% of the country ETFs that Dean tracks outperforming the S&P 500 on a YTD basis.
The number of countries with a positive relative trend score versus the S&P 500 increased by over 20% over the previous 3 weeks from a very depressed level.
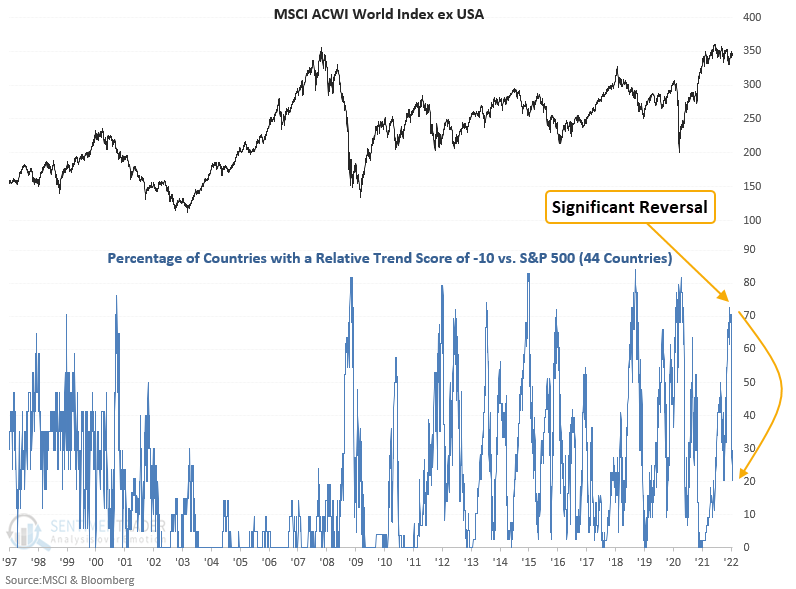
The percentage of countries with a relative trend score of -10 shows a significant reversal from the highest level since October 2020.
The percentage of foreign markets registering a 21-day relative high versus the S&P 500 surged to the highest level in more than 3 years.
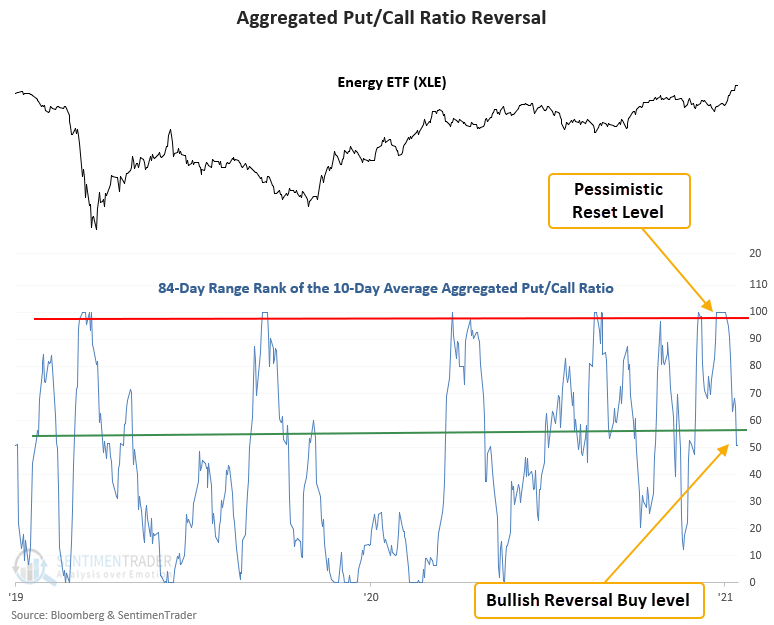
Bets against Energy are reversing
Dean noted that our aggregated put/call ratio indicator measures the summed options data for constituents of the index/ETF.
The put/call ratio trading model applies an 84-day range rank to a 10-day moving average of the XLE aggregated put/call ratio. The pessimistic reset condition is confirmed when the range rank indicator crosses the 99th percentile. A new buy signal occurs when the range rank crosses back below the 57th percentile. At the same time, momentum has to be positive.
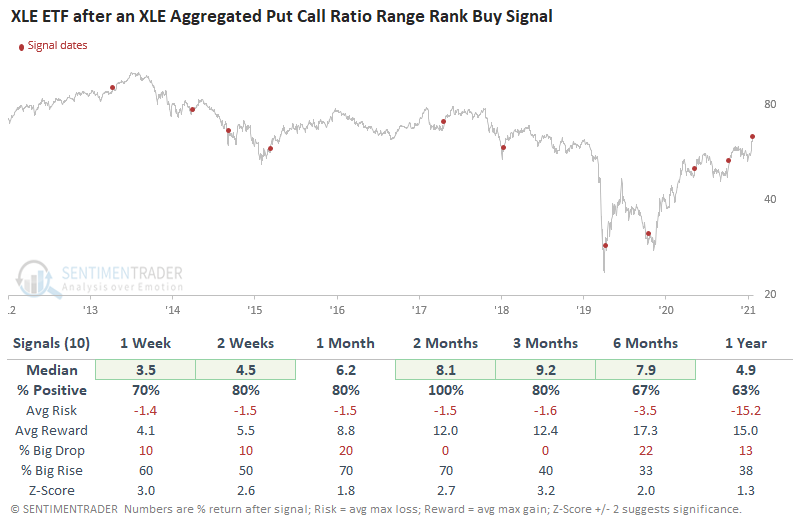
This signal has triggered 10 other times over the past 8 years. After the others, XLE future returns, win rates, and z-scores were excellent across all time frames. The sample size is small but all 10 signals showed a positive 2-month return.
A potential (risky) setup in semis
Jay looked at seasonality and sentiment in semiconductors, and an option trade to capitalize on it.
The chart below displays the annual seasonal trend for VanEck Vectors Semiconductor ETF (SMH). We are entering a brief seasonally favorable period that extends into the middle of February.
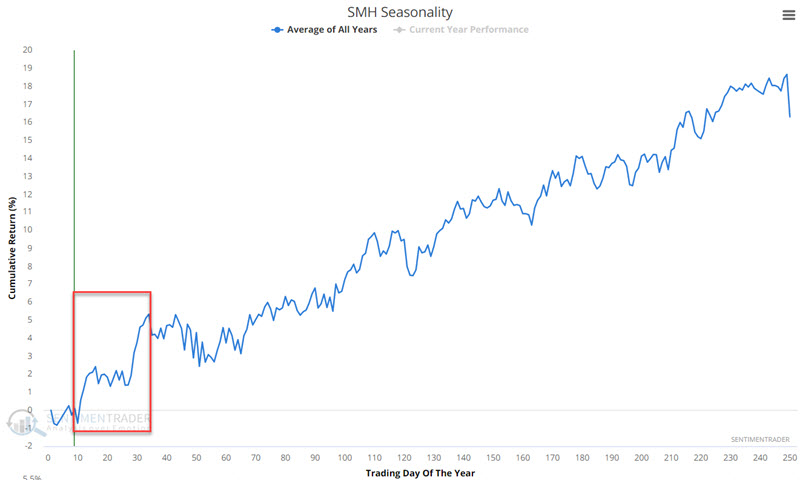
It is important to remember that seasonal charts are not roadmaps. In addition, given the weakness in the overall market of late, we will ultimately consider an options trade to limit dollar risk.
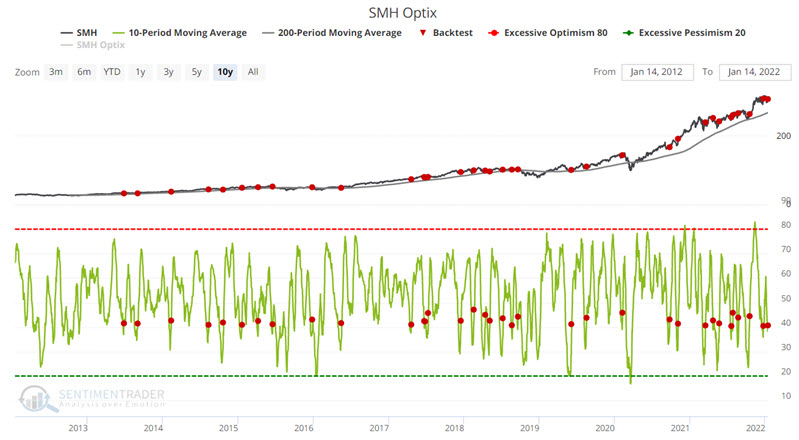
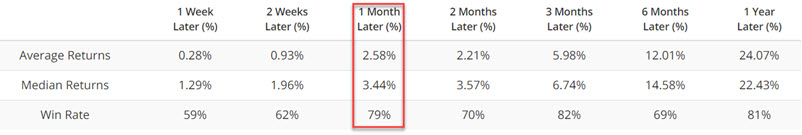
The SMH Optimism Index has also flashed a favorable sign. The red dots in the chart below display each time the 10-day average for SMH Optix has crossed above 40 while SMH was above its 200-day moving average. SMH has been higher 1-month later 79% of the time with an average gain of 3.44%.
As a result of all of the above factors, we will focus on options on Intel (INTC), which, a) is a lower-priced stock in the group, and b) (typically) has the narrowest options bid/ask spreads.
The example trade we will consider is a bull call spread. The cost to buy a 1-lot is $370. A trader would decide what % of their trading capital they wish to commit and then trade the appropriate lot size. For example, a trader with $25,000 decides to commit 2% ($500). This trader would buy a 1-lot. If the same trader decided to commit 5% ($1,250), they could trade a 3-lot ($1,250 / $370).
The particulars and risk curves for this trade appear in the figures below.
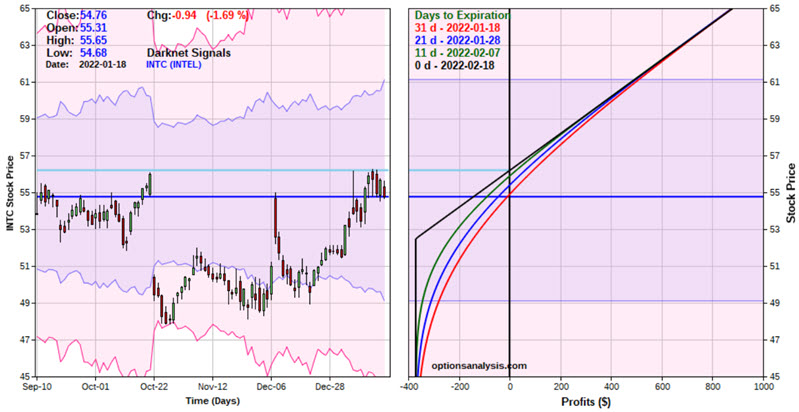
This trade is a low-dollar risk speculative bet that INTC will work its way higher sometime between now and February option expiration.
This must be considered as a highly speculative play for several reasons:
- If INTC must rise above the breakeven price ($56.20) by expiration or this trade will lose money
- If INTC is below the strike price (52.50) at expiration this trade will lose 100% of the premium paid
- We are using INTC as a proxy for the overall semiconductor sector. A key risk is that the overall sector may perform well, but INTC will not. In this case, a loss could occur even if the overall sector performs very well
Treasury bond seasonality is sour
Jay noted that while Treasury bonds might be oversold, they're entering a tough seasonal window.
Long-term Treasuries have entered a particularly seasonally weak period that lasts until roughly the middle of May 2022.
For our test, we will look at the price changes for treasury bond futures during the seasonally unfavorable period that extends from Trading Day of the Year (TDY) #10 through TDY #91. Each one-point movement in the futures contract price represents $1,000 gained or lost.
The chart below displays the year-by-year performance for t-bond futures during this seasonally unfavorable period.
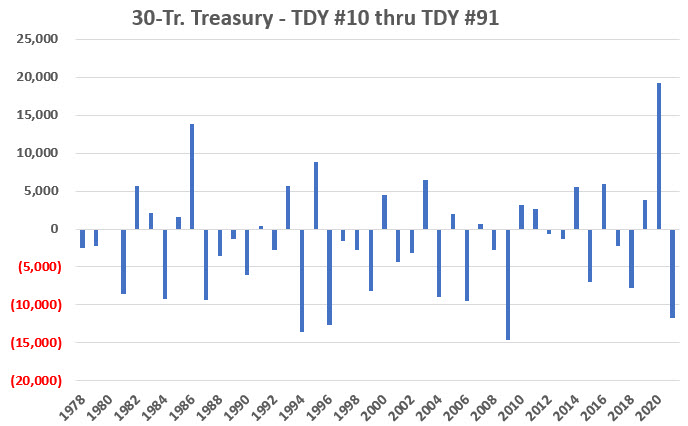
From the mid-1980s through 2009, the results were consistently quite bearish. Since then, results have been mixed, with a substantial gain during the Covid-panic of 2020 and a significant decline in 2021.
Over the last 44 years, only 17 showed a gain during this window.
About the Weekly Wrap...
The goal of the Weekly Wrap is to summarize our recent research. Some of it includes premium content (underlined links), but we're highlighting the key focus of the research for all. Sometimes there is a lot to digest, with this summary meant to highlight the highest conviction ideas we discussed. Tags will show any symbols and time frames related to the research.
Active Studies
| Time Frame | Bullish | Bearish | | Short-Term | 2 | 0 | | Medium-Term | 13 | 2 | | Long-Term | 13 | 5 |
|
Indicators at Extremes
Portfolio
| Position | Description | Weight % | Added / Reduced | Date | | Stocks | RSP | 10.8 | Reduced 9.1% | 2022-01-20 | | Bonds | 32.7% BND, 7.1% SCHP | 40.1 | Added 8.3% | 2021-10-26 | | Commodities | GCC | 2.4 | Reduced 2.1%
| 2020-09-04 | | Precious Metals | GDX | 4.6 | Reduced 4.2% | 2021-05-19 | | Special Situations | 8.1% KWEB, 3.6% XLE, 1.7% PSCE | 13.4 | Reduced 3.9% | 2022-01-18 | | Cash | | 28.0 | | |
|
Updates (Changes made today are underlined)
Not impressed at all with the market action since there was a breadth thrust at the end of December, with selling pressure hitting consistently since then. The drawdown is beyond what we've typically seen after similar thrusts. More and more indicators are showing risk-off sentiment, and the market environment is sketchy. I've reduced risk because of it. Bond sentiment is trying to recover from a recent bout of pessimism, and gold stocks are doing their thing which is not much at all. They've been flat for six months. Chinese tech stocks were doing exactly what they're supposed to do, then did *not* by plunging to new lows. This is troubling on a shorter-term time frame, but this was never meant for a trade, rather a multi-year investment. Recent behavior is troubling and I will not be adding any exposure as long as that's the case. RETURN YTD: -0.1% 2021: +8.7%, 2020: +8.1%, 2019: +12.6%, 2018: +0.6%, 2017: +3.8%, 2016: +17.1%, 2015: +9.2%, 2014: +14.5%, 2013: +2.2%, 2012: +10.8%, 2011: +16.5%, 2010: +15.3%, 2009: +23.9%, 2008: +16.2%, 2007: +7.8%
|
|
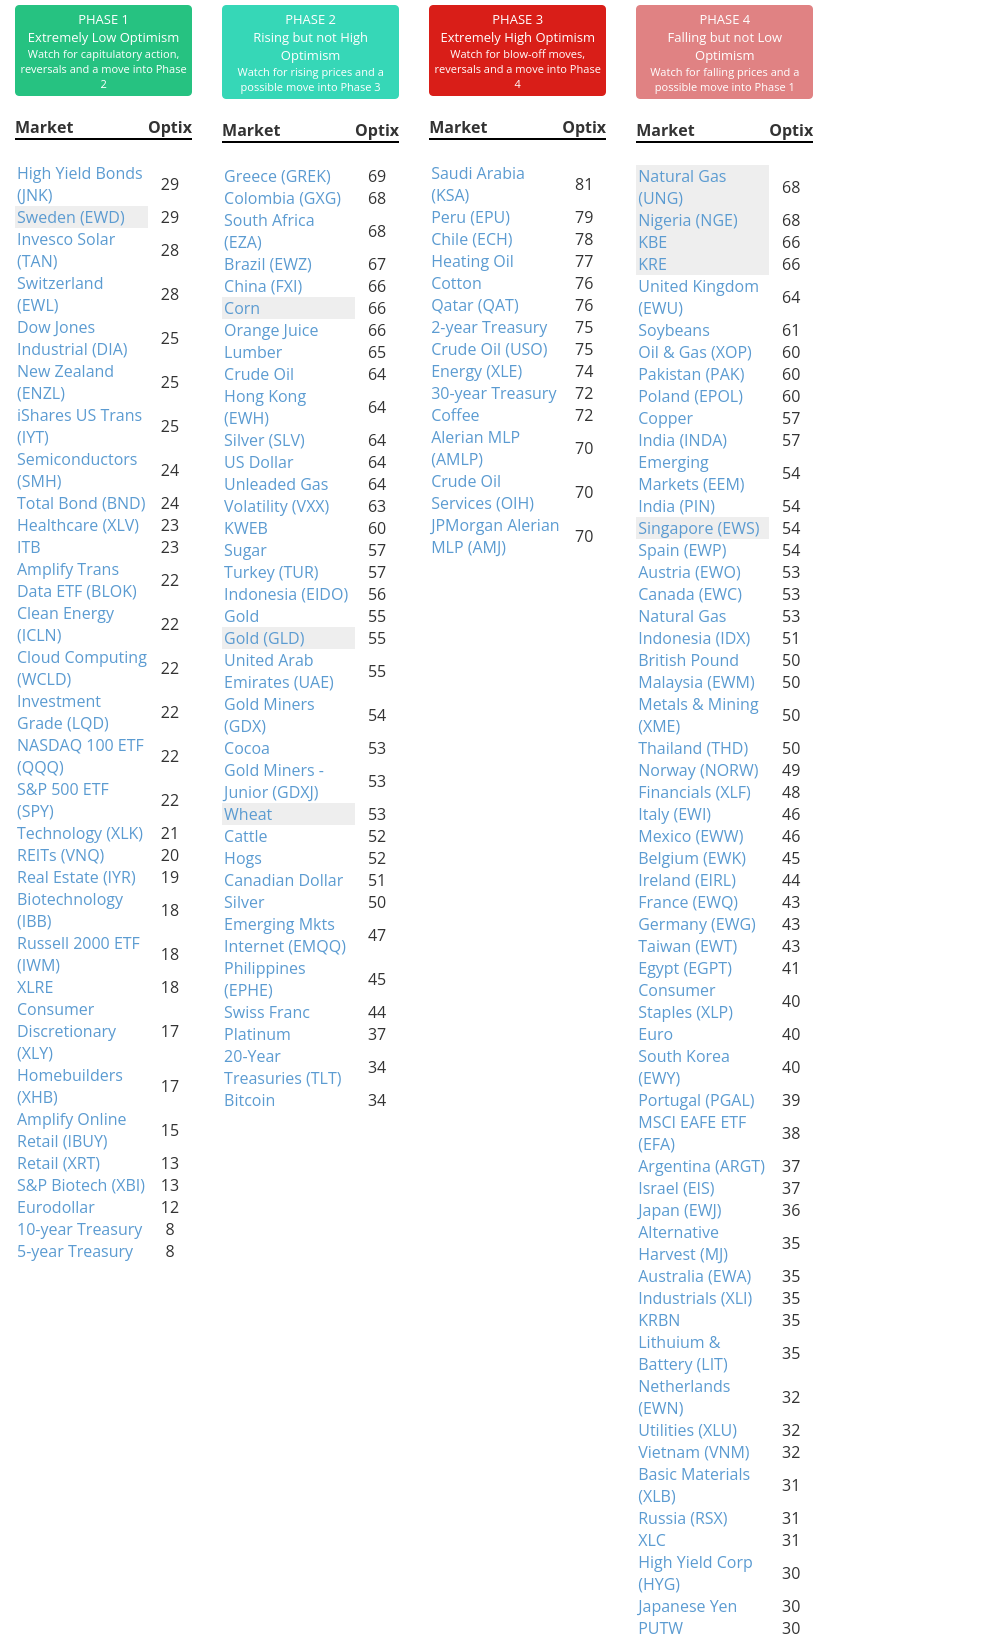
Phase Table
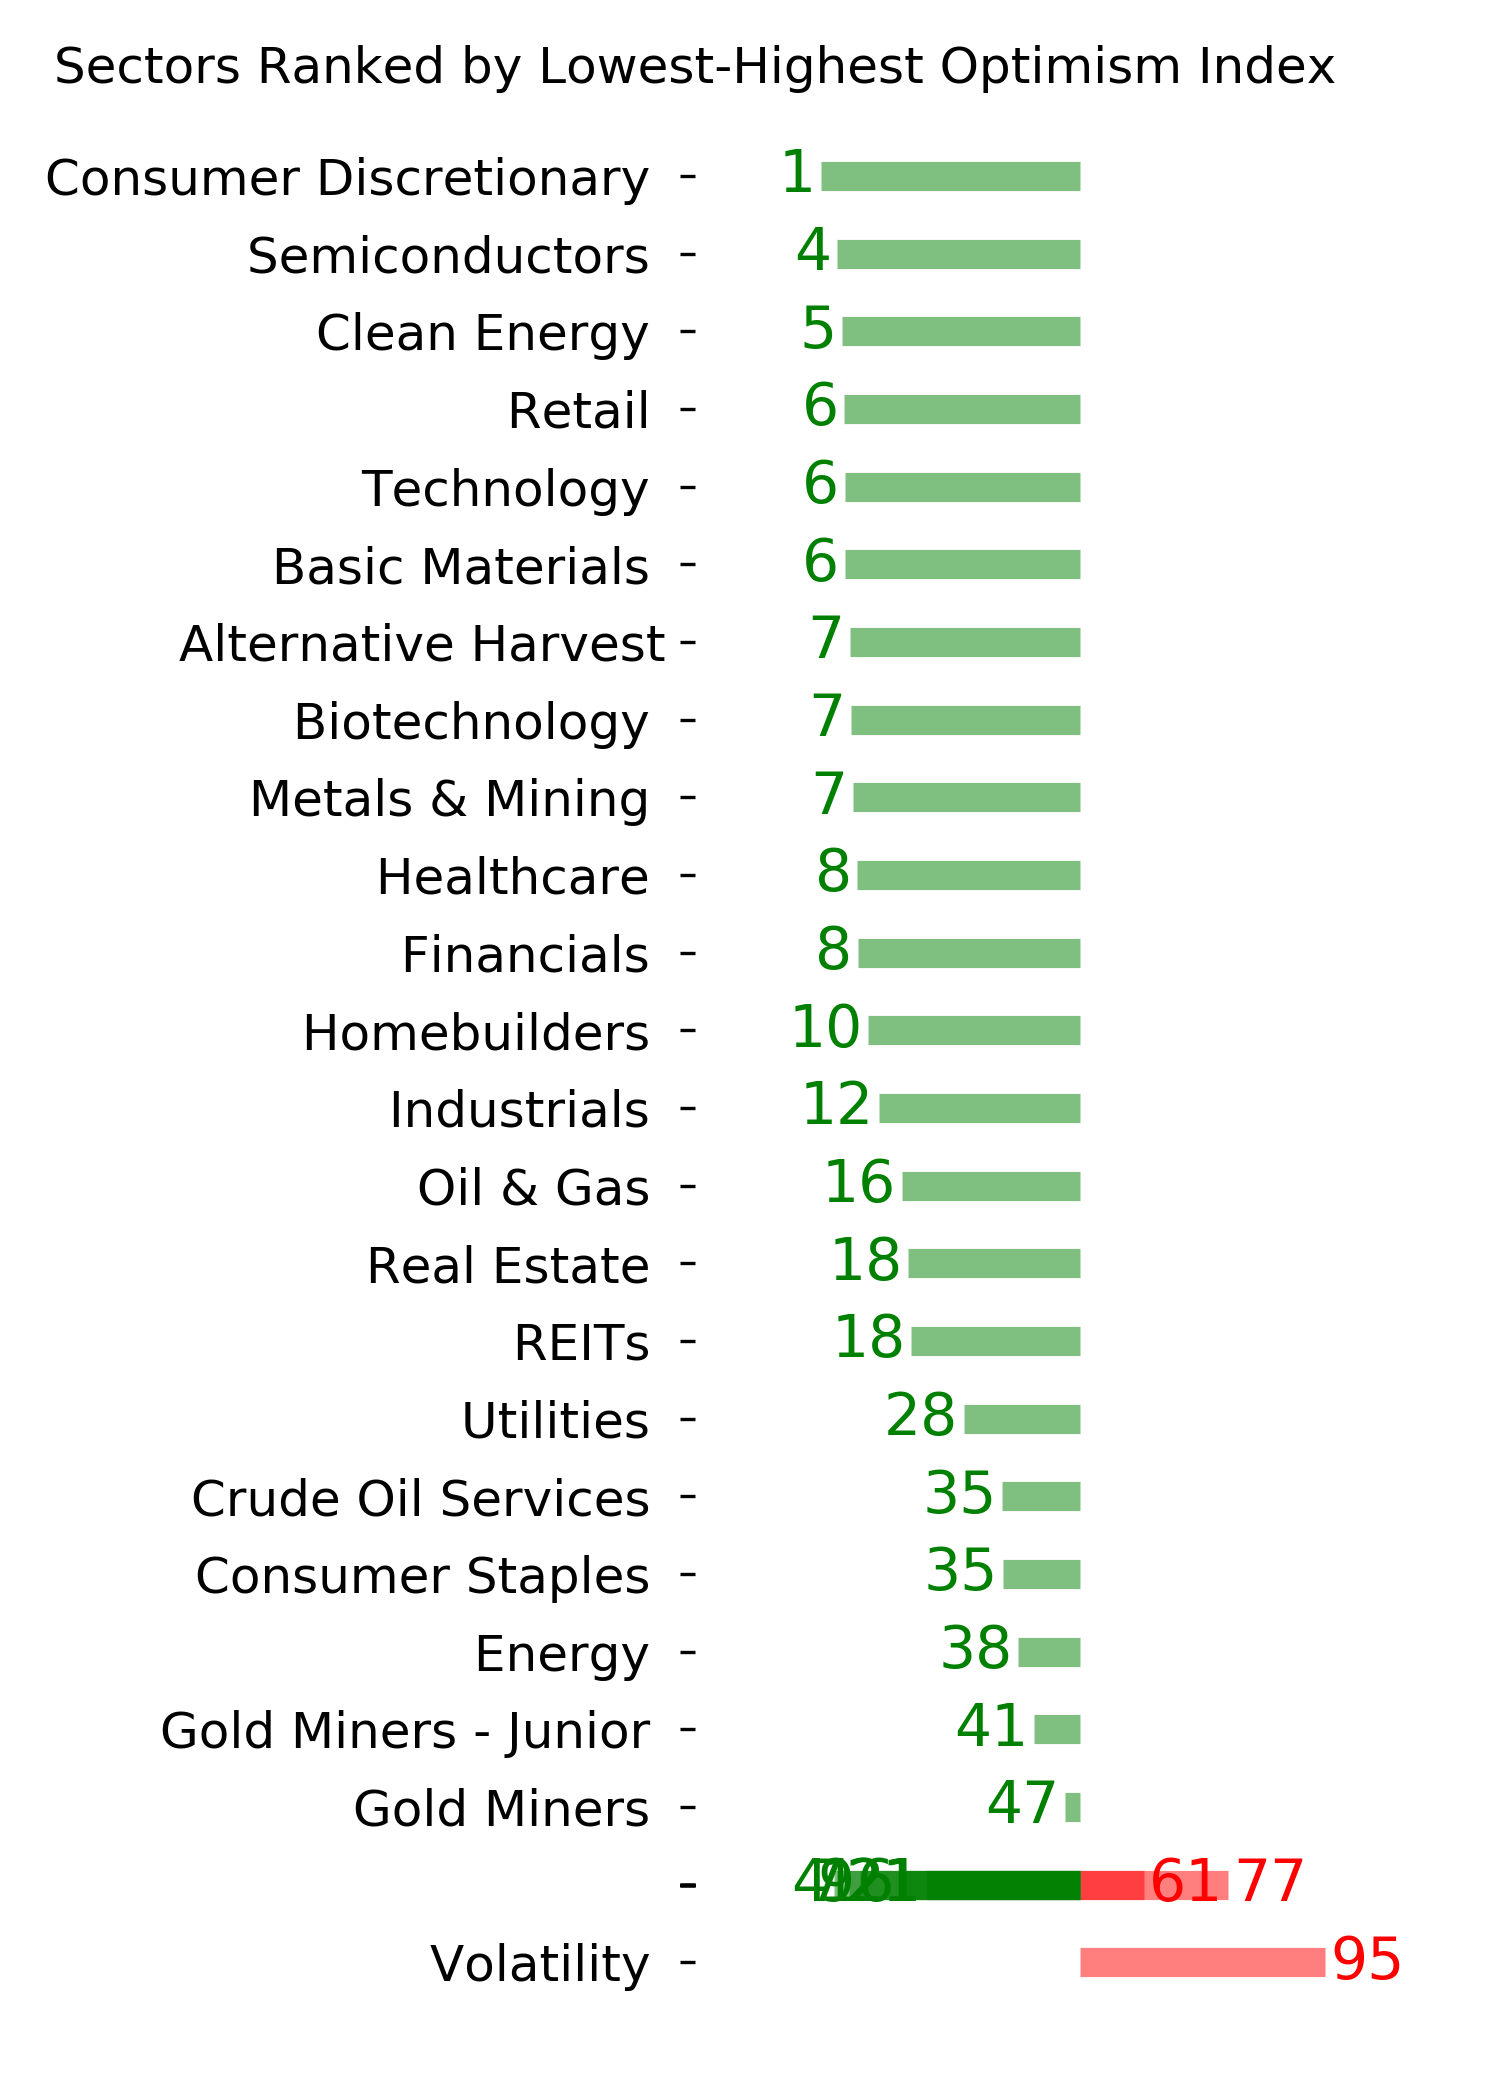
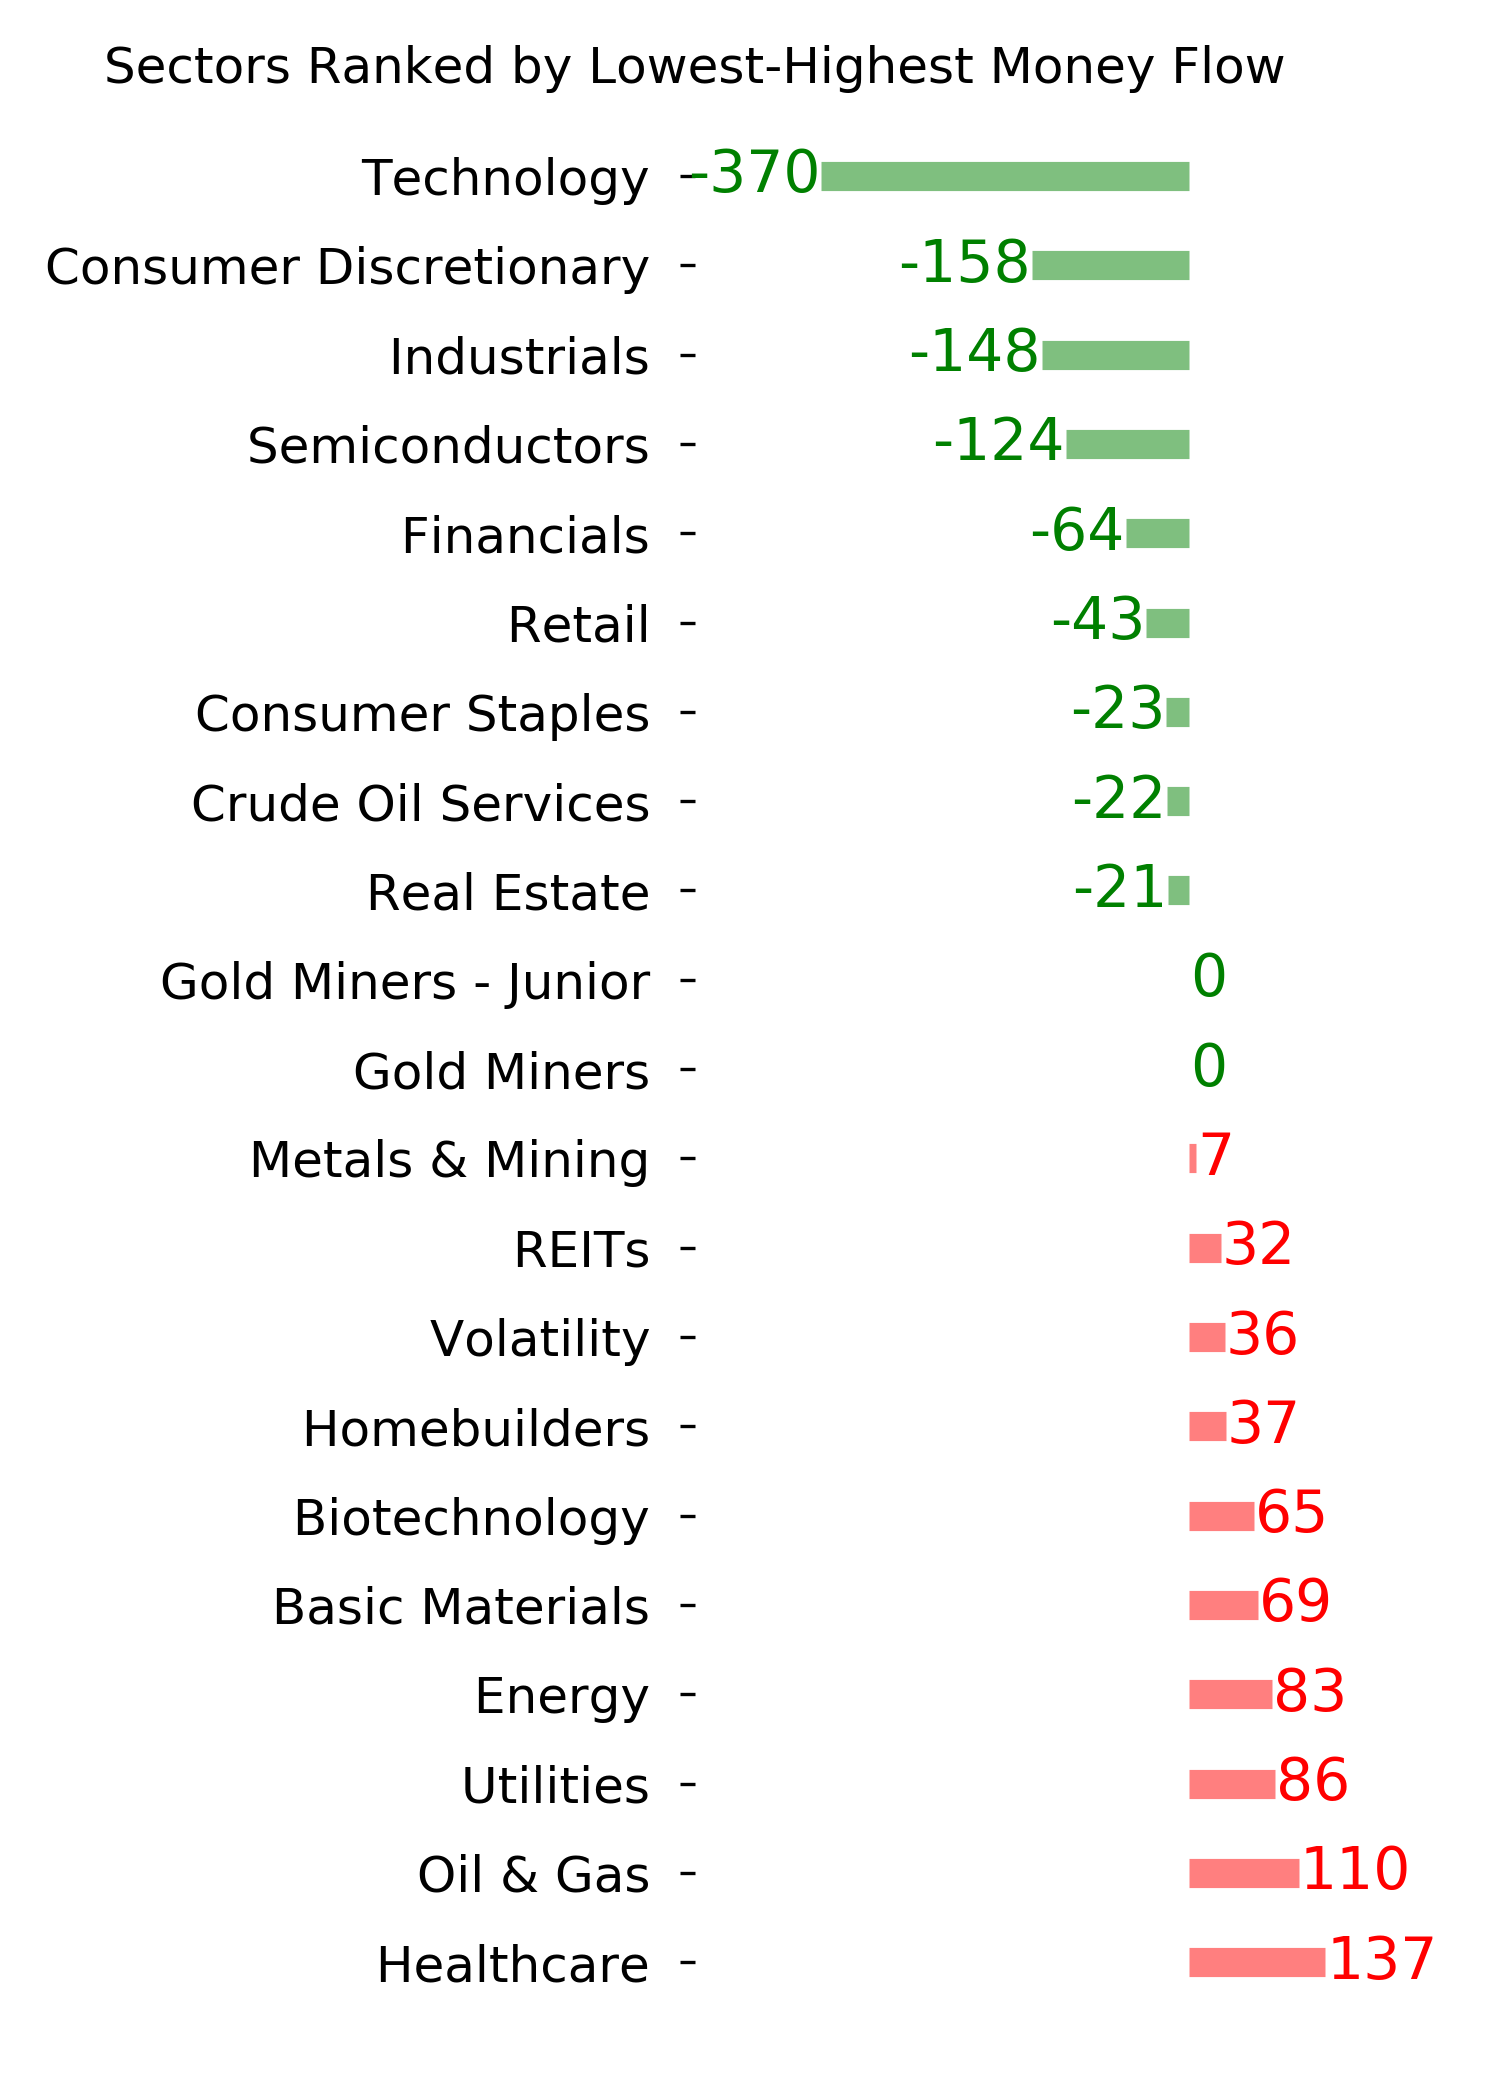
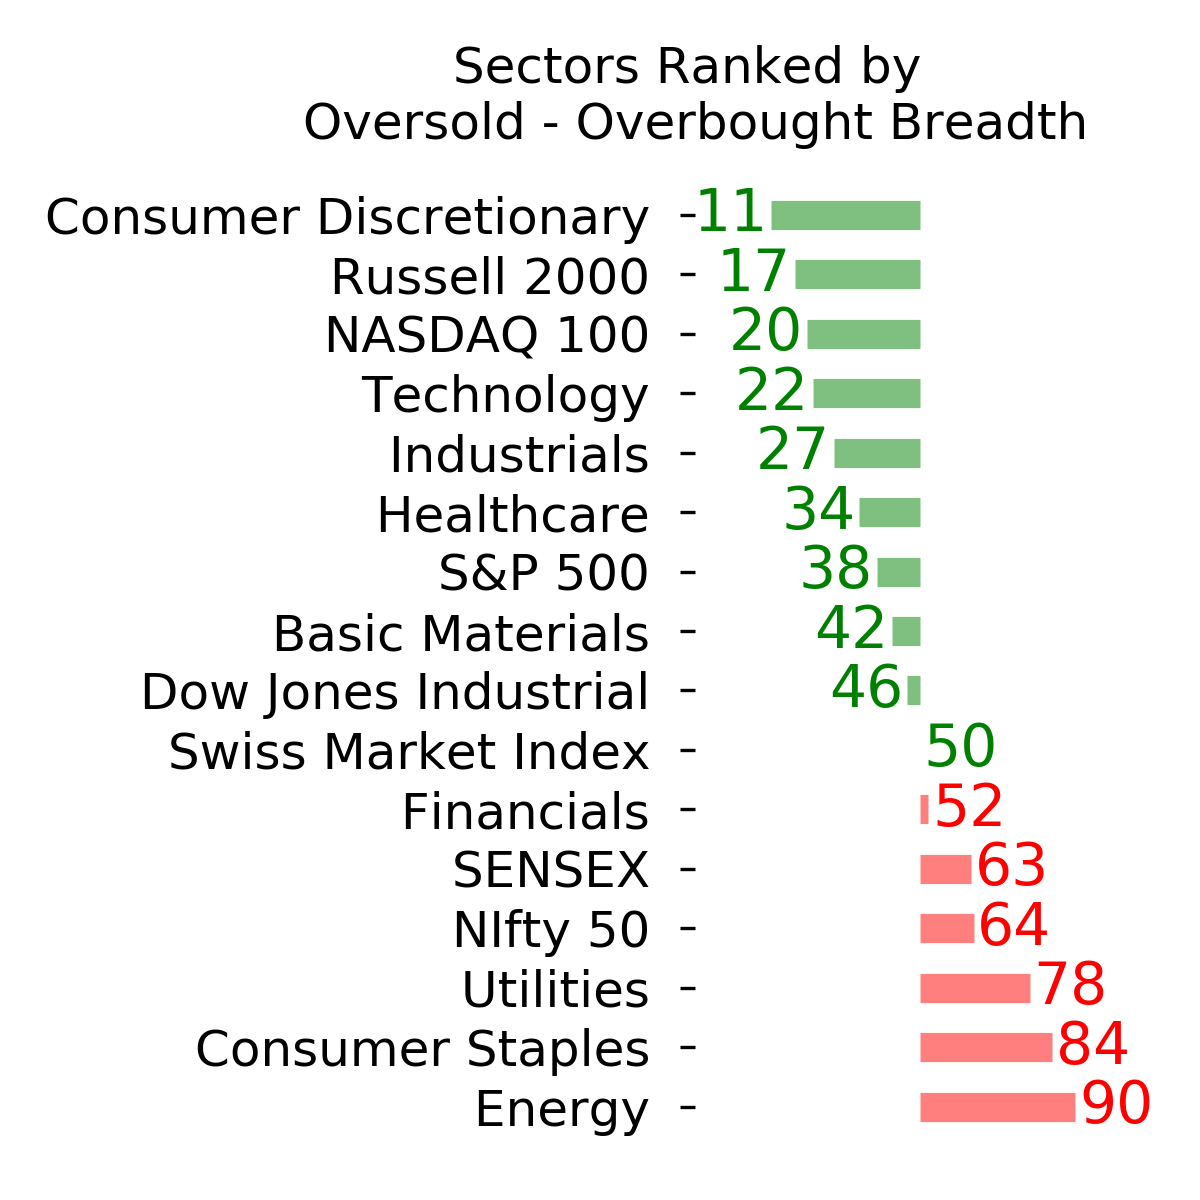
Ranks
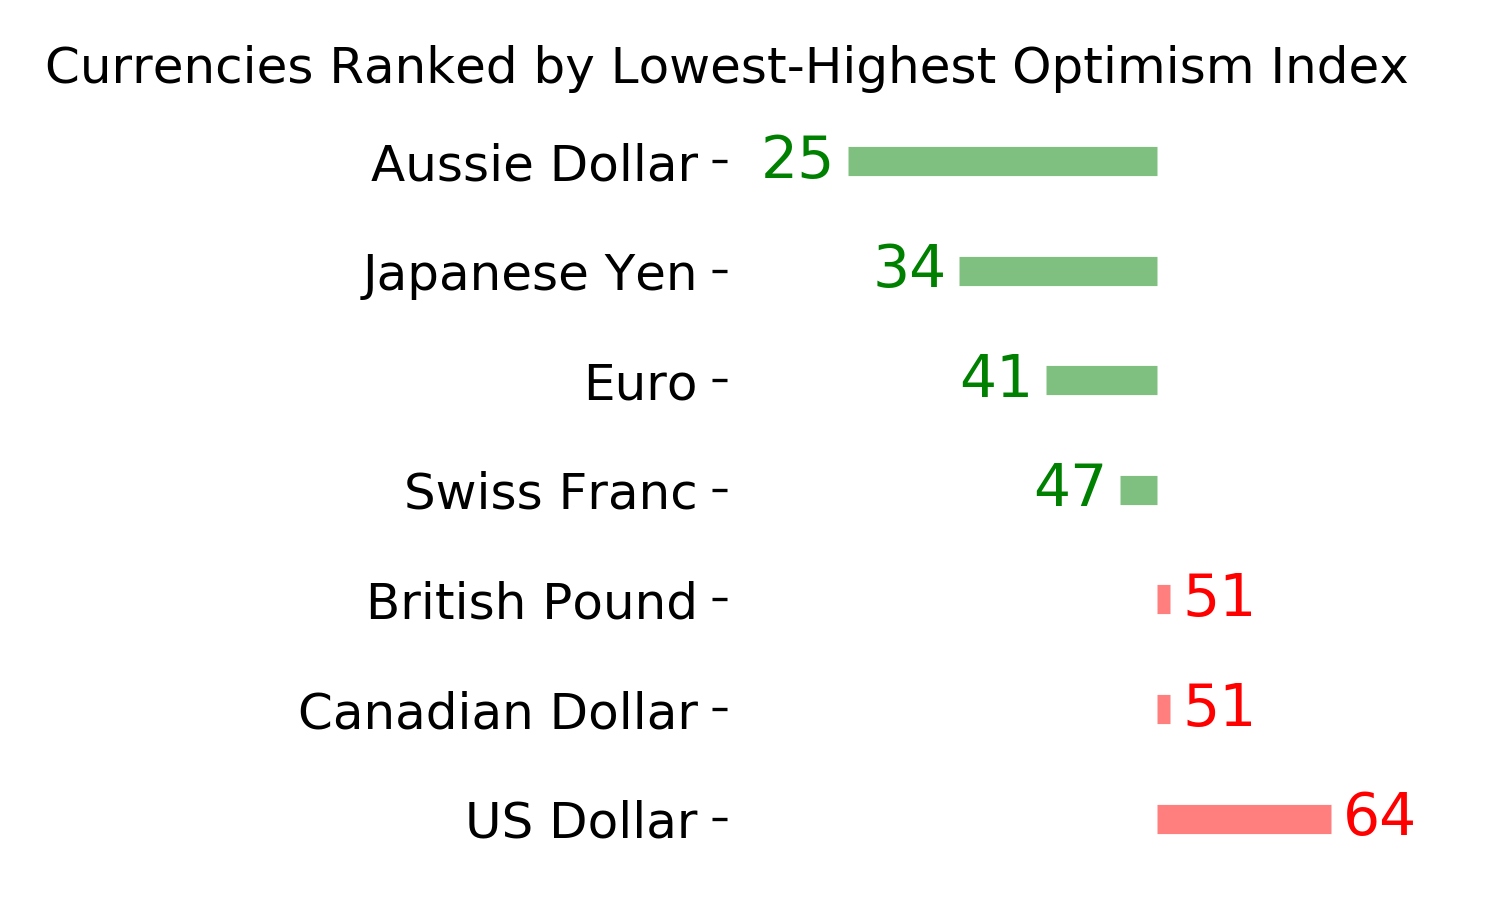
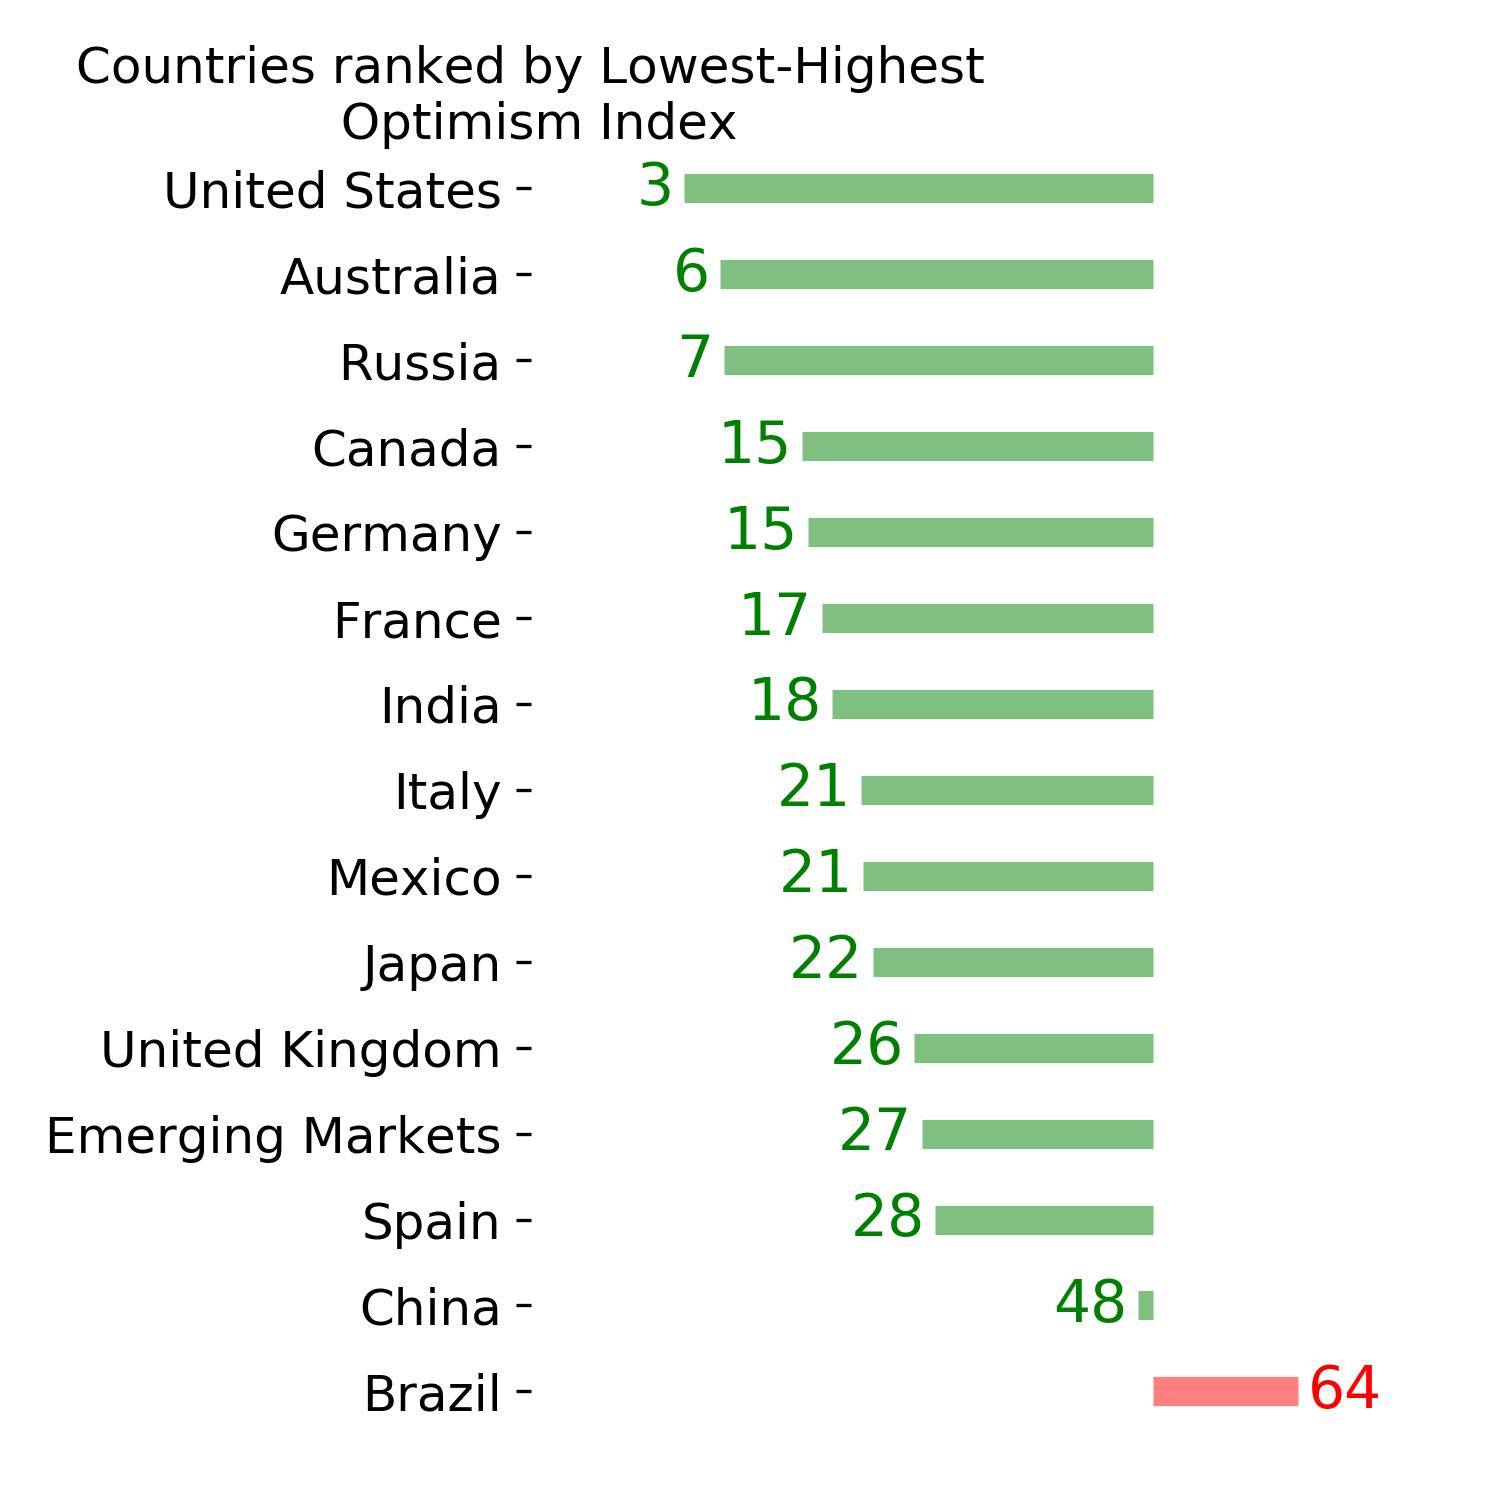
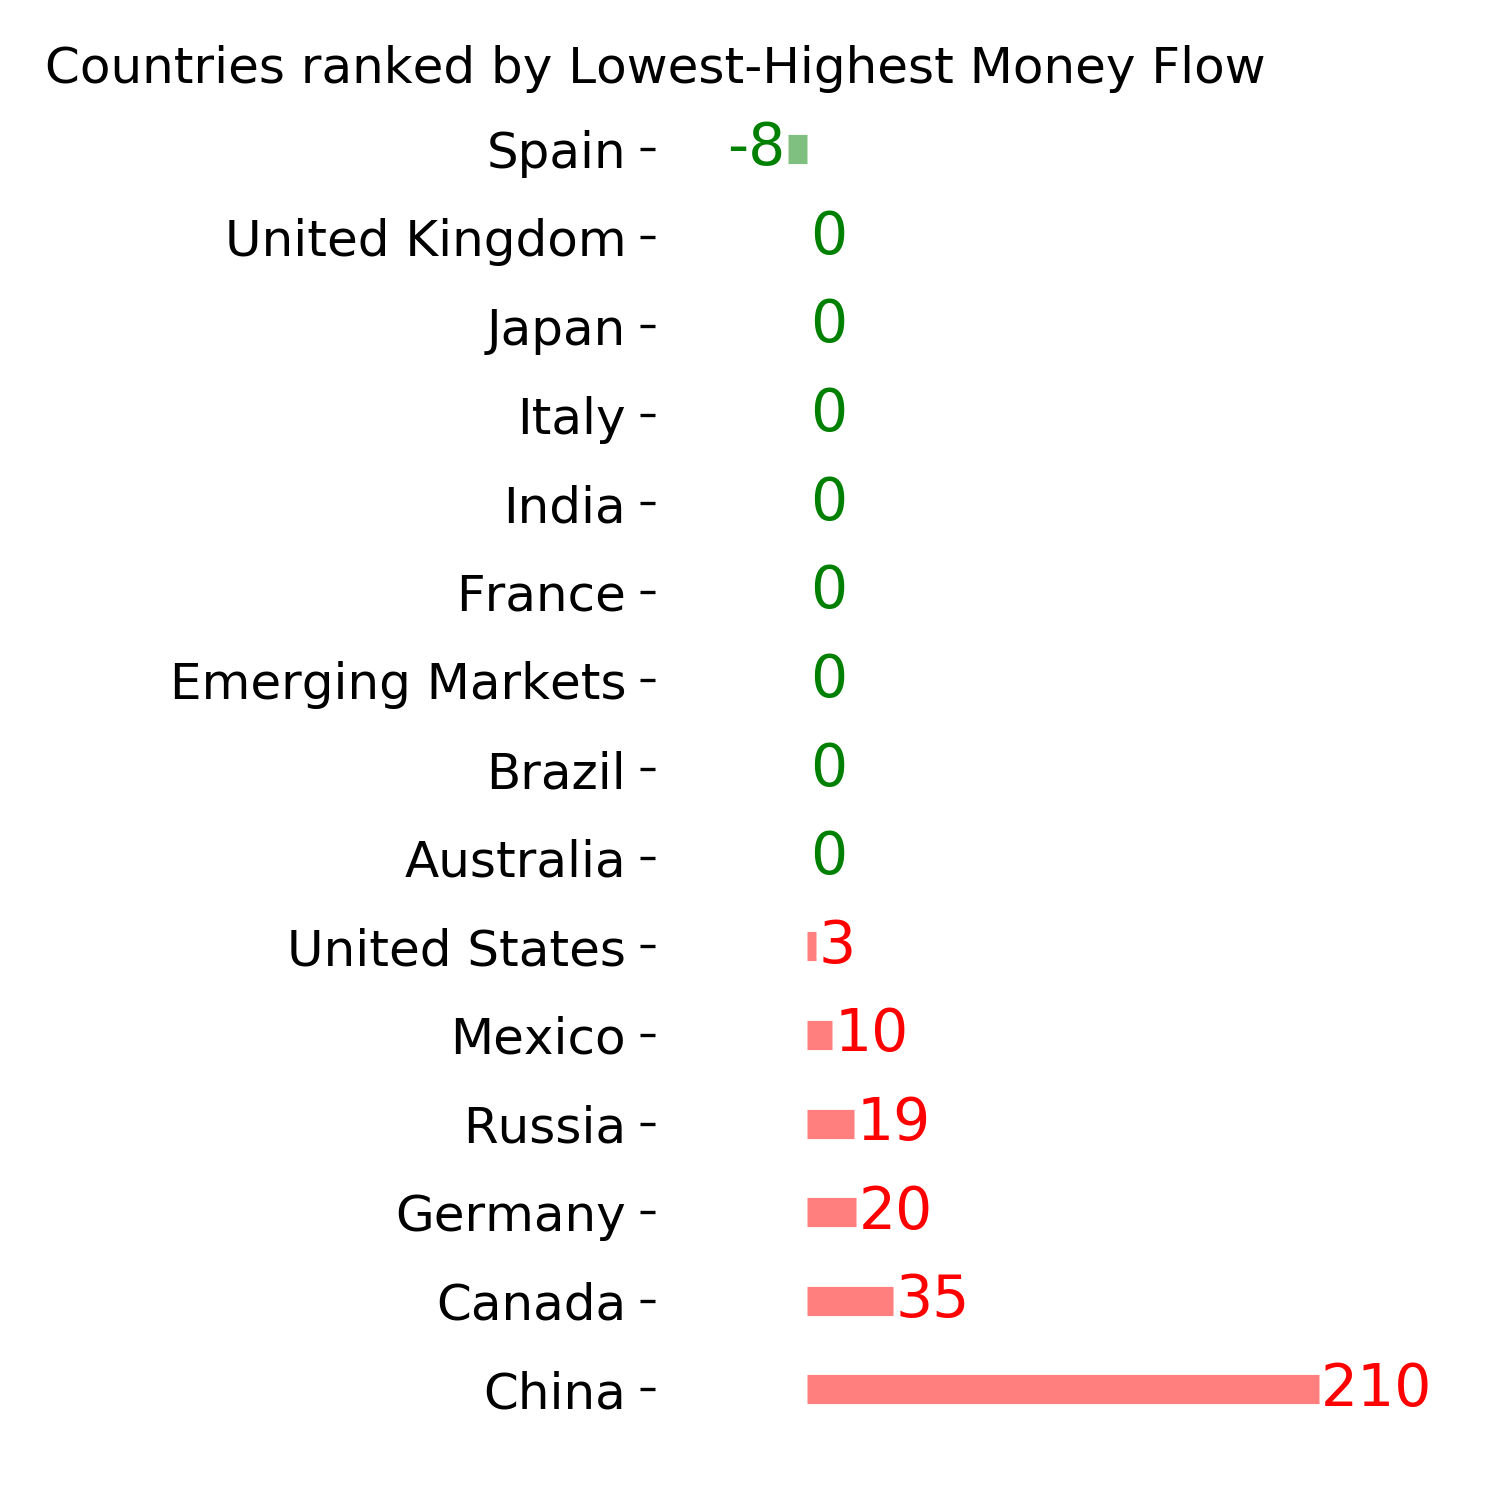
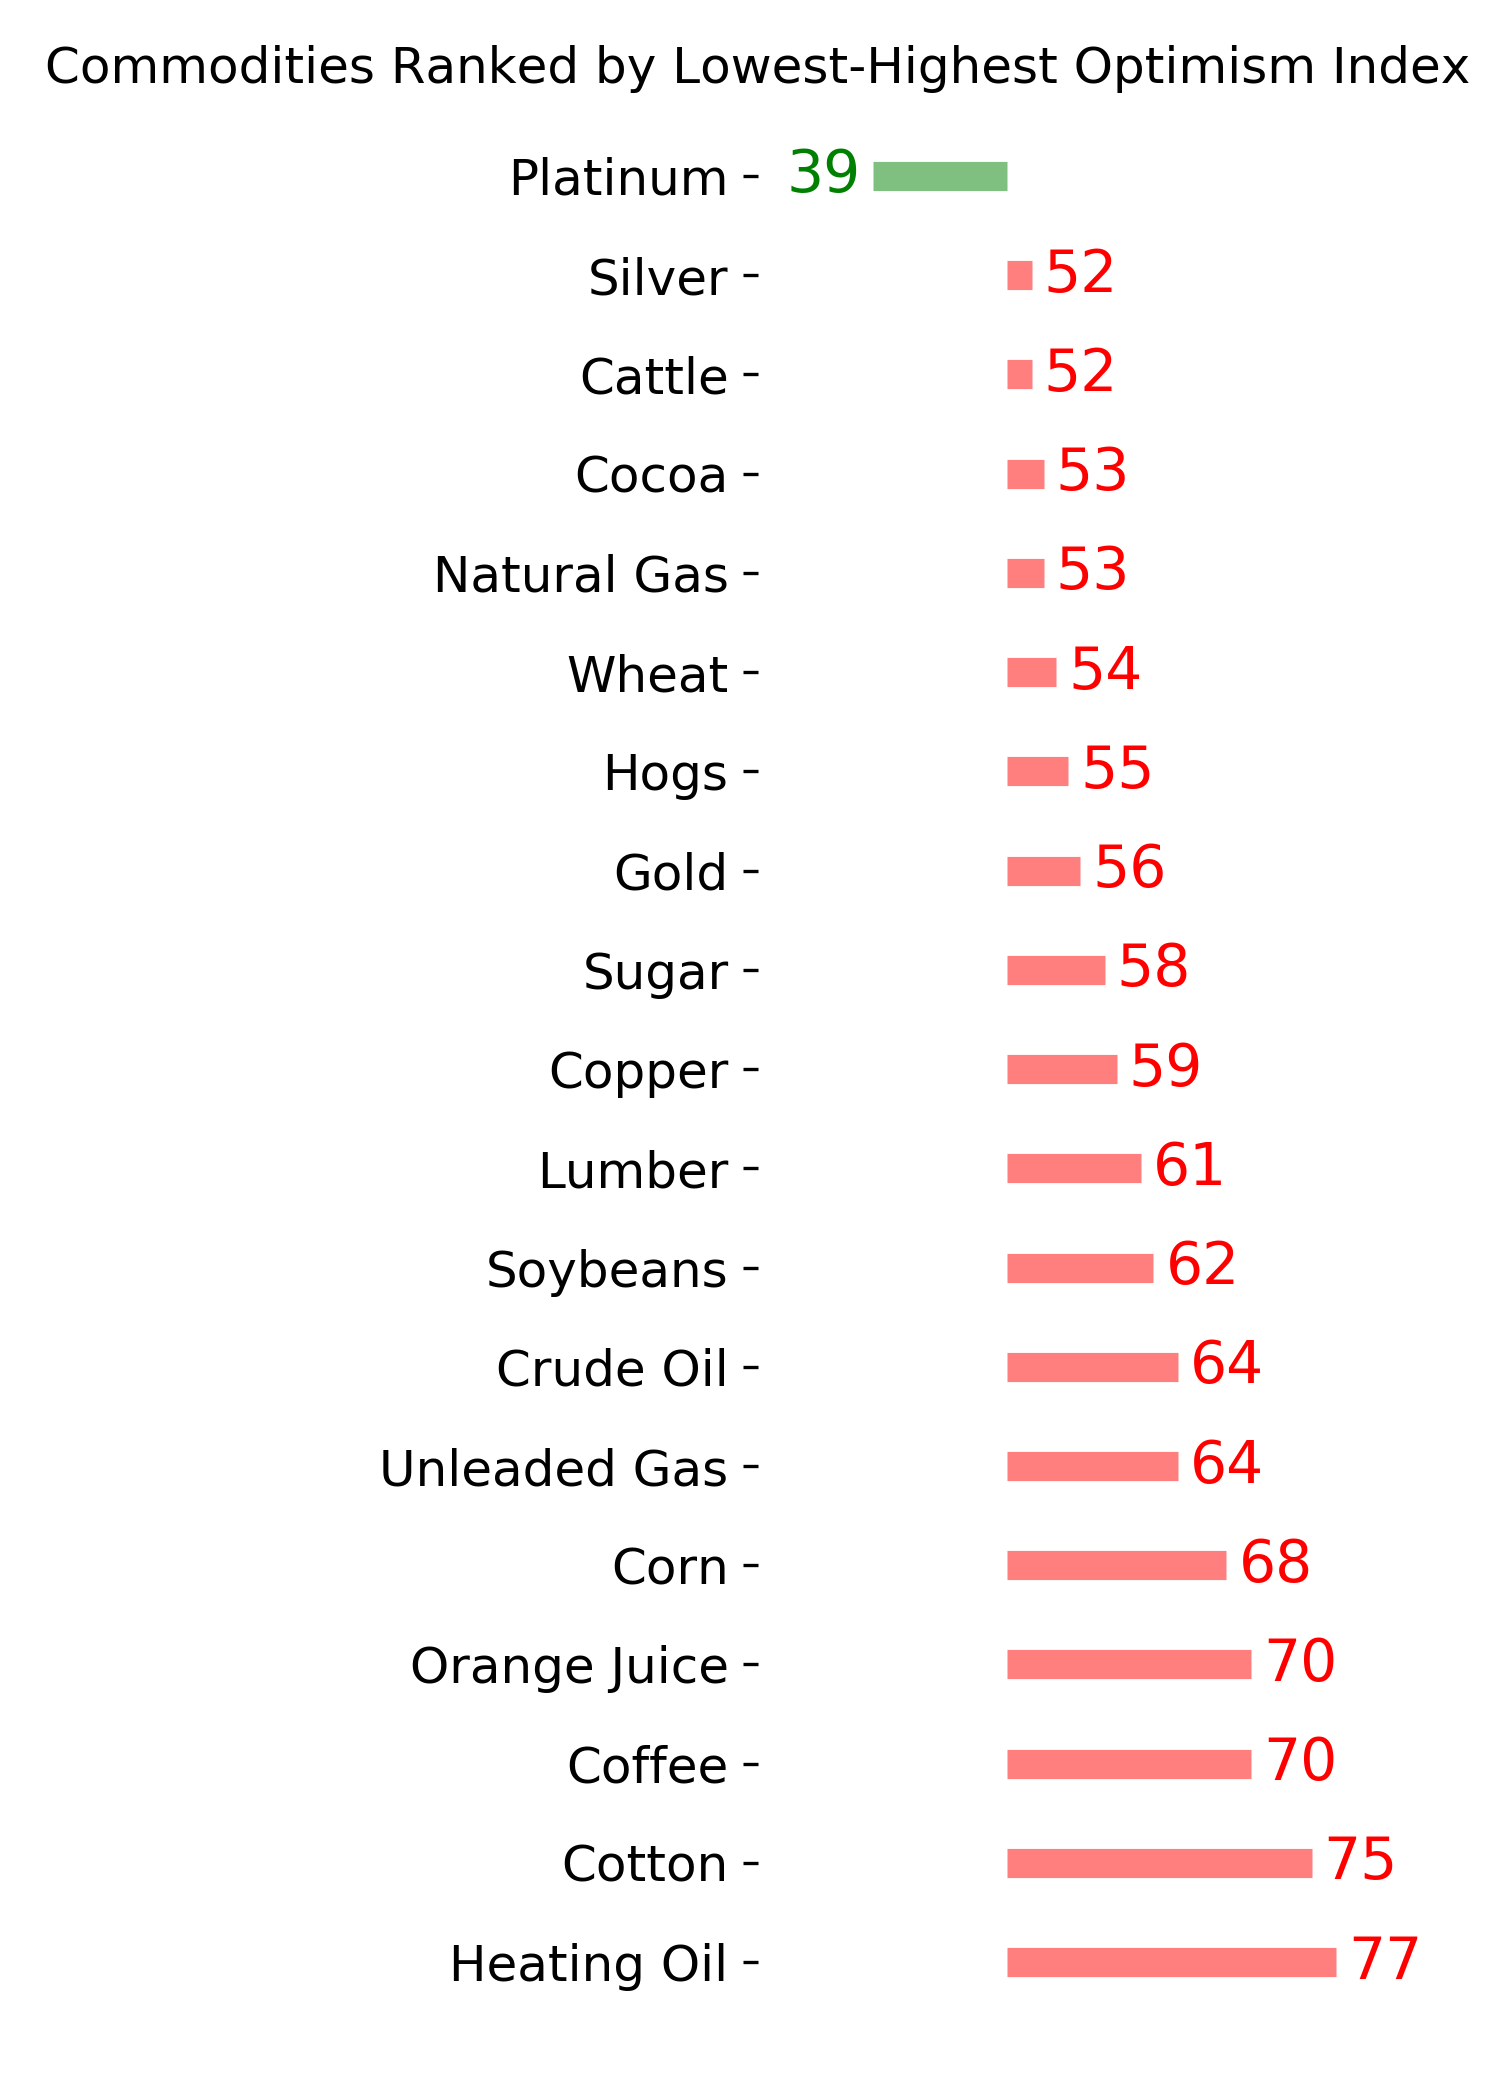
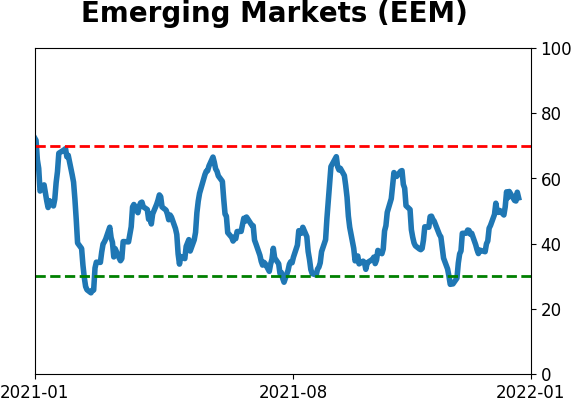
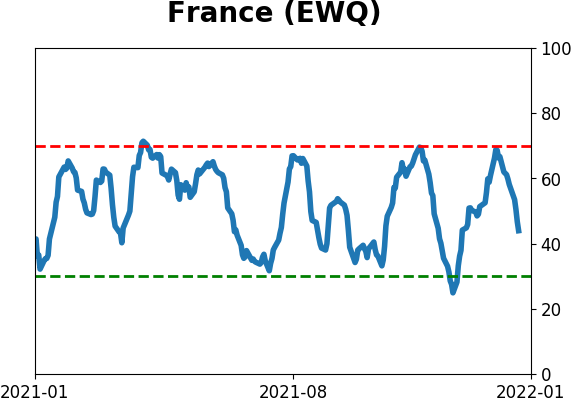
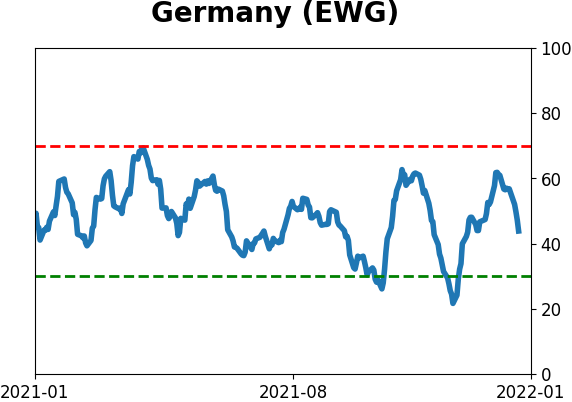
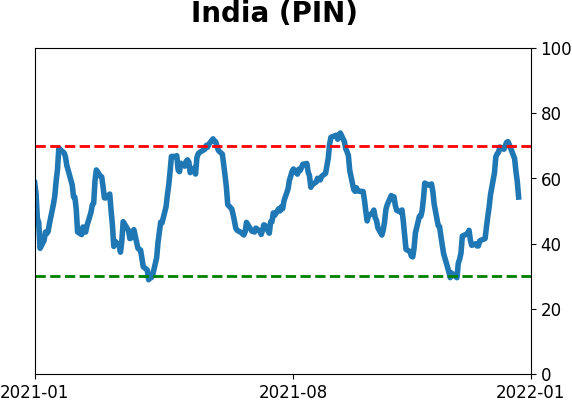
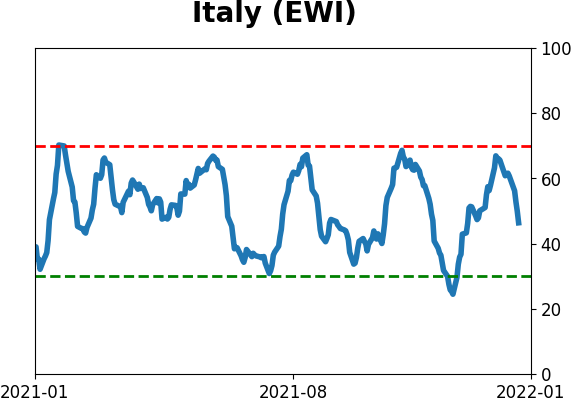
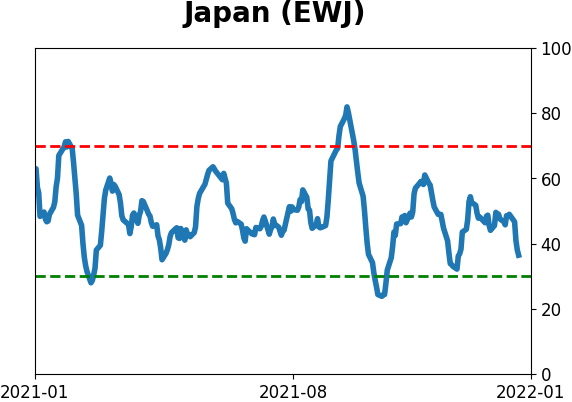
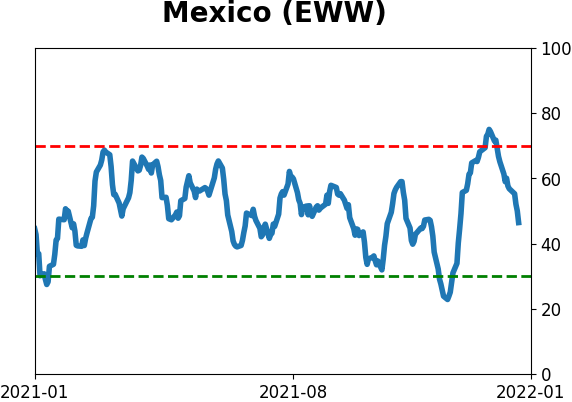
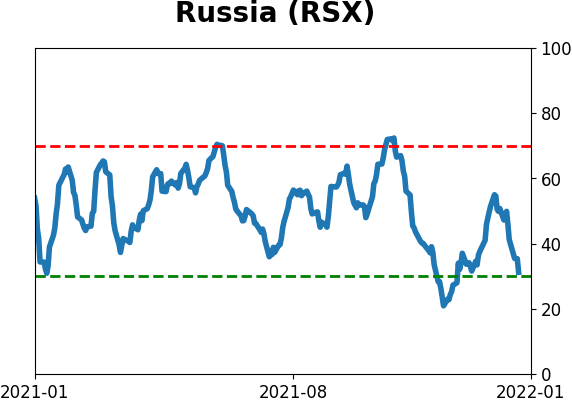
Sentiment Around The World
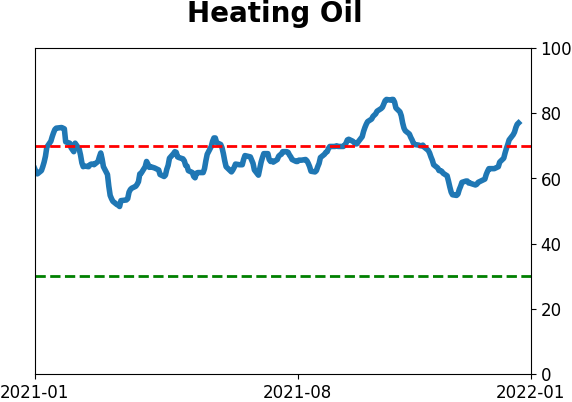
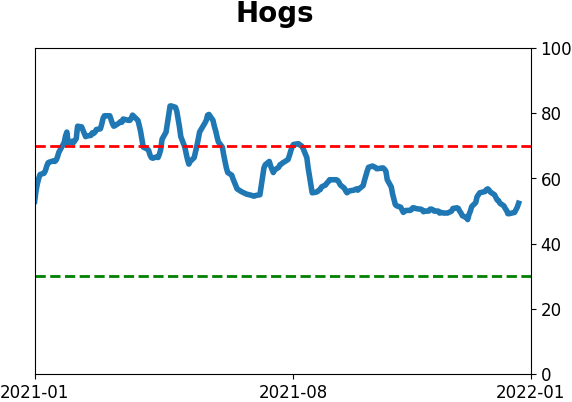
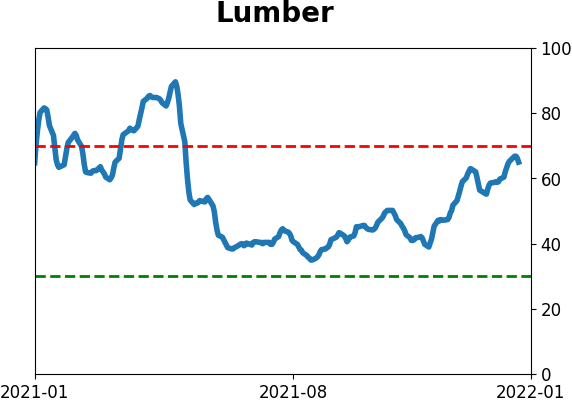
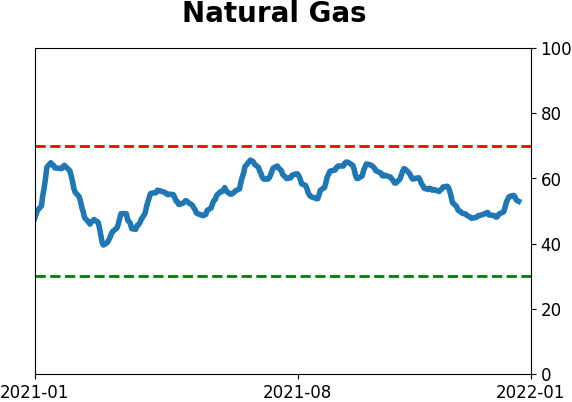
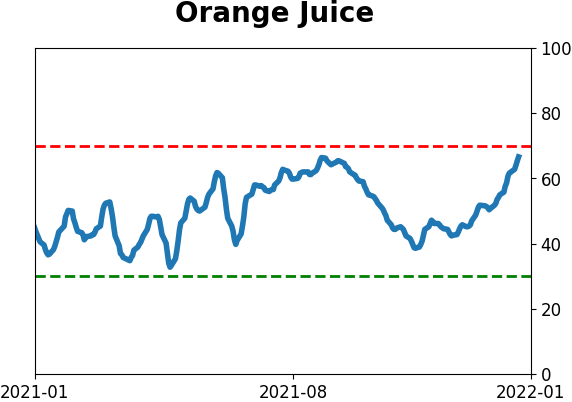
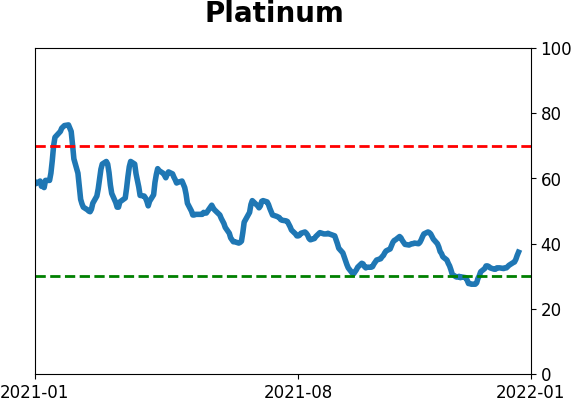
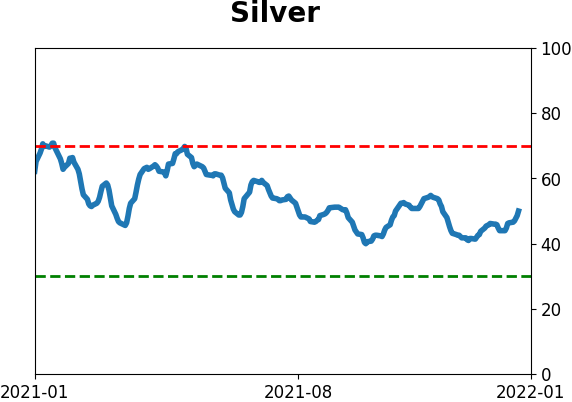
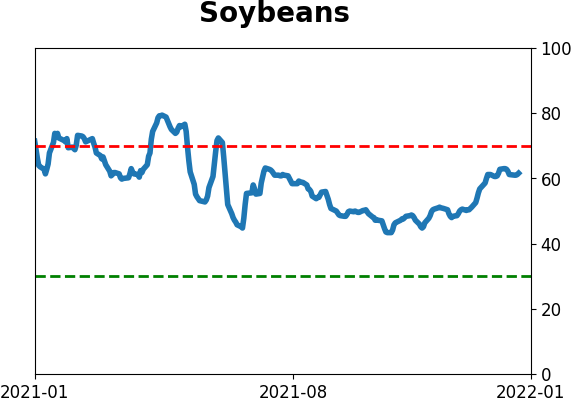
Optimism Index Thumbnails
|
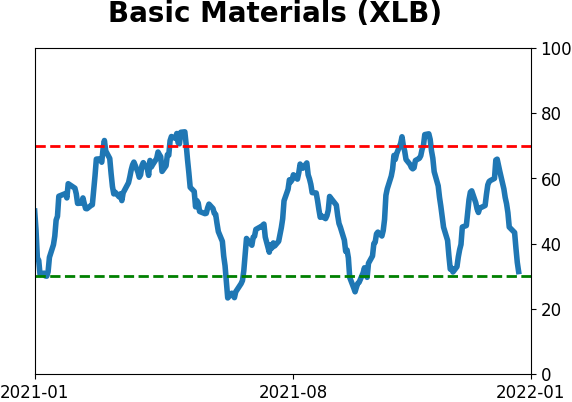
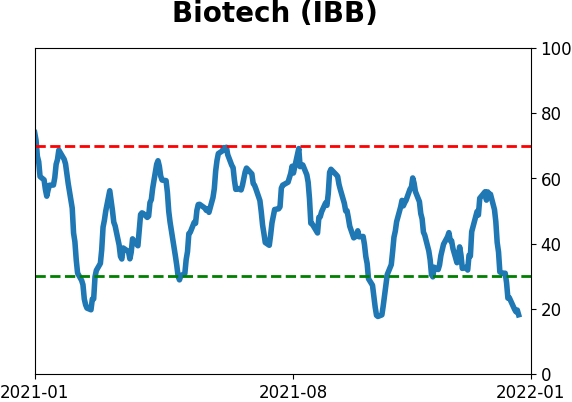
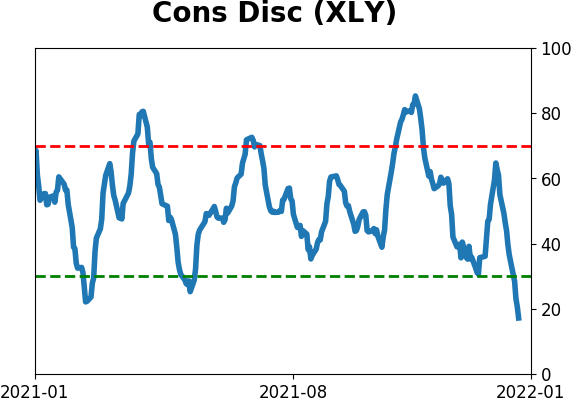
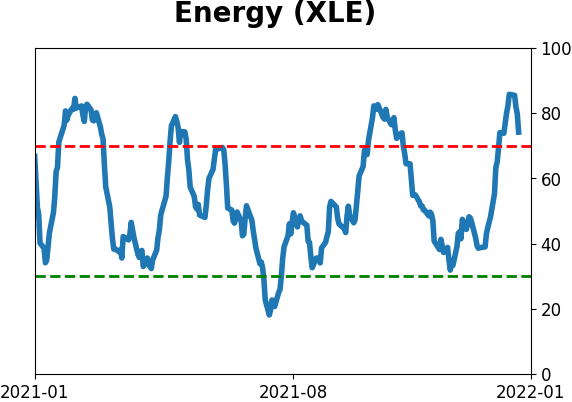
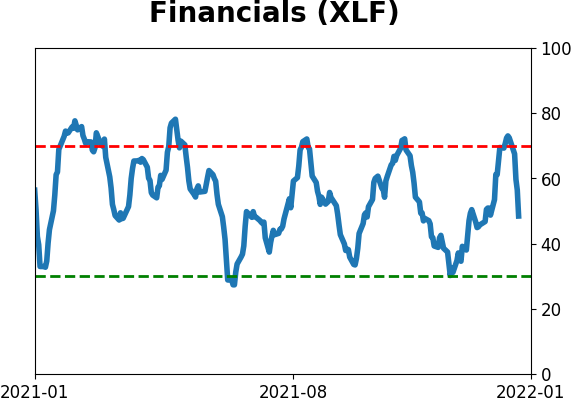
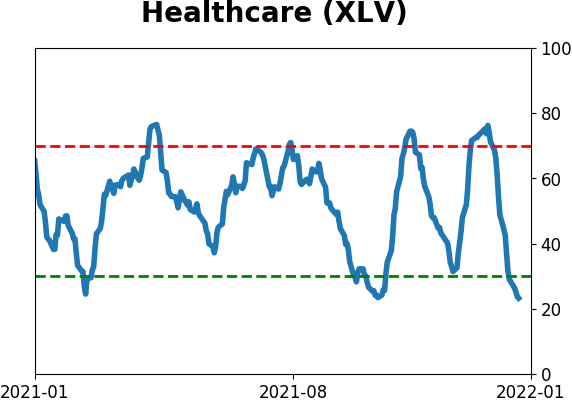
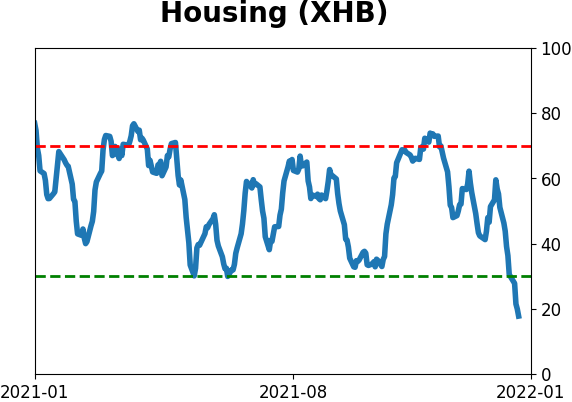
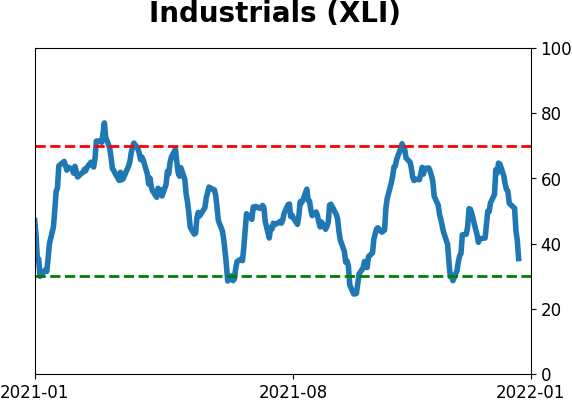
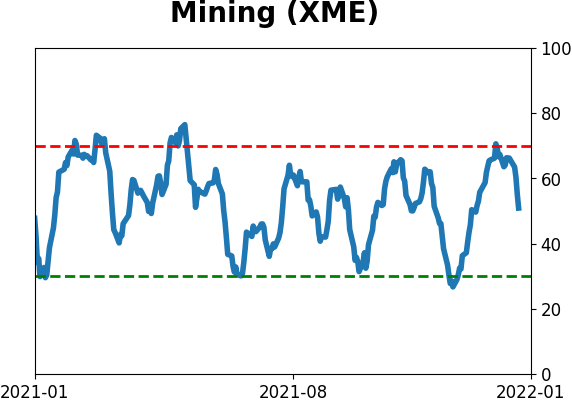
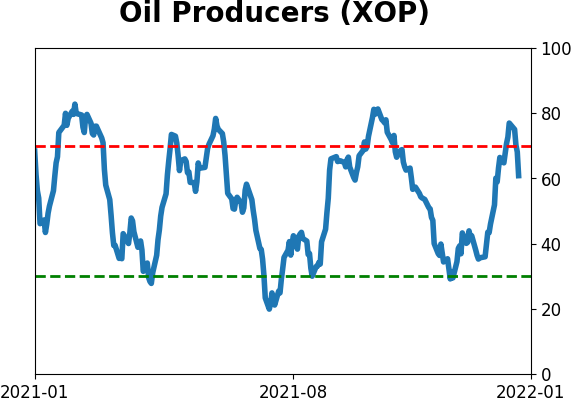
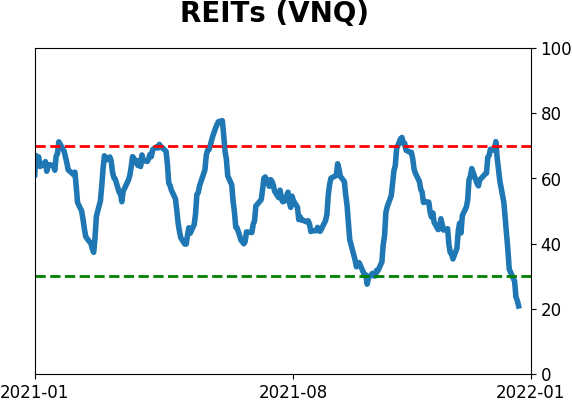
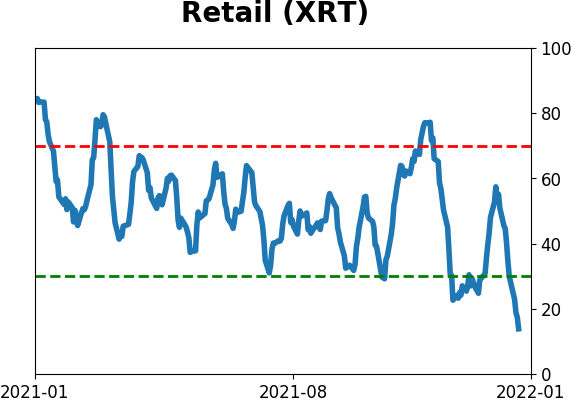
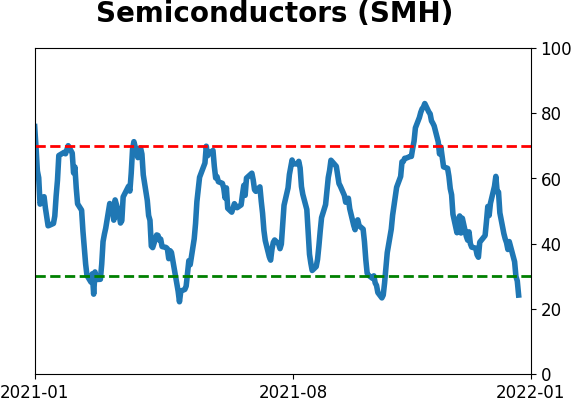
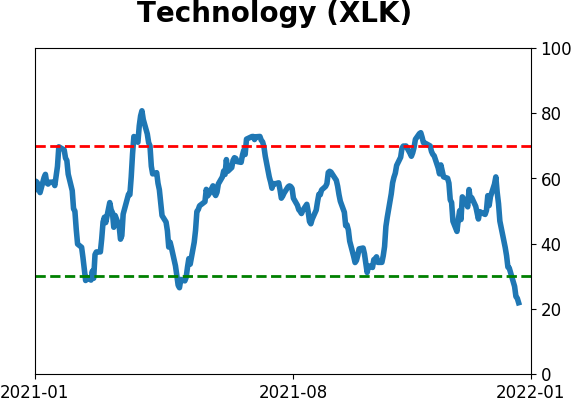
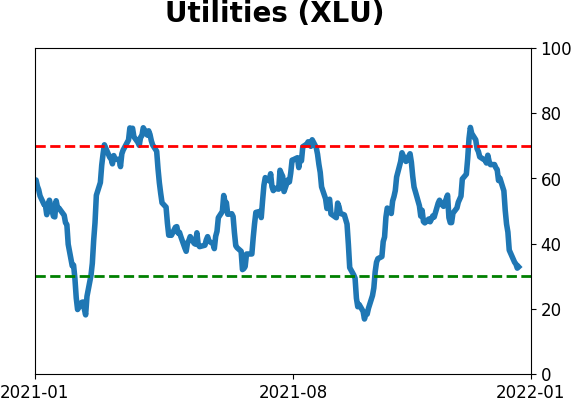
Sector ETF's - 10-Day Moving Average
|
|
|
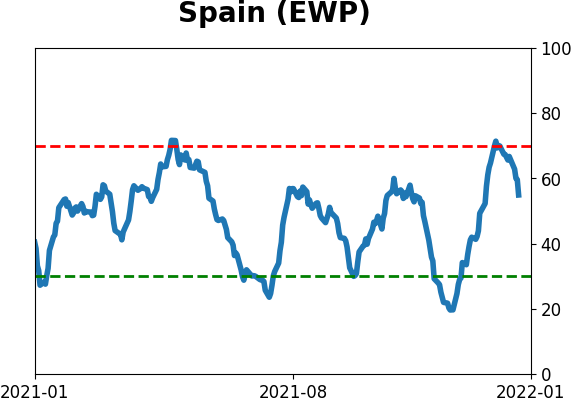
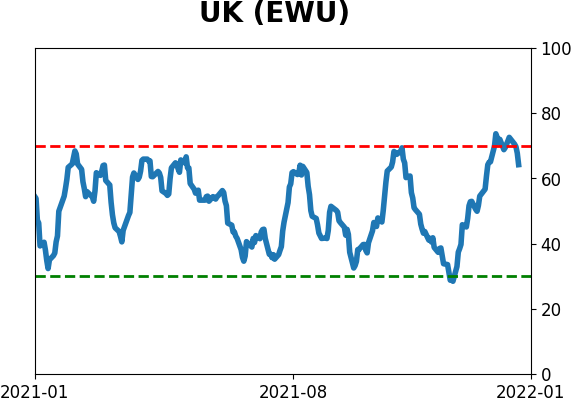
Country ETF's - 10-Day Moving Average
|
|
|
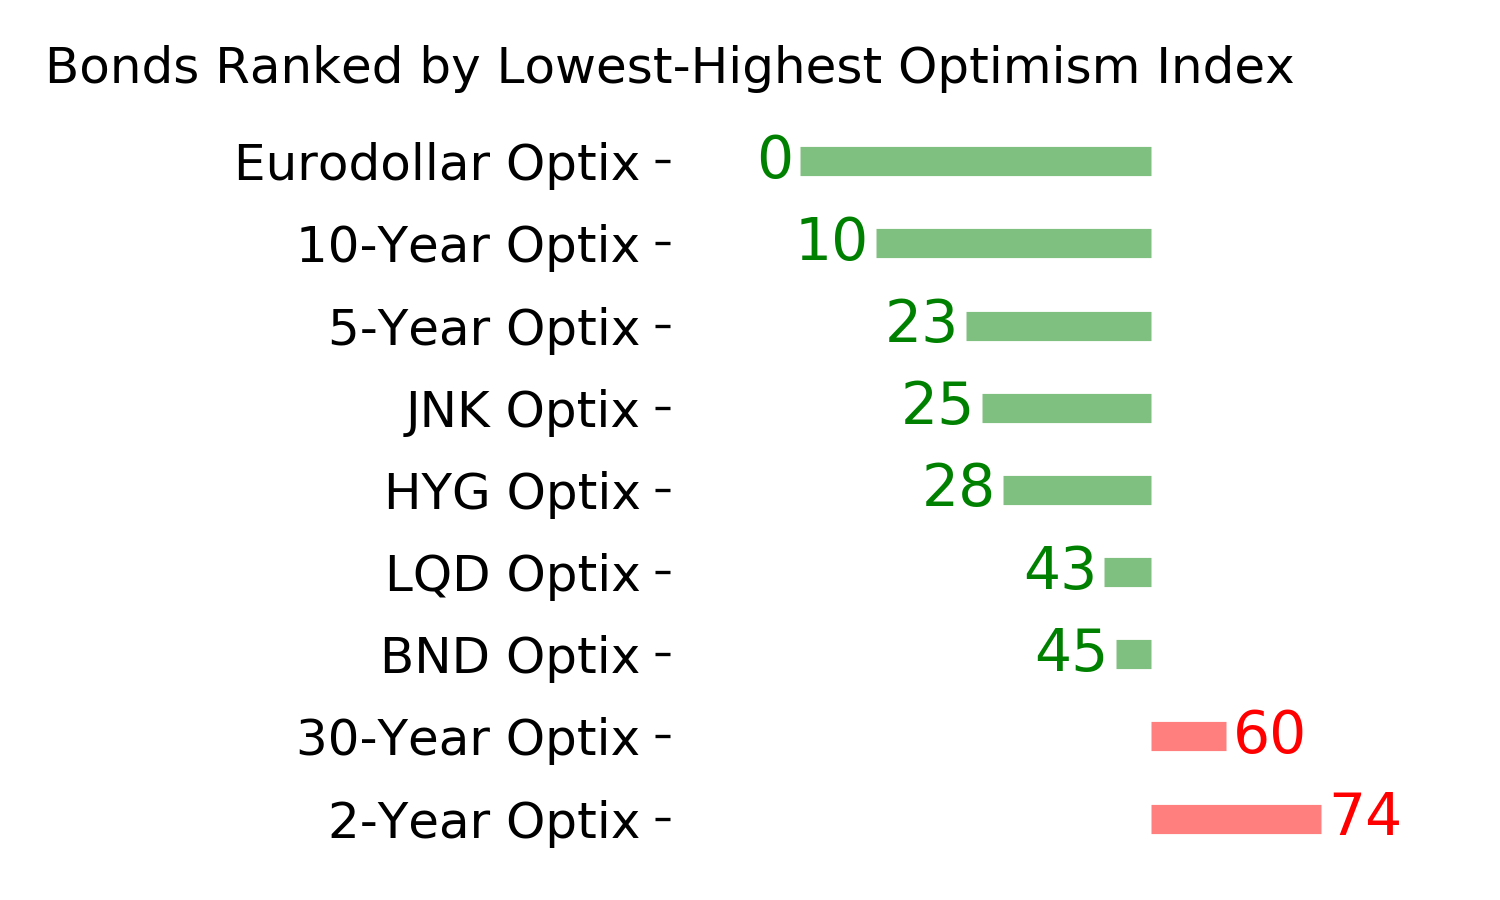
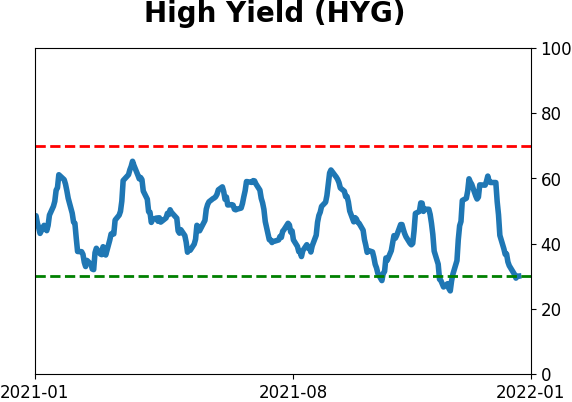
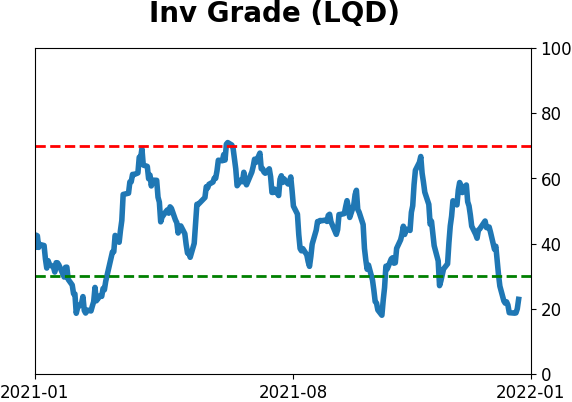
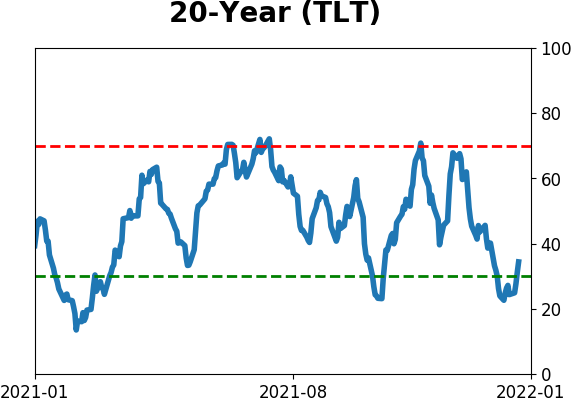
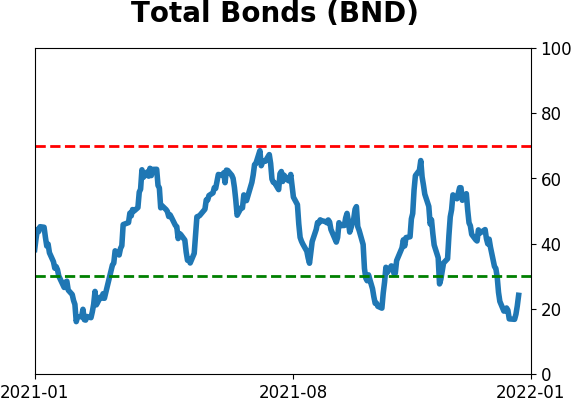
Bond ETF's - 10-Day Moving Average
|
|
|
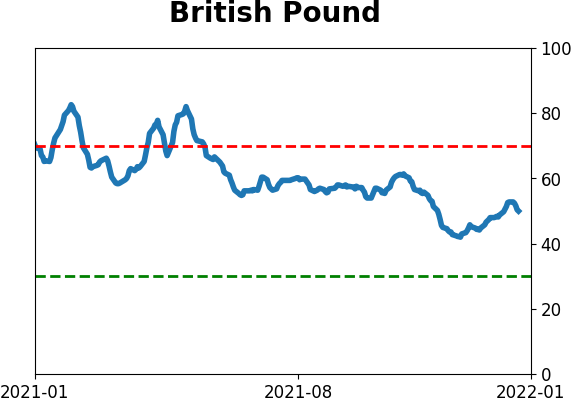
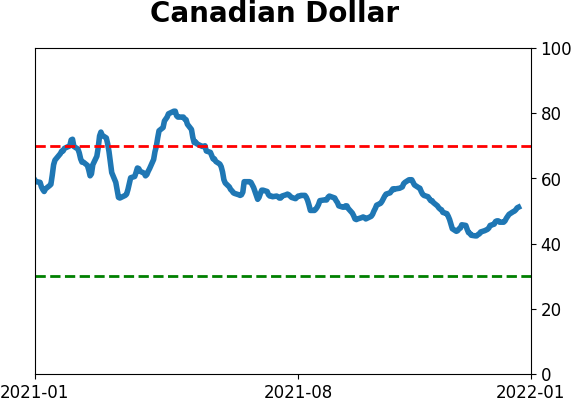
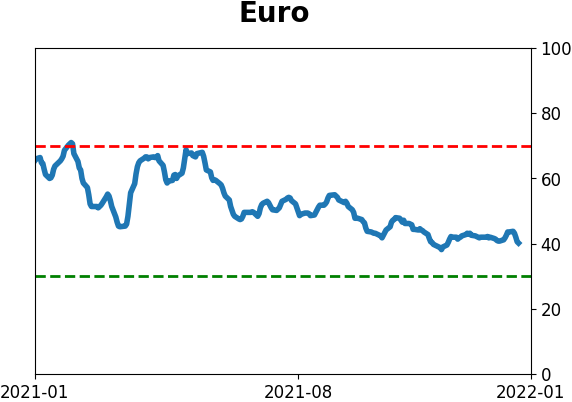
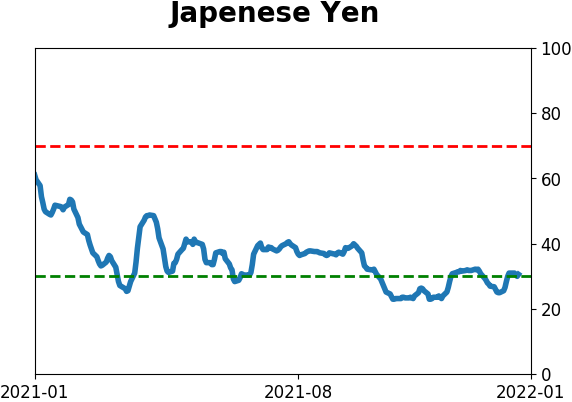
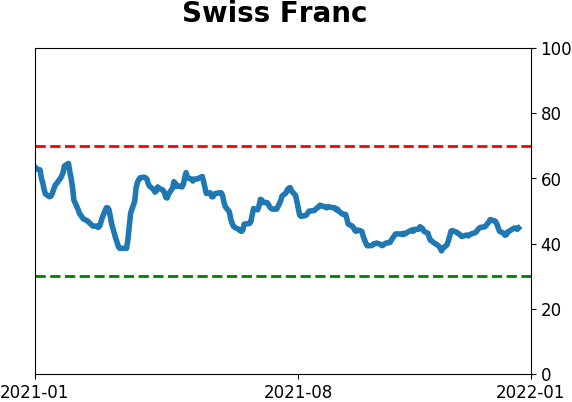
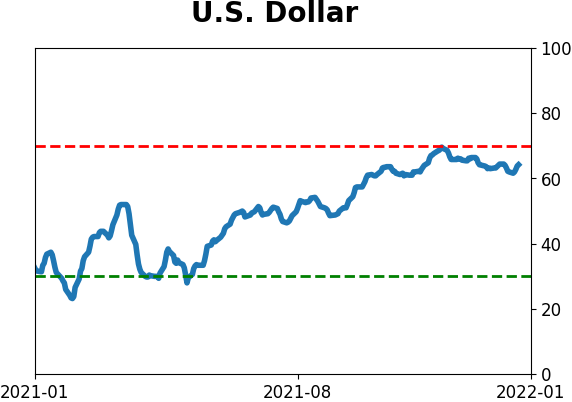
Currency ETF's - 5-Day Moving Average
|
|
|
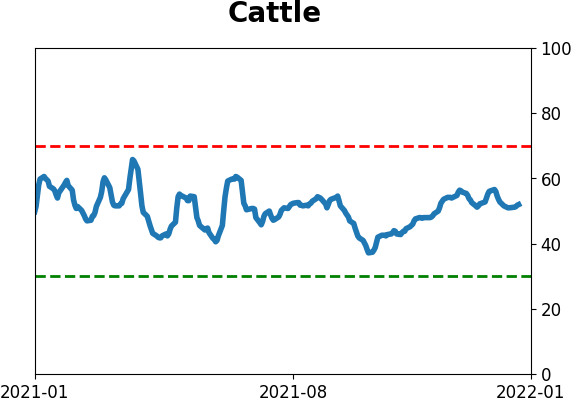
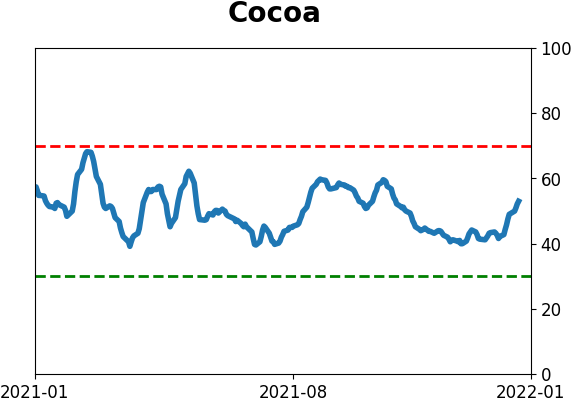
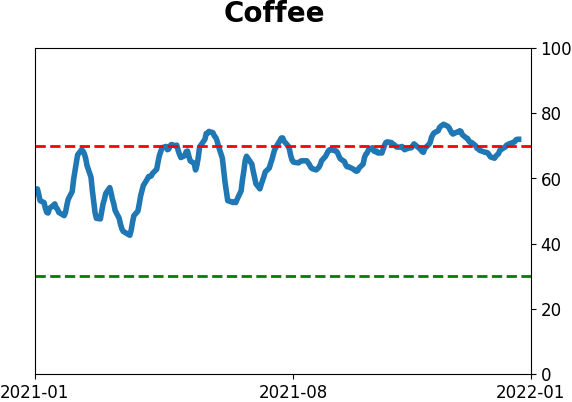
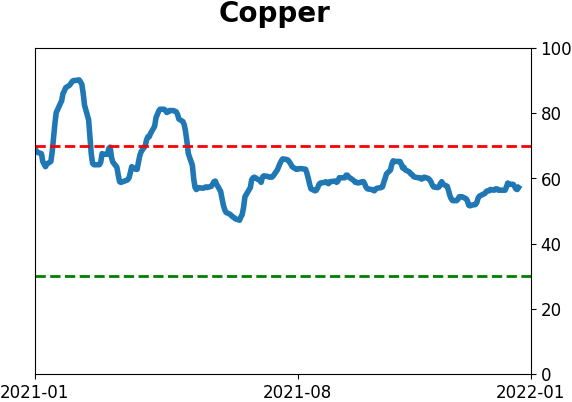
Commodity ETF's - 5-Day Moving Average
|
|