Headlines
|
|
Buying thrusts are broad, persistent, and global:
Surging securities across the NYSE in recent weeks have triggered multiple breadth thrusts. Different models, using various thresholds and lookback periods, have triggered buy signals. They have rarely, if ever, preceded losses in the S&P 500 over the following year. The same holds when there is a strong recovery in global markets in uptrends.
|
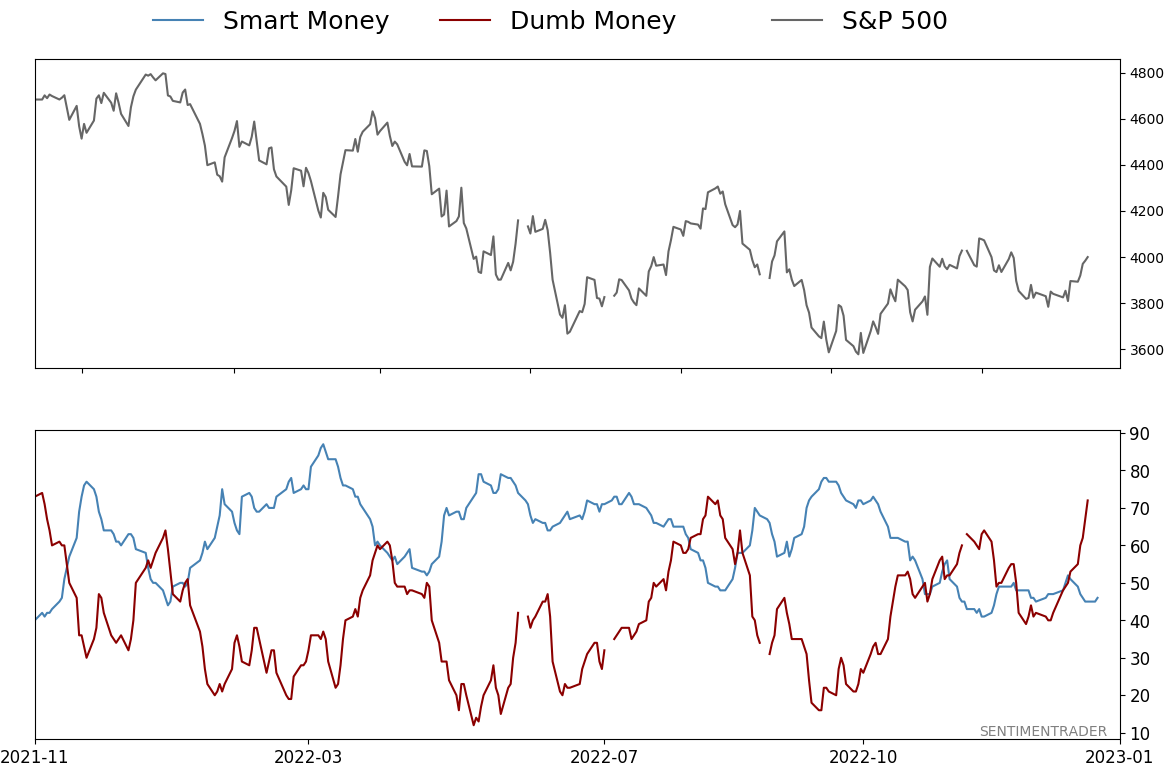
Smart / Dumb Money Confidence
|
Smart Money Confidence: 46%
Dumb Money Confidence: 72%
|
|
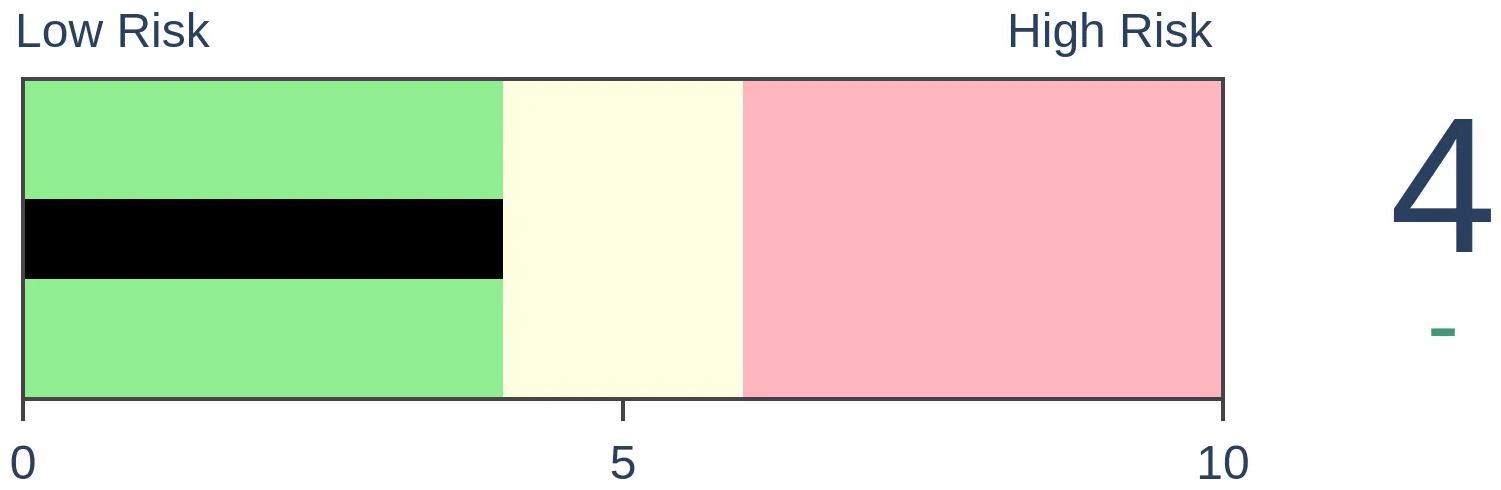
Risk Levels
Stocks Short-Term
|
Stocks Medium-Term
|
|
Bonds
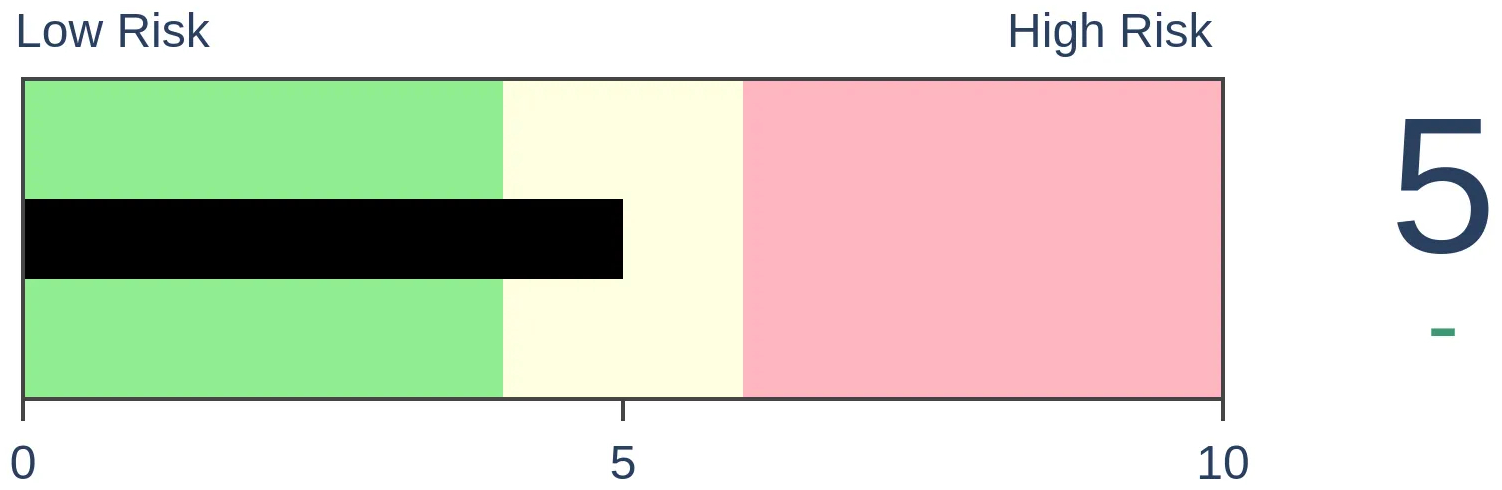
|
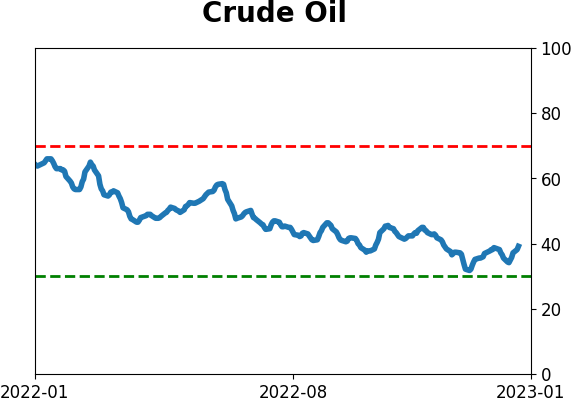
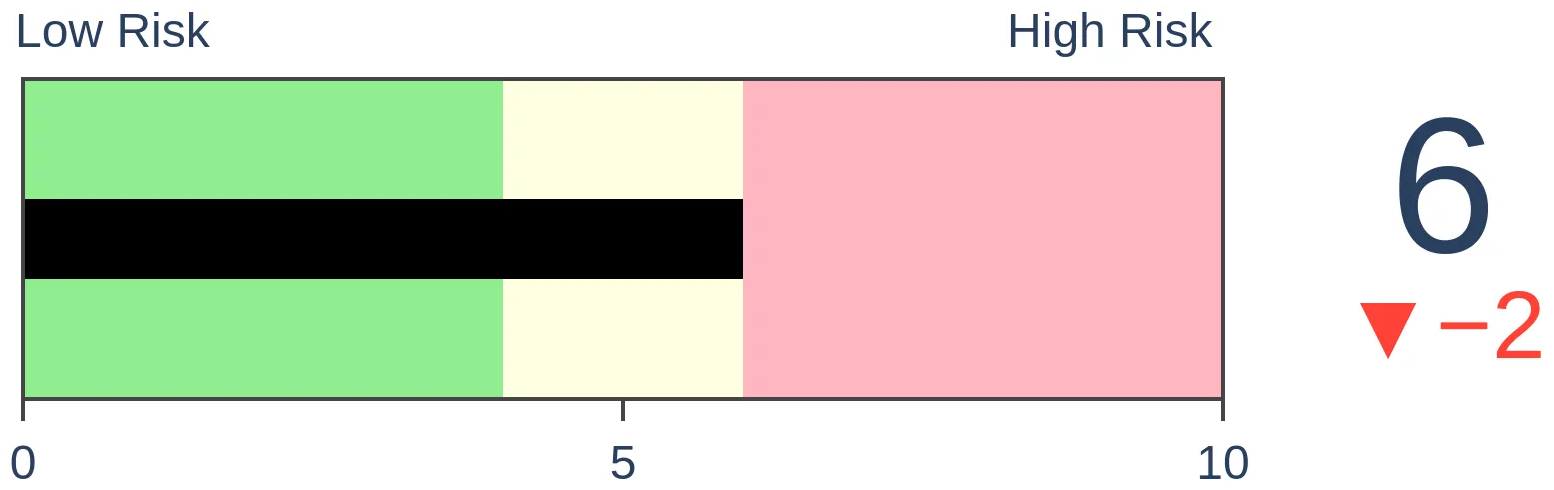
Crude Oil

|
|
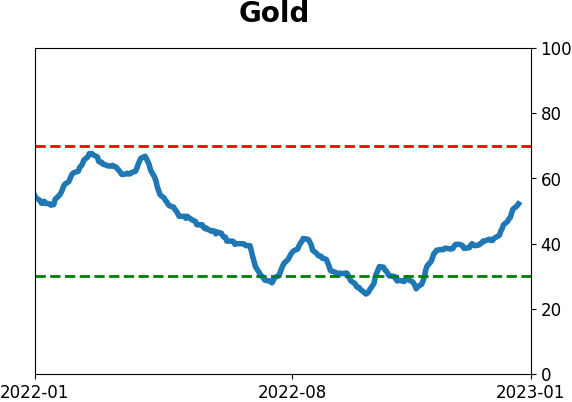
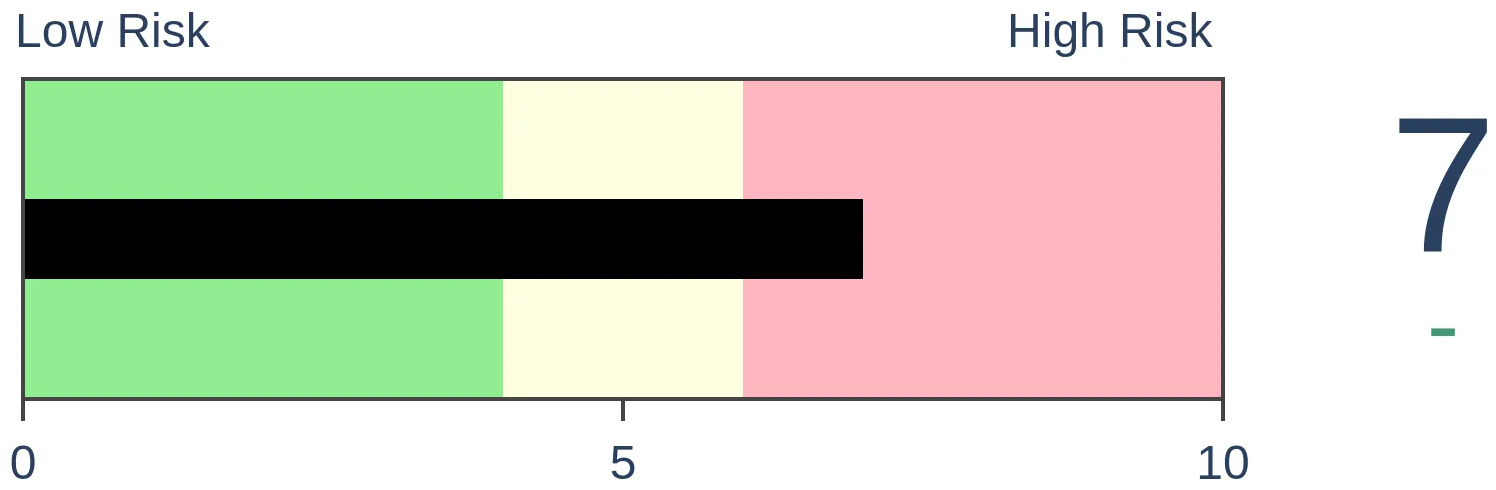
Gold

|
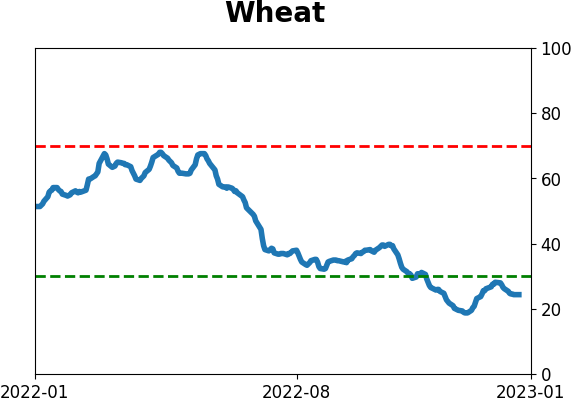
Agriculture
|
|
Research
By Jason Goepfert
BOTTOM LINE
Surging securities across the NYSE in recent weeks have triggered multiple breadth thrusts. Different models, using various thresholds and lookback periods, have triggered buy signals. They have rarely, if ever, preceded losses in the S&P 500 over the following year. The same holds when there is a strong recovery in global markets in uptrends.
FORECAST / TIMEFRAME
None
|
Key points:
- A surge in advancing securities in recent weeks has triggered multiple breadth thrusts
- Different types of systems based on NYSE data have spurred dynamic buy signals
- There has also been a strong recovery in global indexes above their 200-day moving averages
- After similar thrusts, it was rare or nonexistent to see losses in the S&P 500 over the next year
Thrust after thrust
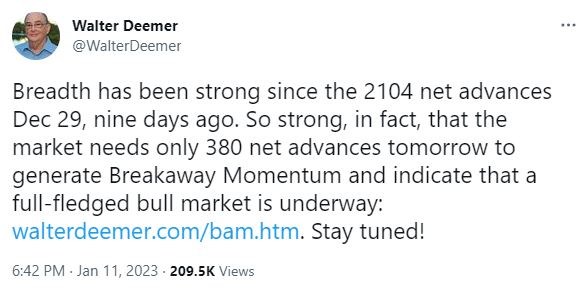
One of the original proponents of analyzing breadth thrusts, Walter Deemer, recently noted that enough securities have risen in recent days to trigger Breakaway Momentum.
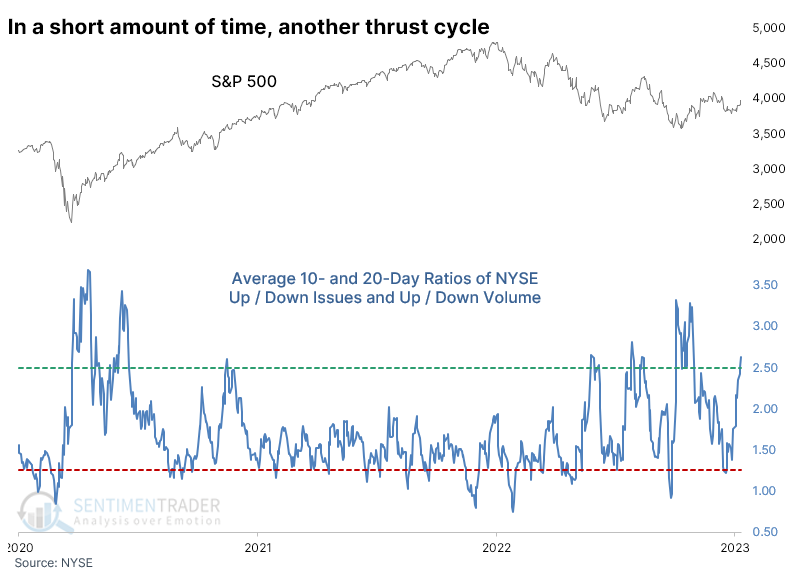
We use different data and different methodologies. There are pros and cons to using a ratio (up divided by down) versus a percentage (up divided by up + down). We've always favored the latter, which is what we show on the site. One "pro" of using the former methodology is those extremely positive days when investors overwhelmingly favor buying can quickly skew the figures and trigger thrusts. Most of those don't fail.
If we look at 10- and 20-day moving averages of both Up Issues / Down Issues and Up Volume / Down Volume, we just cycled from a relatively low reading to a high one.
When these cycles occurred within a month, and the S&P 500 was well into correction territory, it never suffered a loss over the next year. On average, it returned more than 24%, and the risk/reward was skewed heavily to the upside.
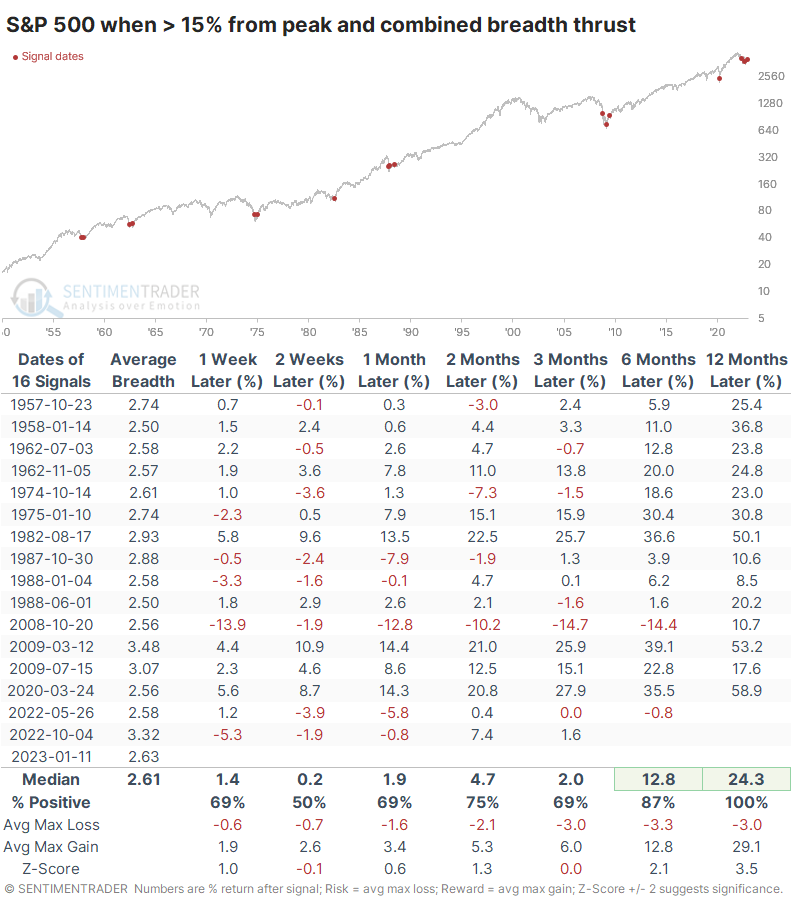
A table of maximum gains to maximum losses over each time frame shows that only three signals suffered more than a 10% drawdown at any point within the next year, while every signal rallied at least 10%.
Another type of thrust
Another type of thrust, popularized by Wayne Whaley, suffered a near-miss in April 2020, but we noted at the time why that didn't matter. It's the thought that counts. Any system that relies on an indicator going to one or two decimal points should be immediately suspect.
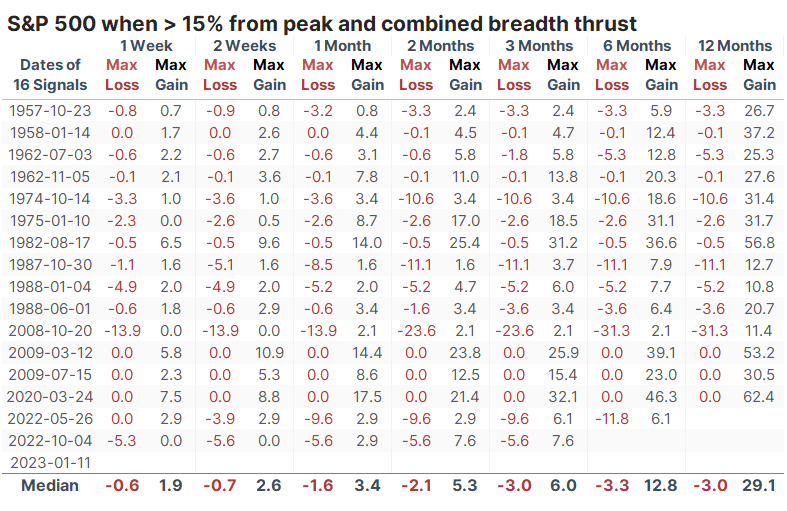
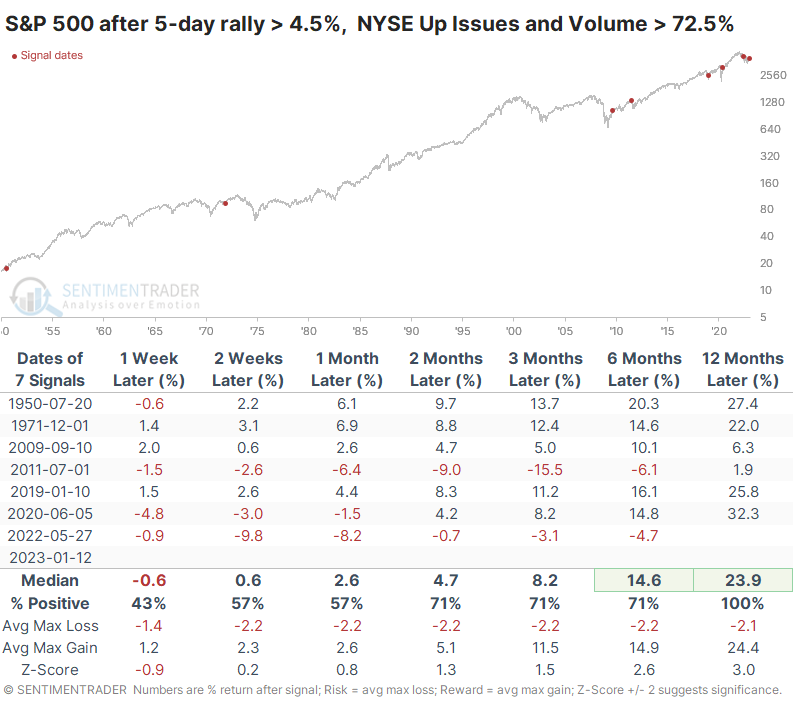
Taking some liberties with the system, the last five sessions have triggered lower thresholds. These combined thrusts are very rare, having triggered only a handful of times since 1950.
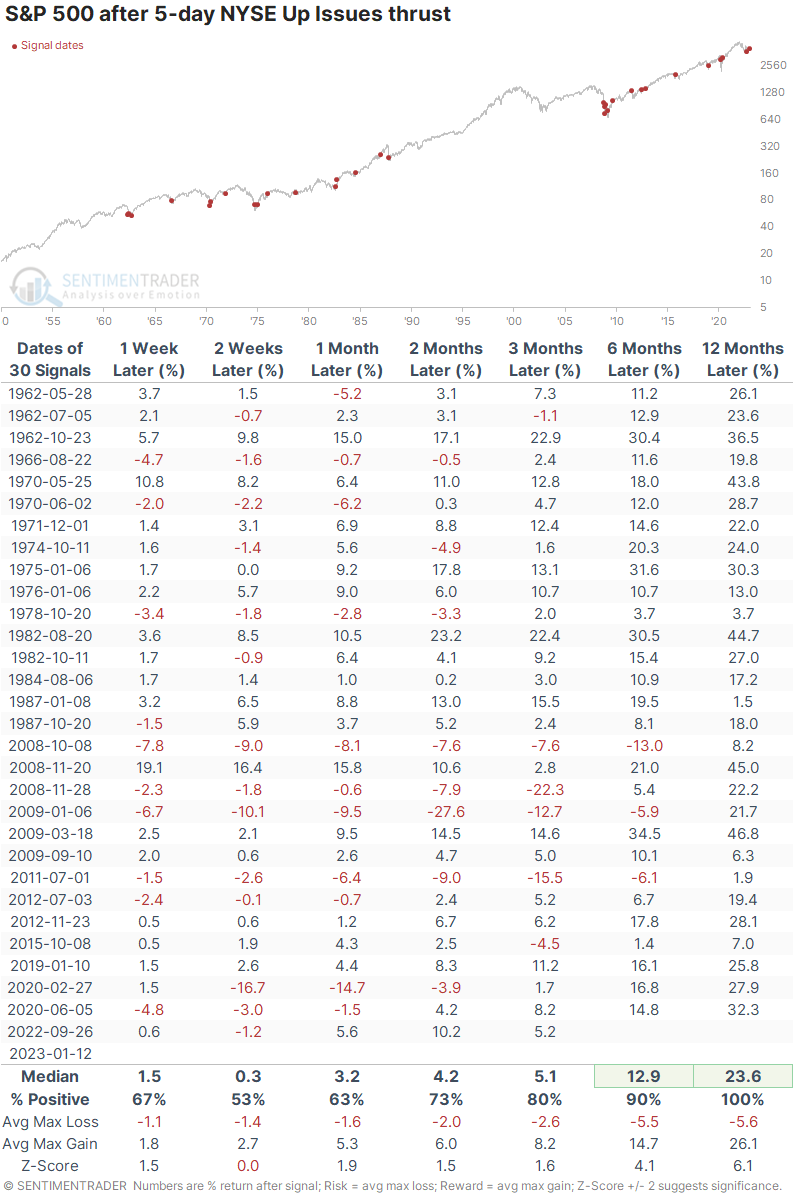
If we just focus on Whaley's original conditions for a thrust based on NYSE Up Issues alone (ignoring volume and price action), there were 30 signals since 1950. Impressively, every one preceded a positive return in the S&P 500 over the following year.
Thrusts are going global
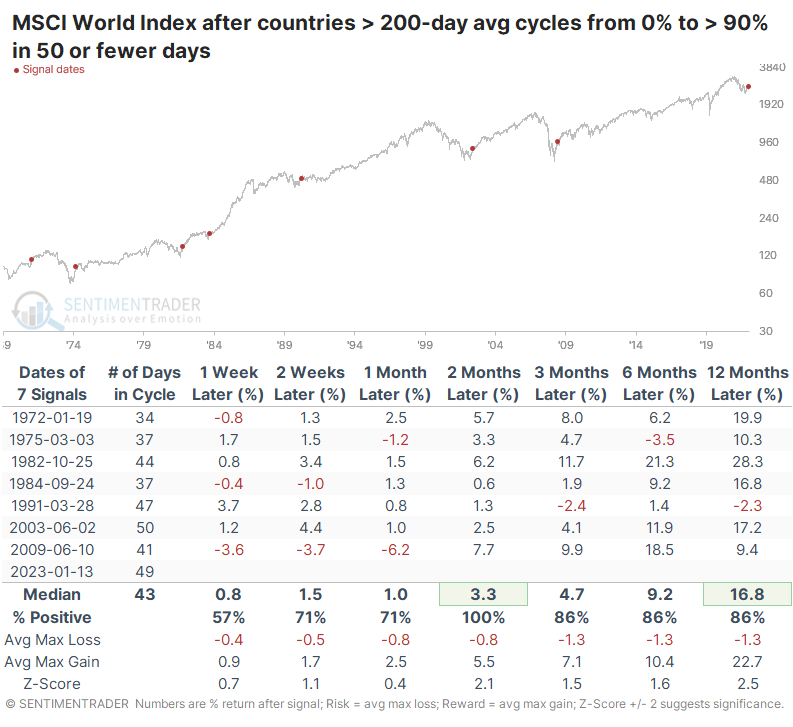
We've also noted multiple times that stocks worldwide are advancing quickly, in many cases more impressively than in the U.S. Dean showed that as of last week, no major market index was in a bear market, a remarkable recovery from 2022. Coincident to that recovery, at least 90% of them were holding above their 200-day moving average at one point last week.
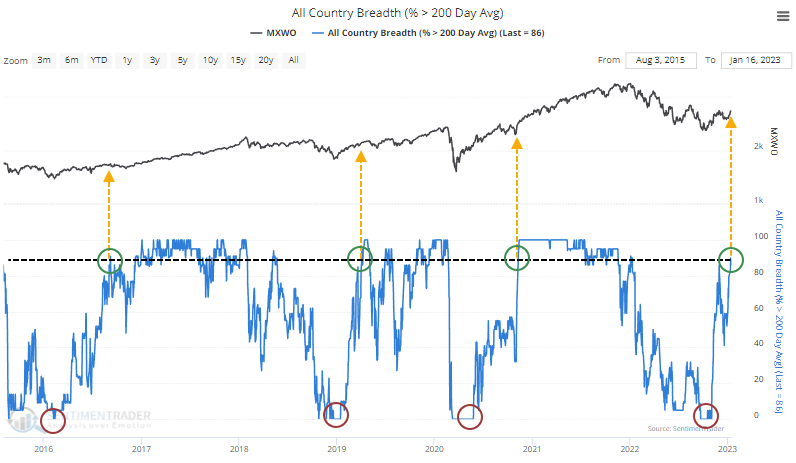
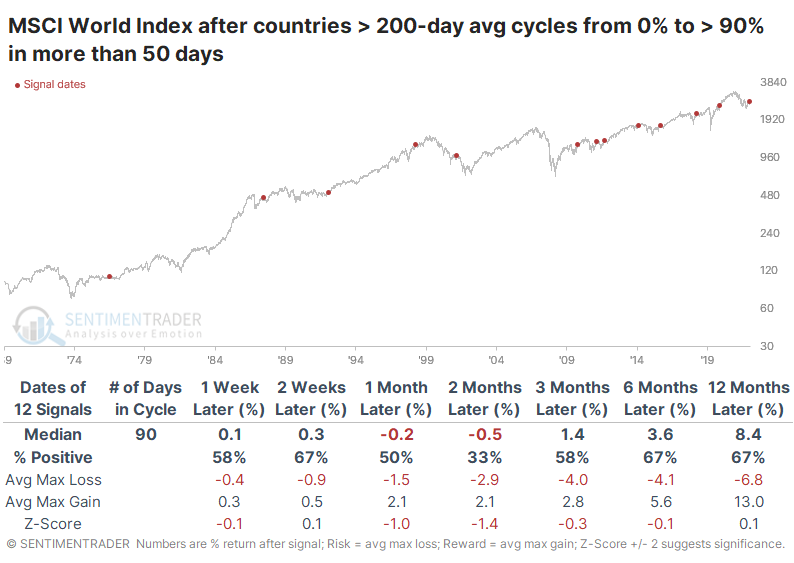
When these markets cycled from having no indexes above their 200-day average to more than 90% of them within 50 days, global stocks continued their rally in the months ahead.
When the recoveries took longer - on average, twice as long - forward returns were significantly lower and more prone to limited gains and large losses.
What the research tells us...
Like many of you probably are, I'm tired of hearing about breadth thrusts. They arguably triggered several times last year and inarguably failed. With the increasing accessibility of data and software, the concepts of breadth and related movements have become commonplace and likely overdone. It's very possible that any edge gleaned from these over the decades has softened and maybe even evaporated, at least for the broader U.S. stock market.
That said, on Friday, Dean noted that thrusts are occurring across exchanges and even within sectors, factors, and other markets like bonds. When there are coordinated bursts of buying pressure like this, it has boded very well for future returns. We can add global indexes to the list of markets seeing overwhelming buying interest. Of course, this isn't the first time there has been a wave of buying pressure during the bear market, but it is the first time it has occurred to this degree and is broader than prior attempts. Behavior like this, to this magnitude, persistence, and breadth, is exceptionally rare during ongoing bear markets. It is almost entirely relegated to the initial thrusts of new, protracted bull markets.
Indicators at Extremes
Phase Table
Ranks
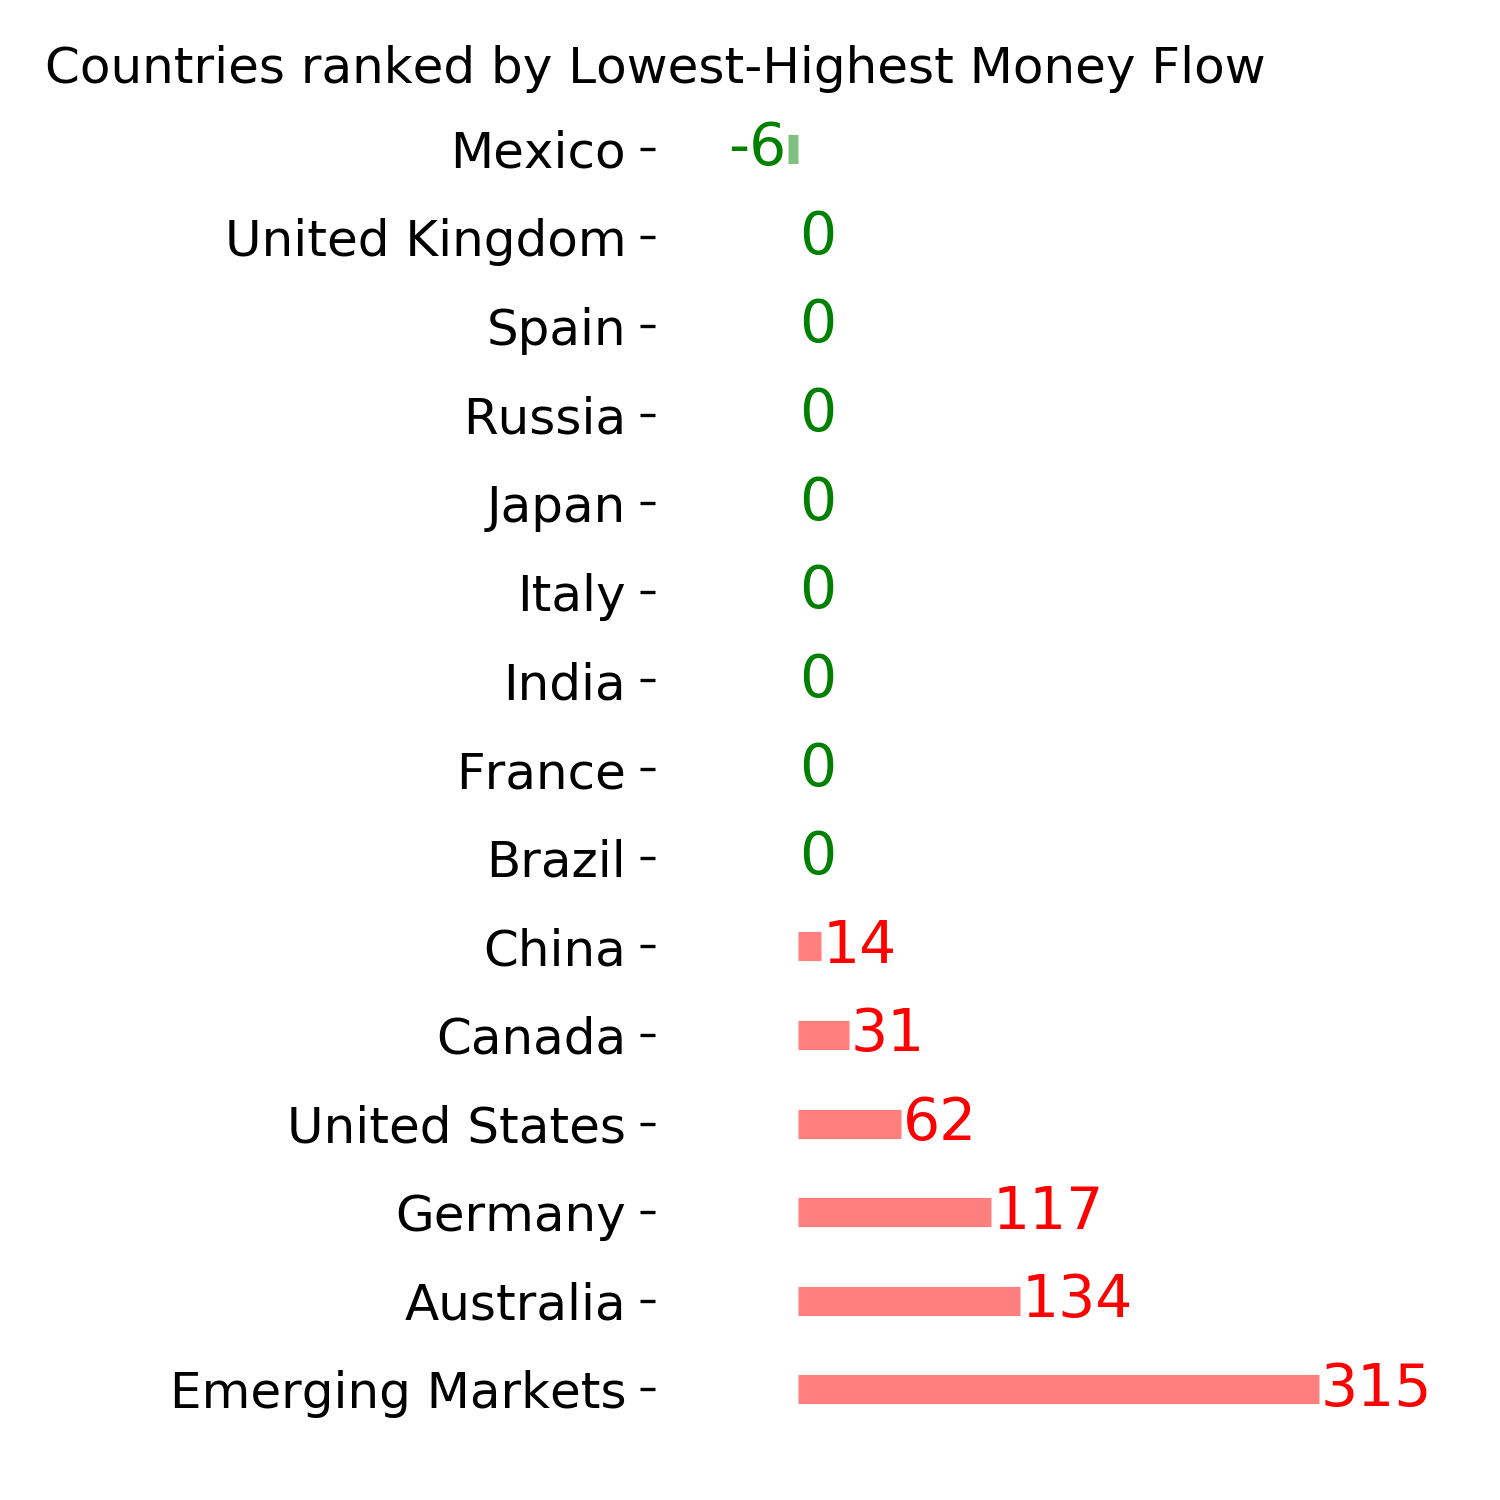
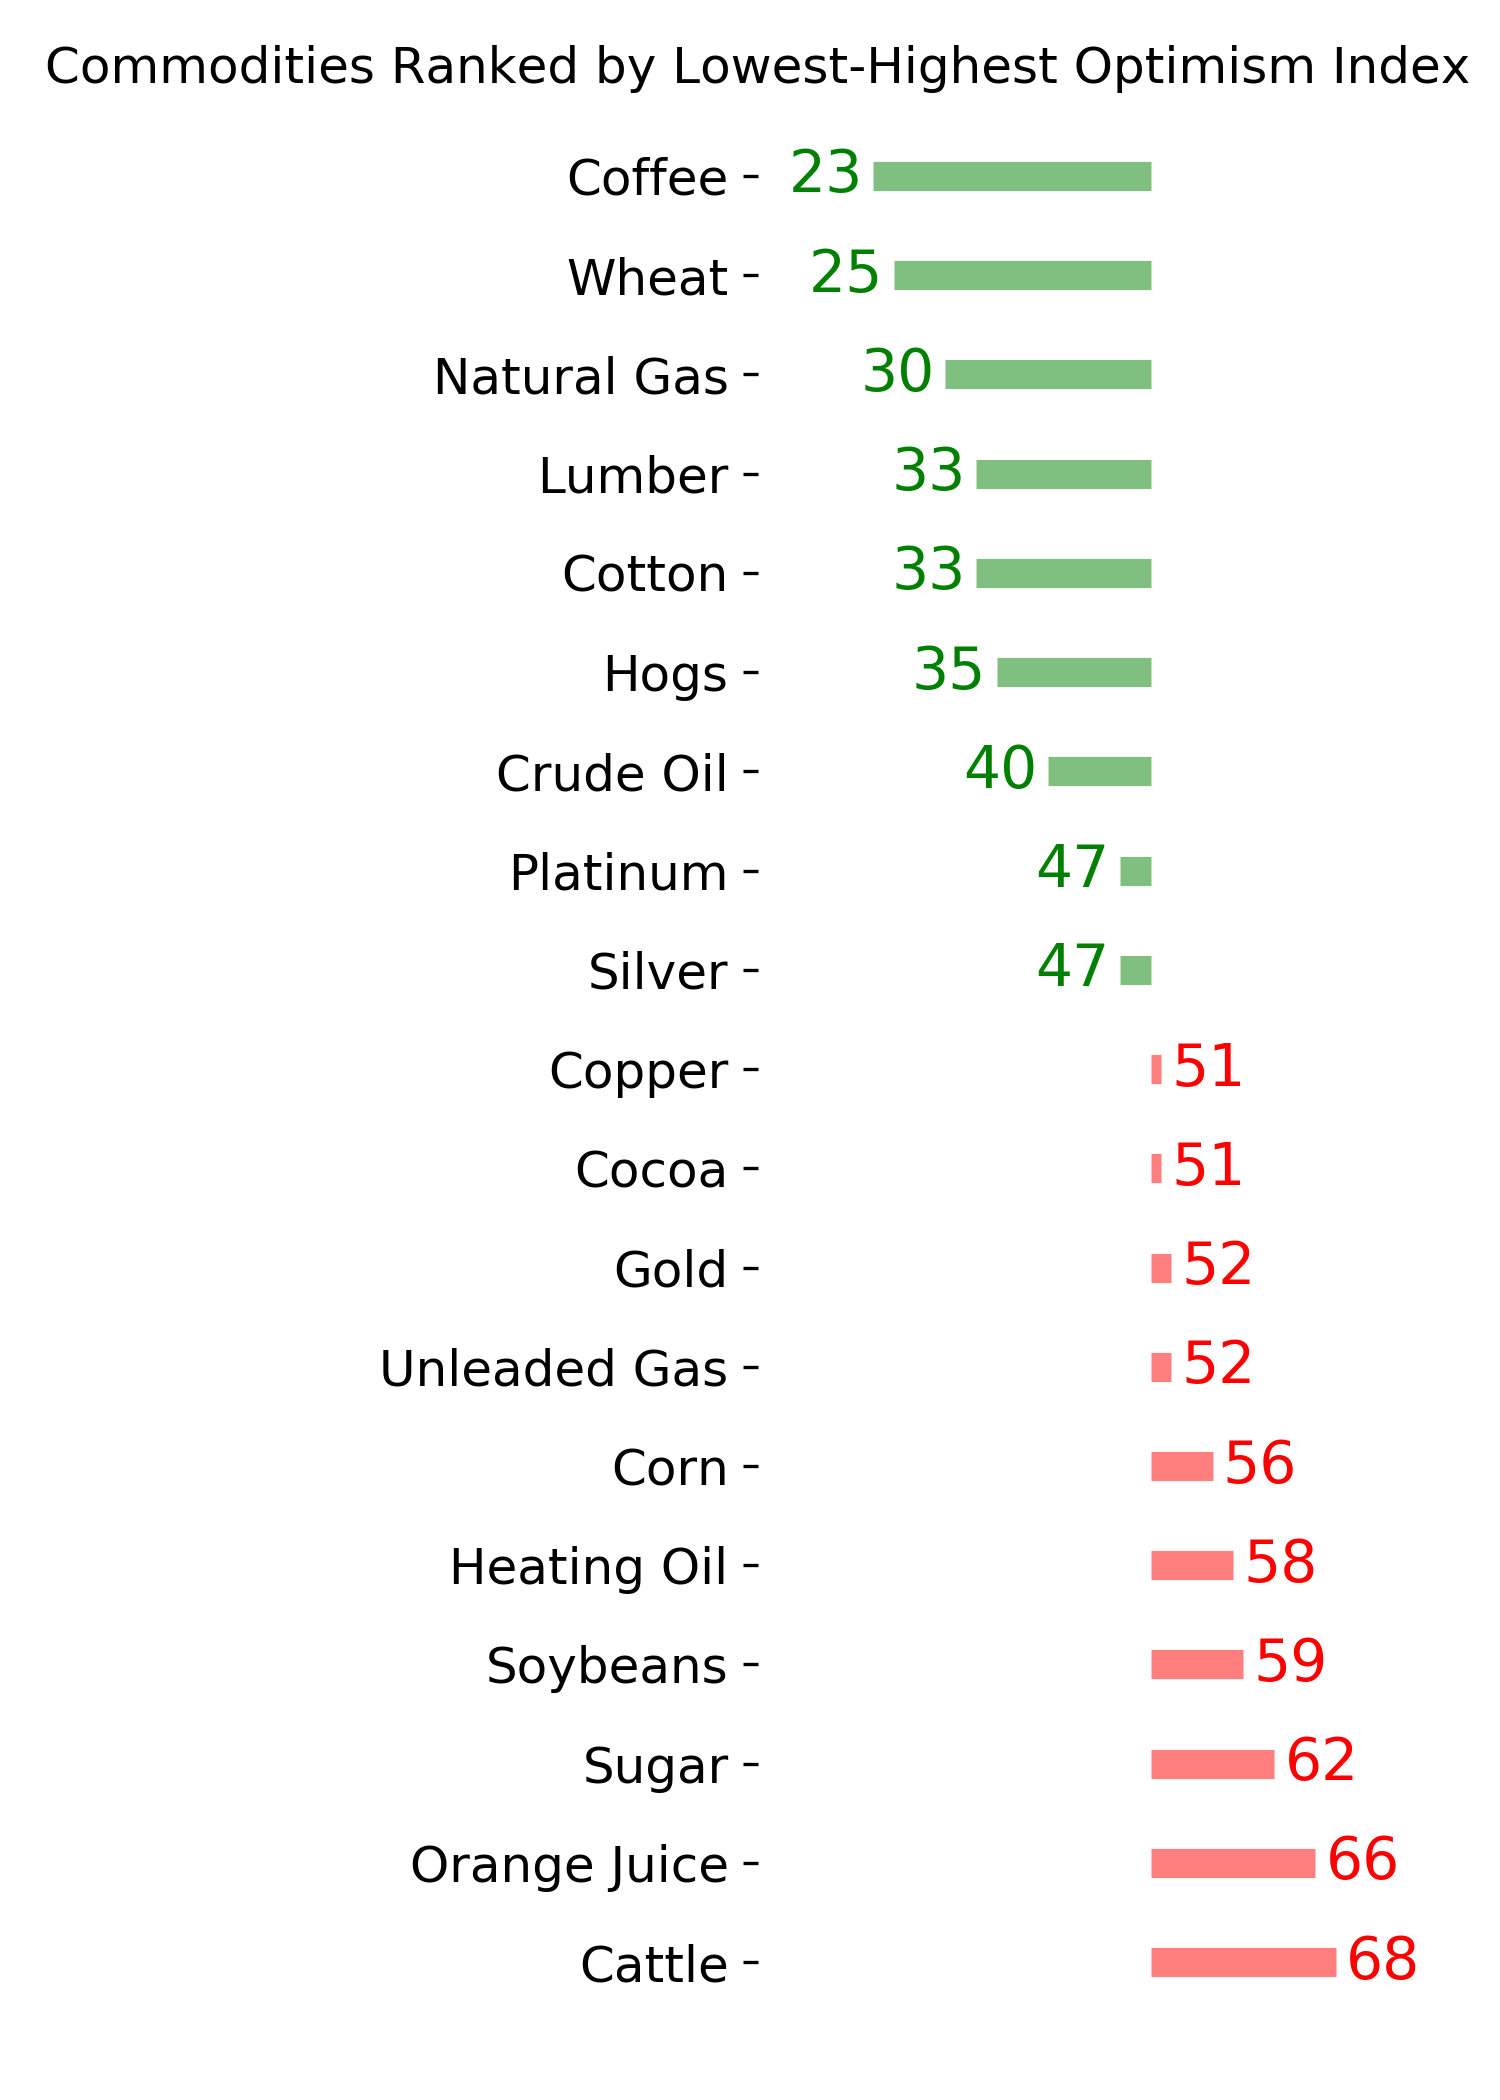
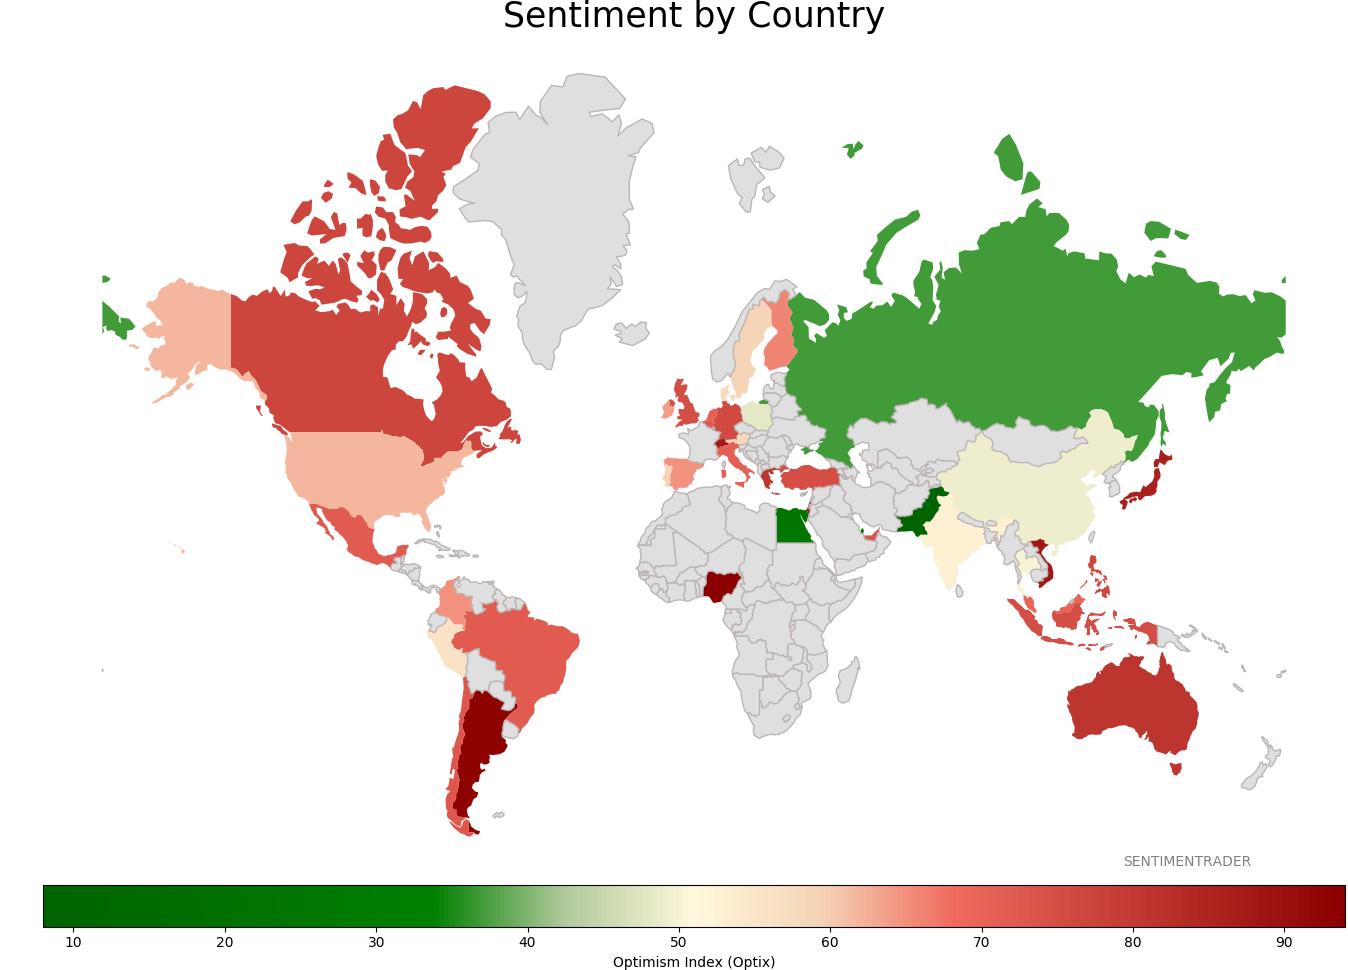
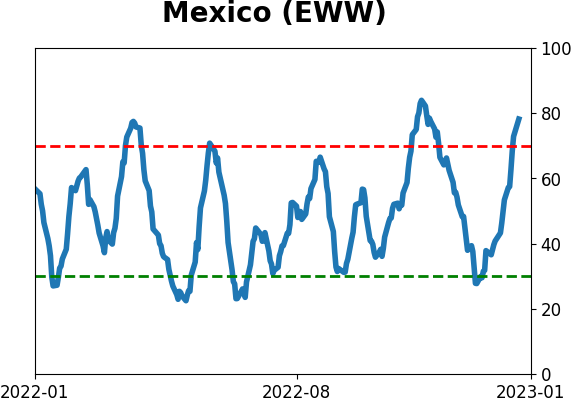
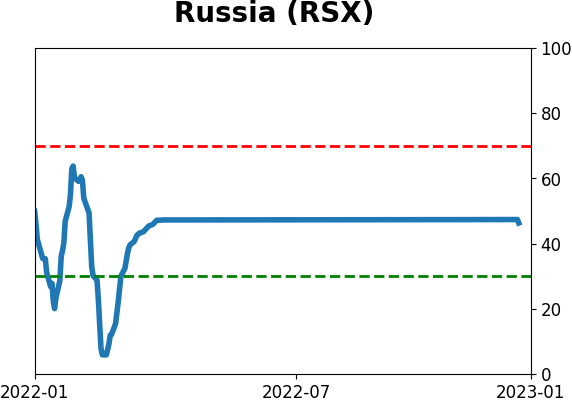
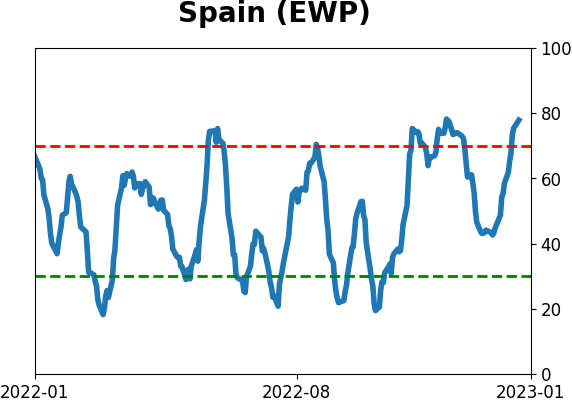
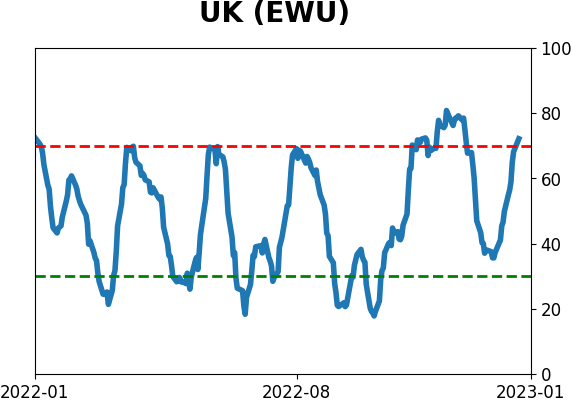
Sentiment Around The World
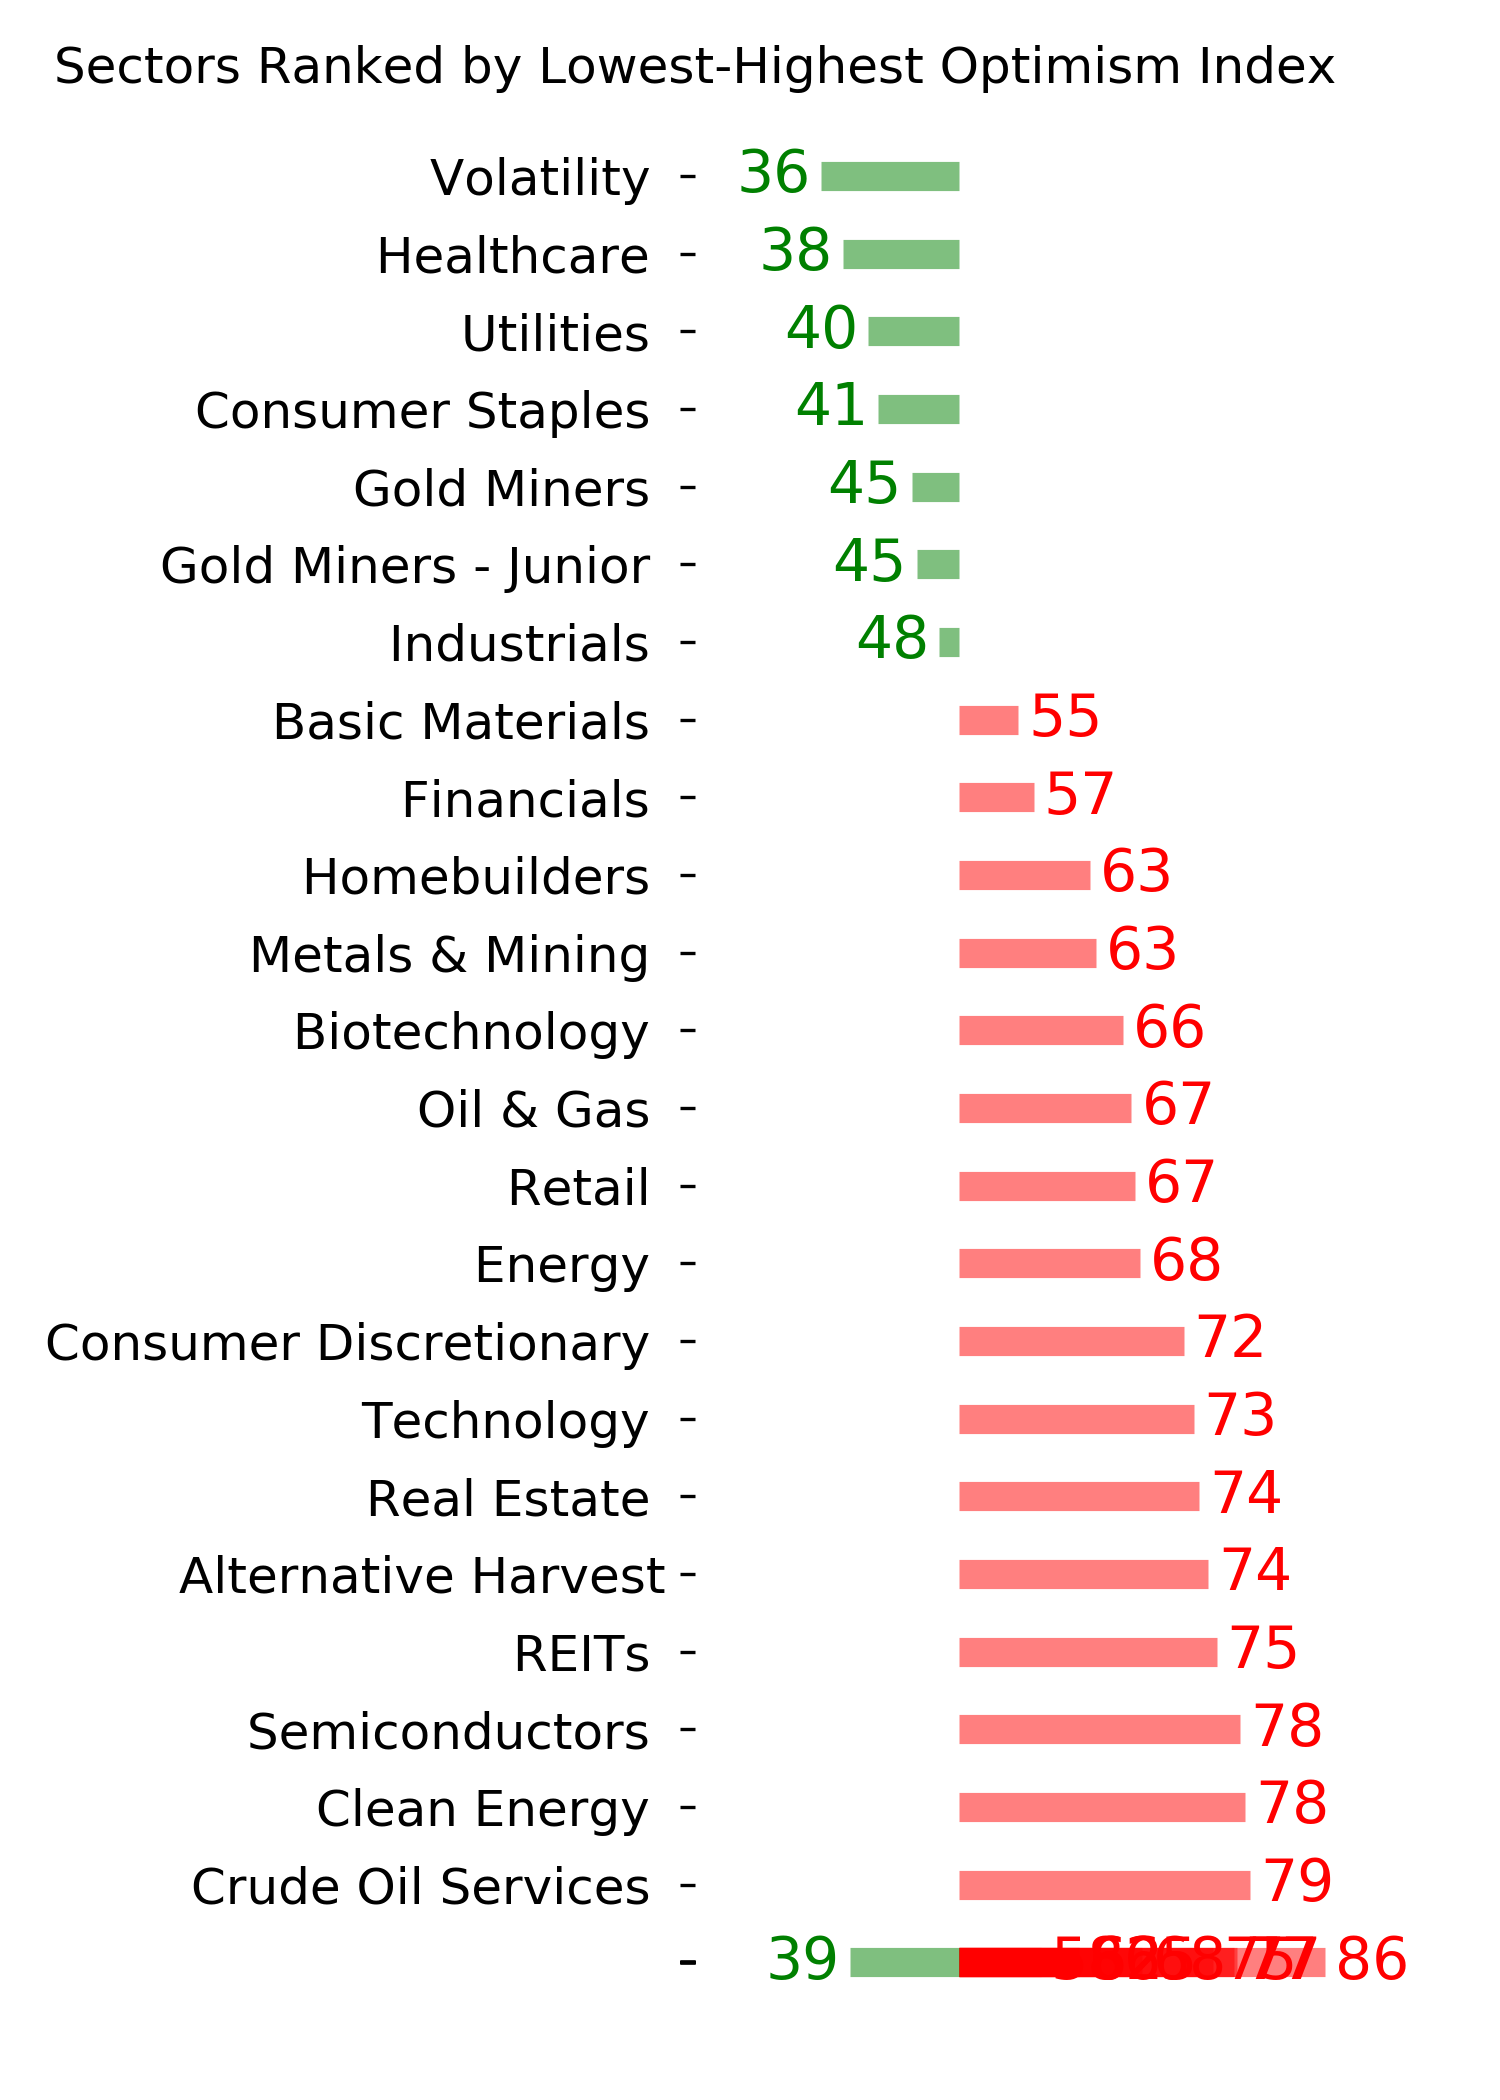
Optimism Index Thumbnails
|
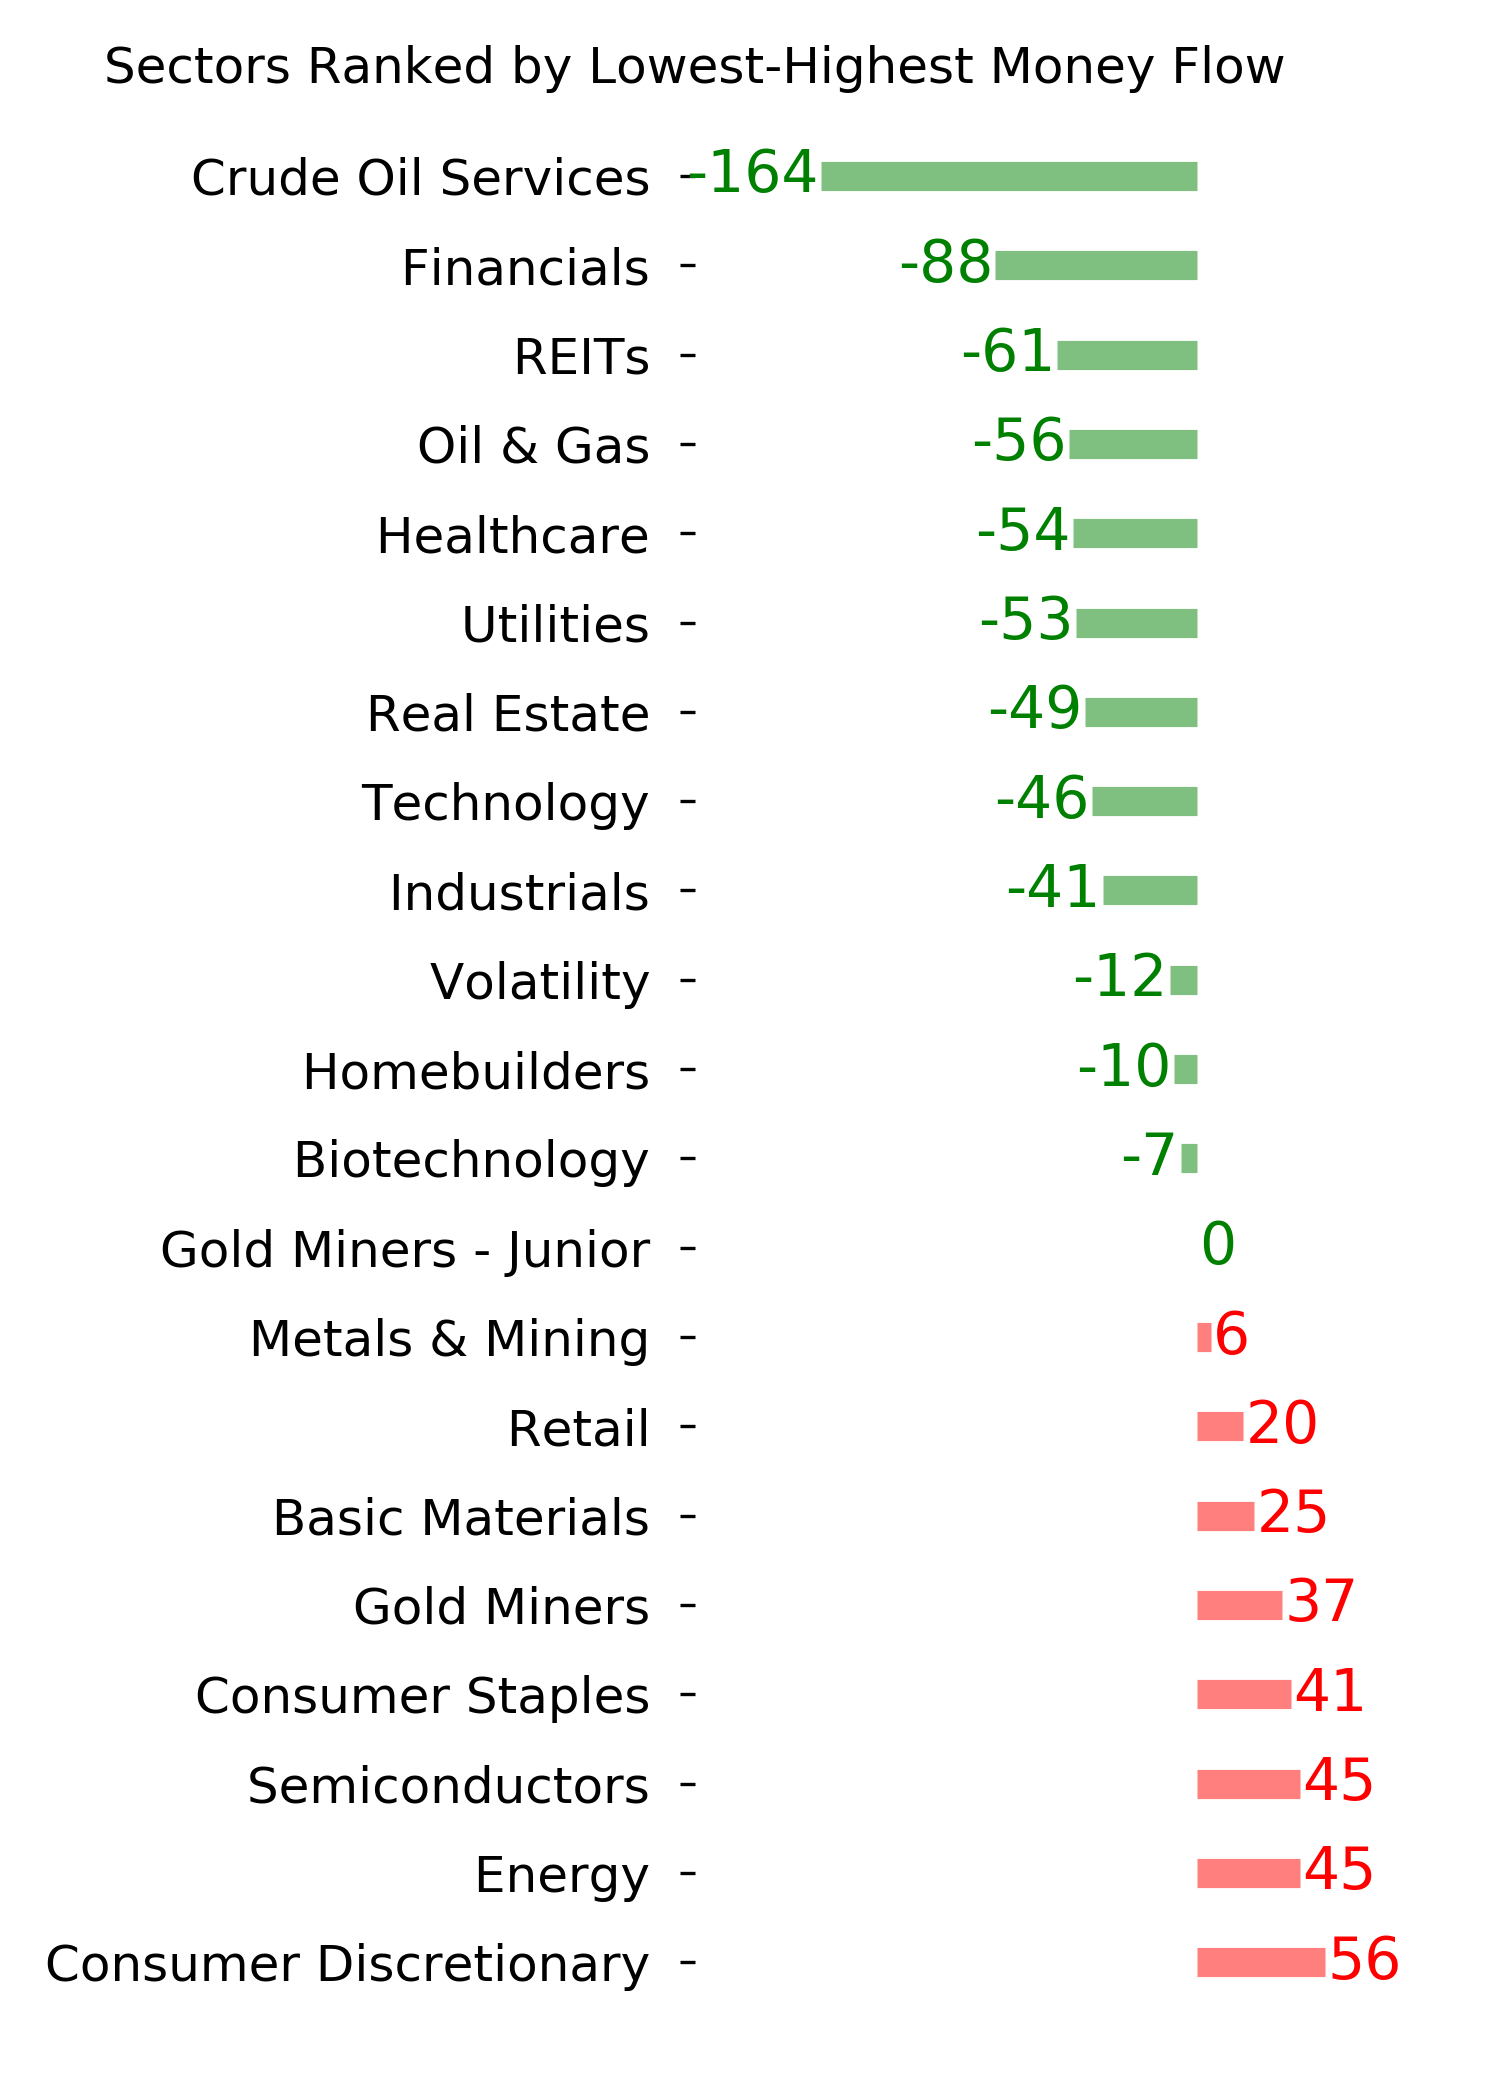
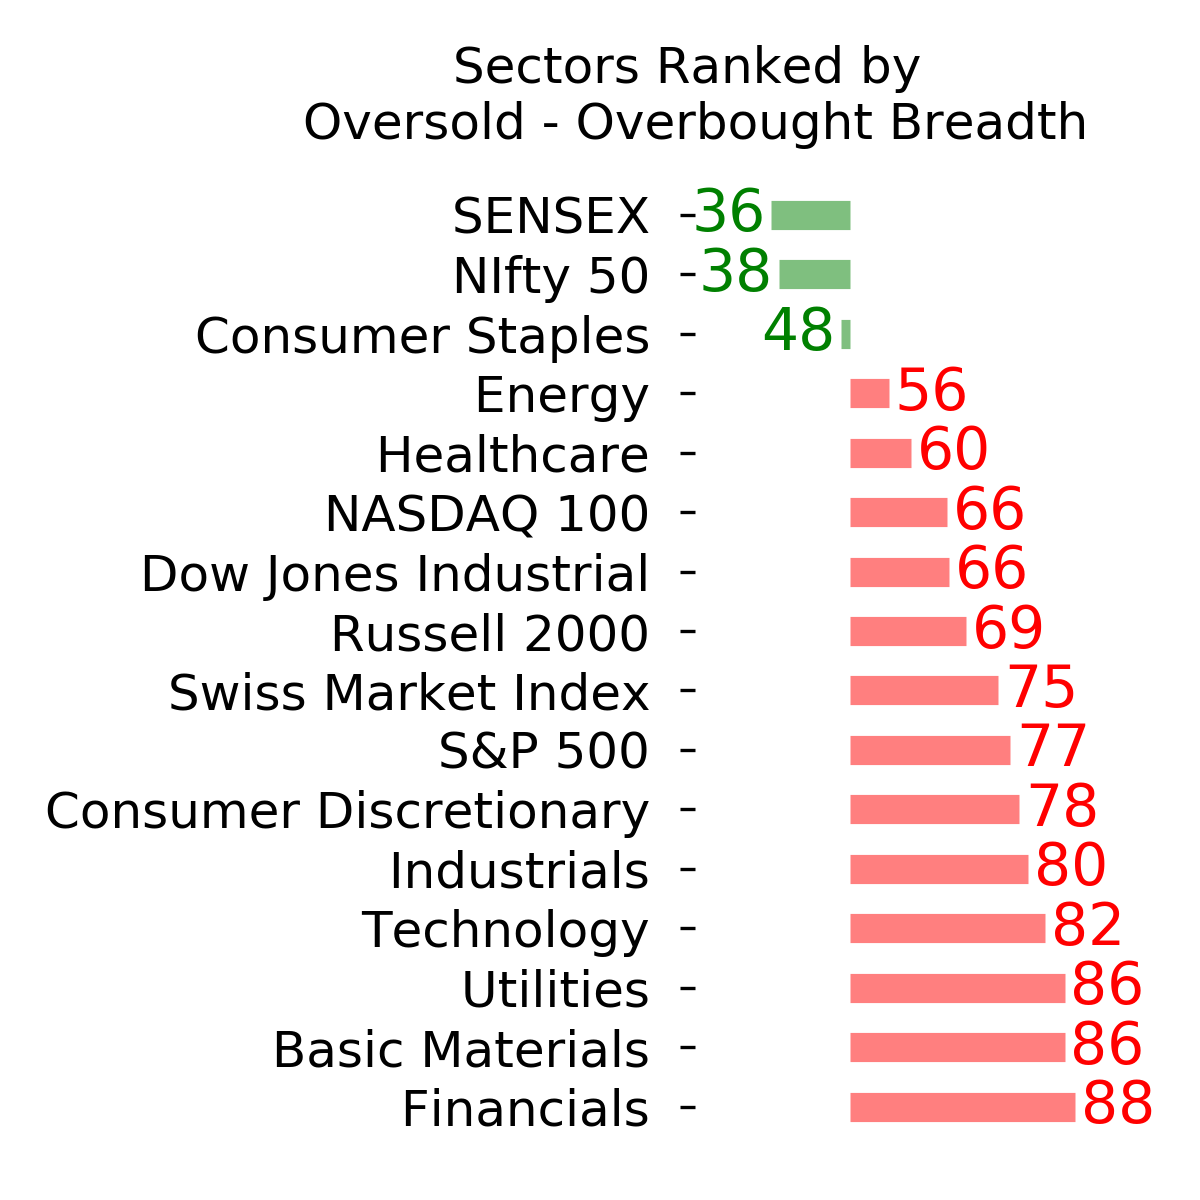
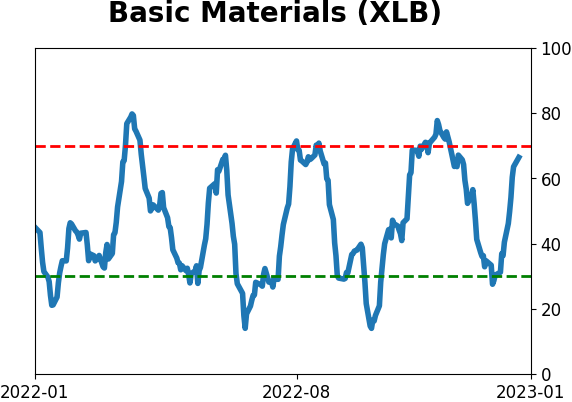
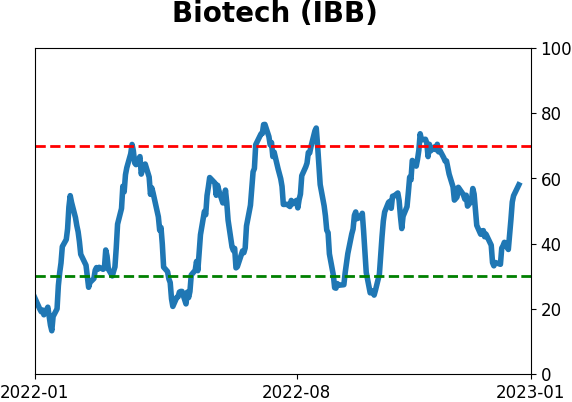
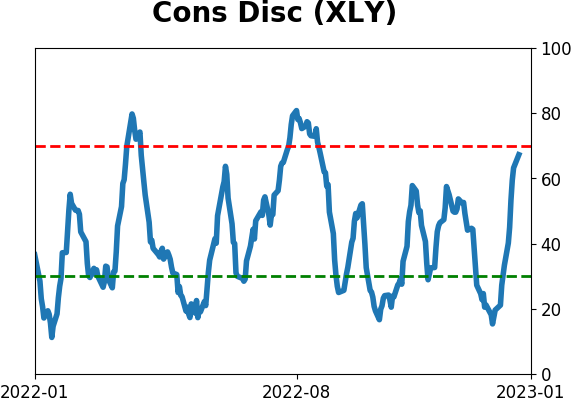
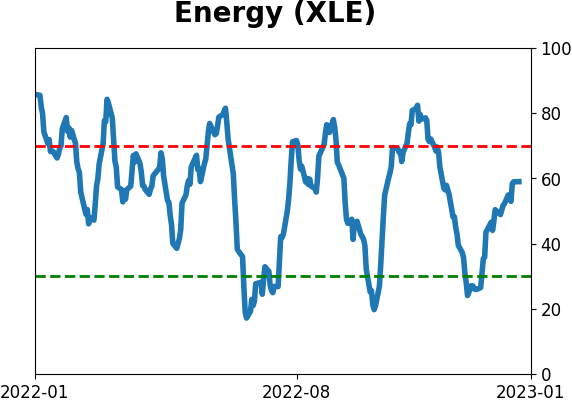
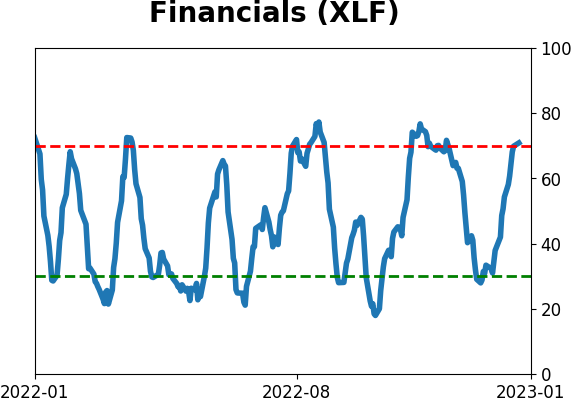
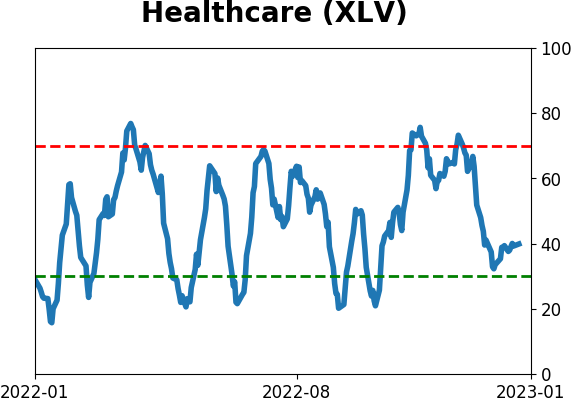
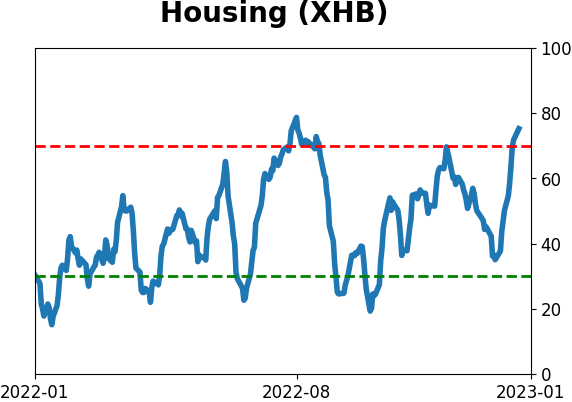
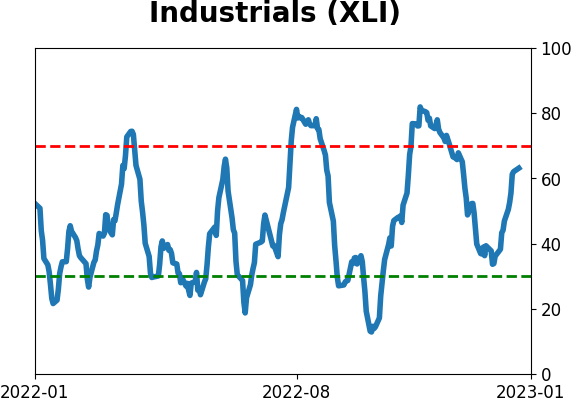
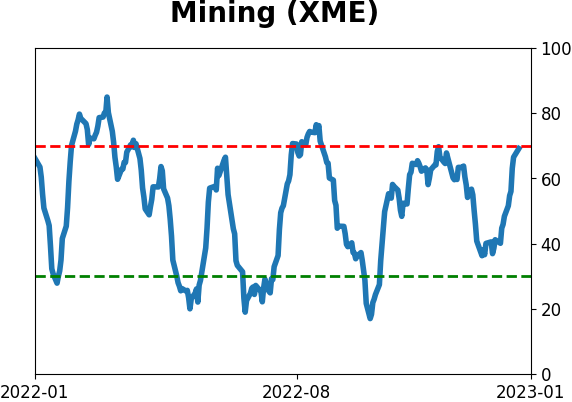
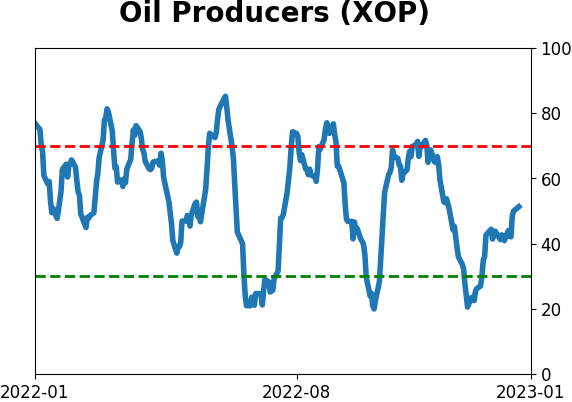
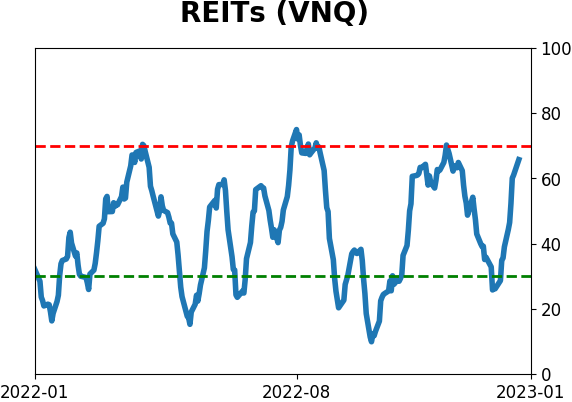
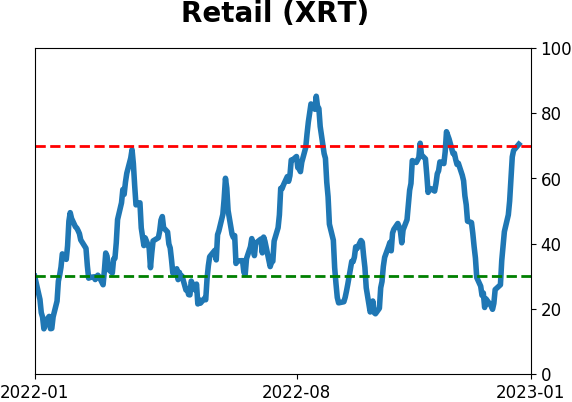
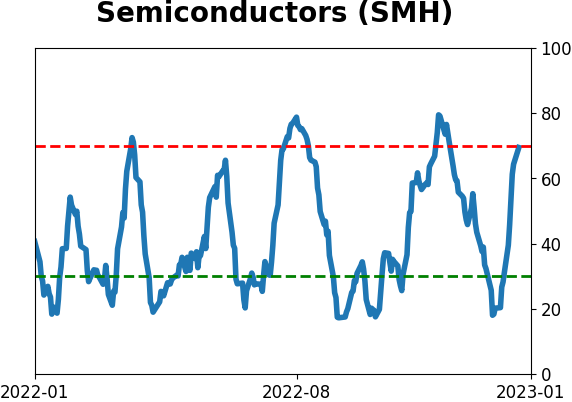
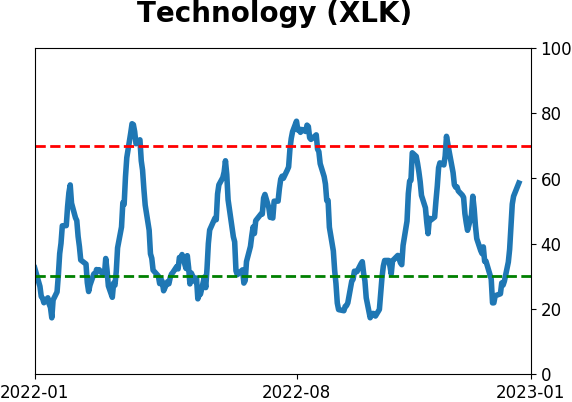
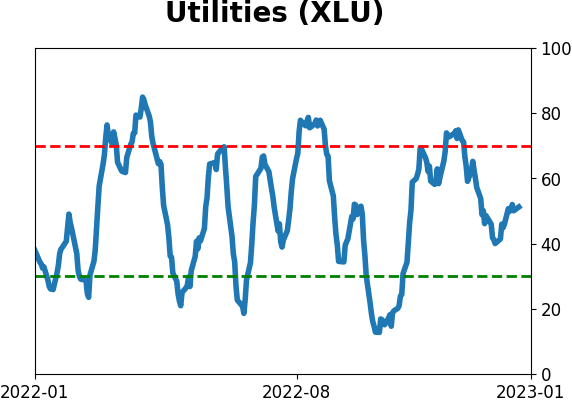
Sector ETF's - 10-Day Moving Average
|
|
|
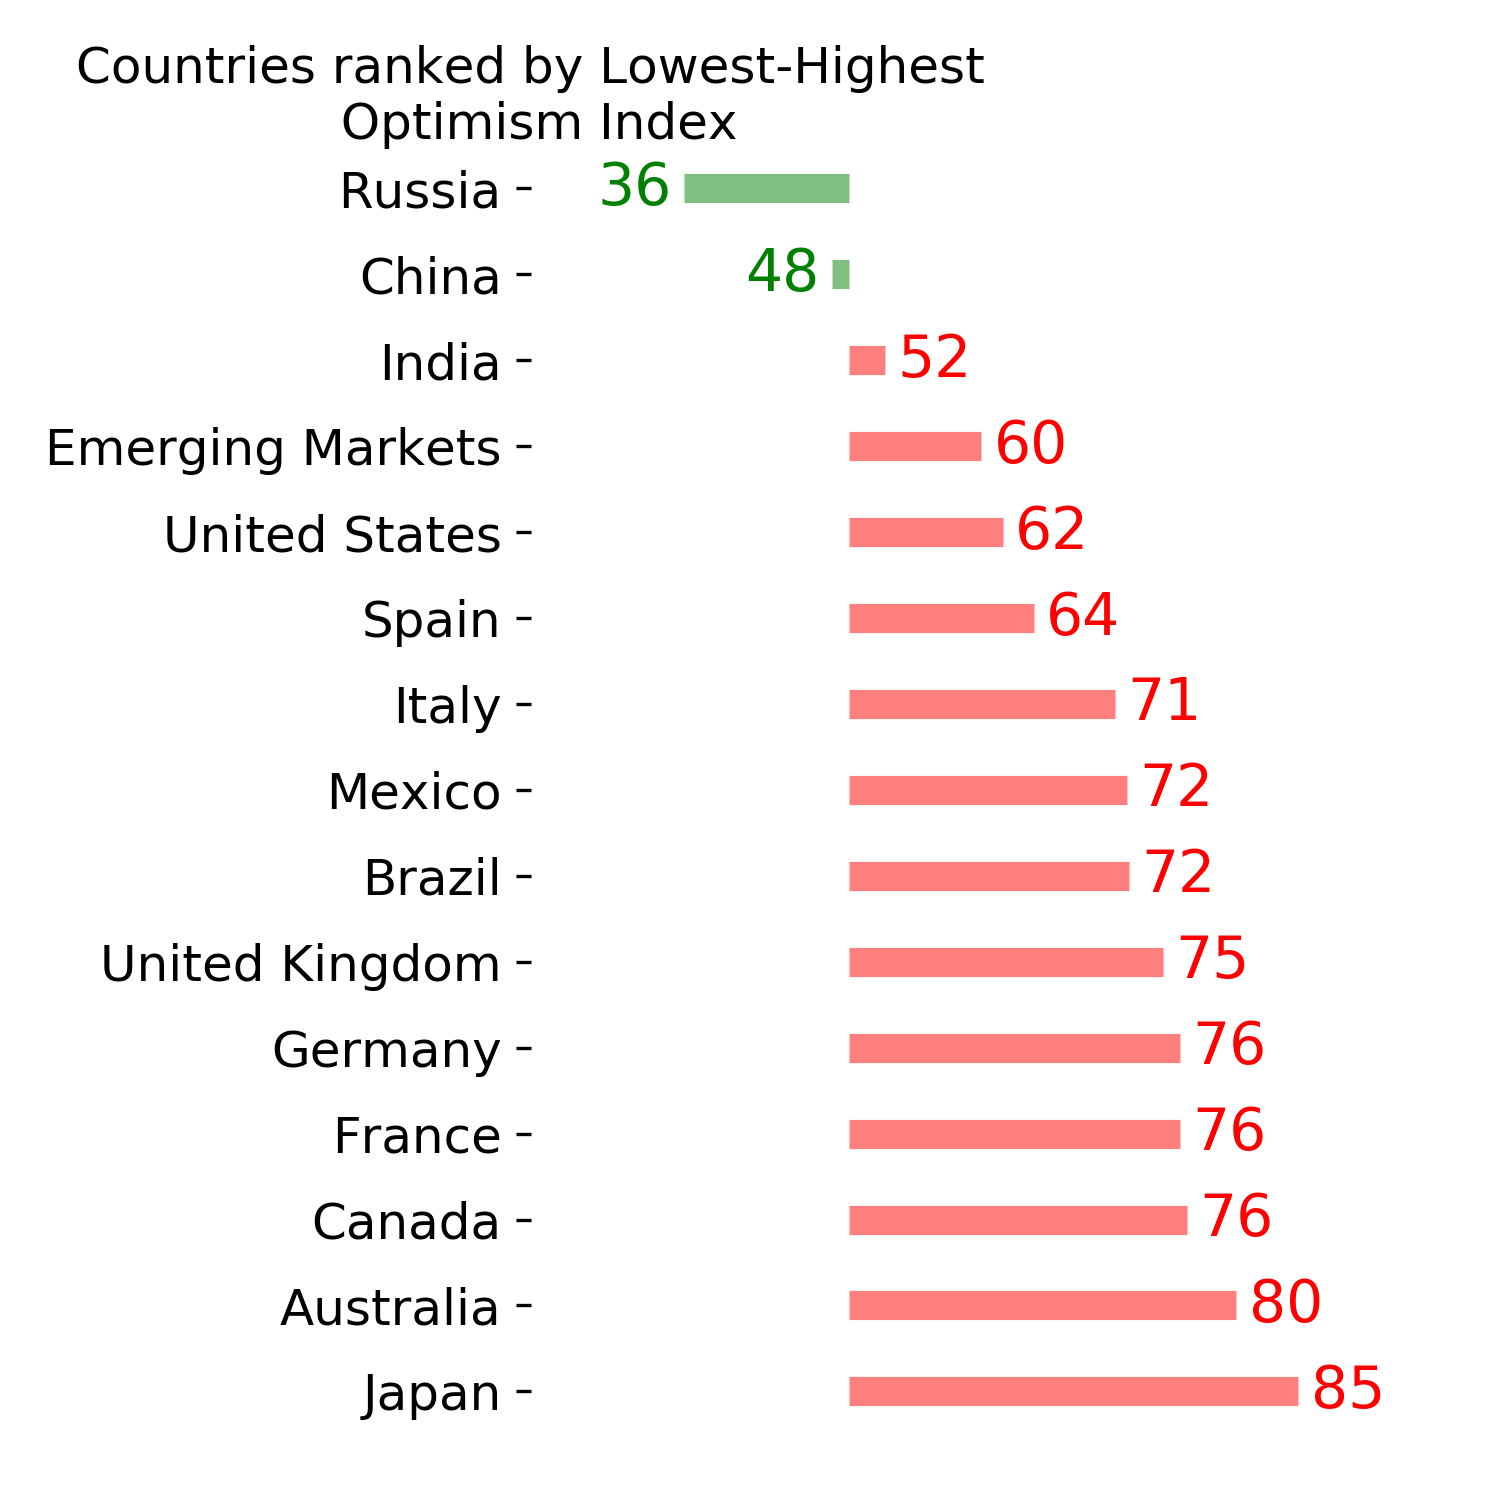
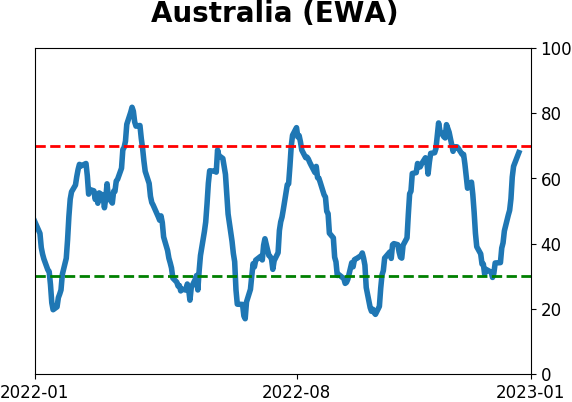
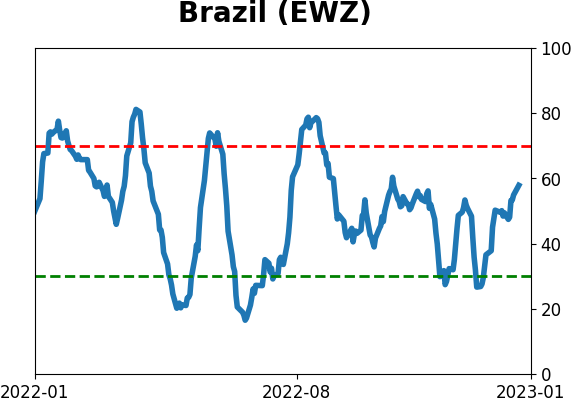
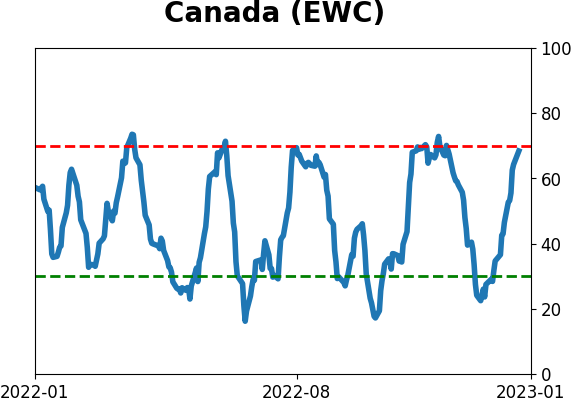
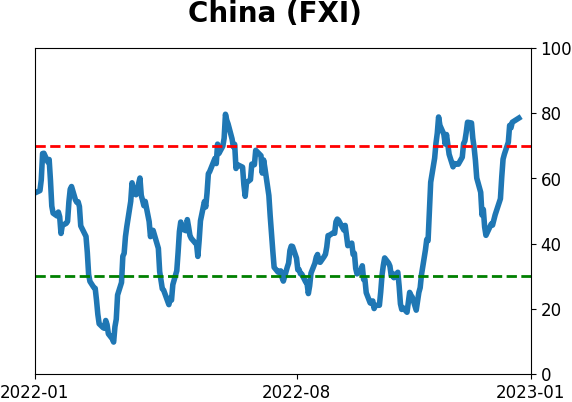
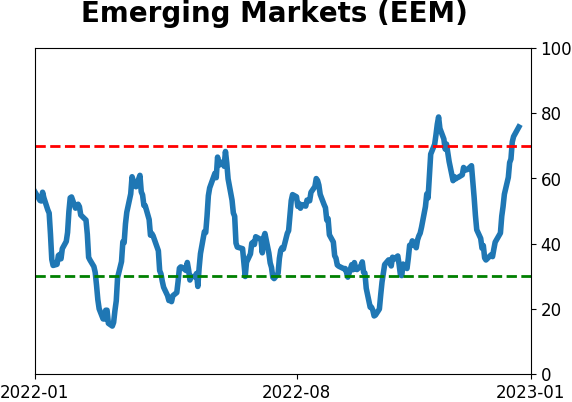
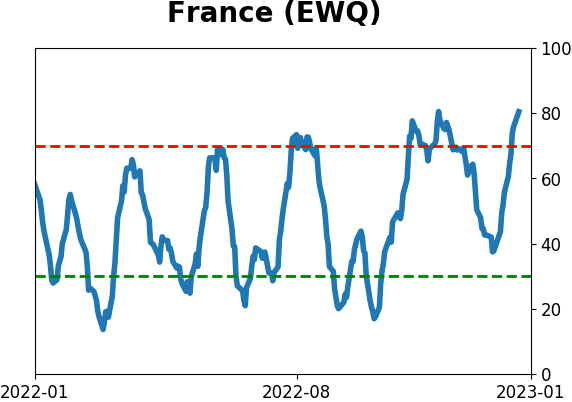
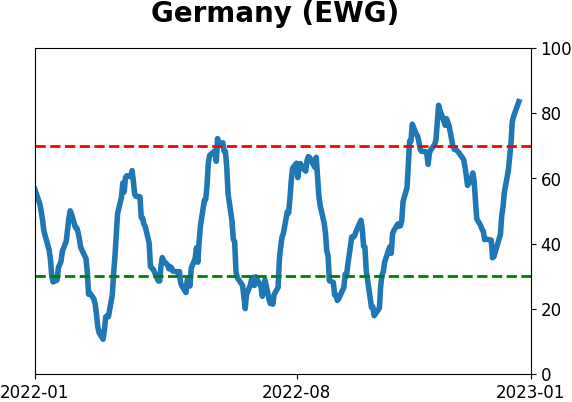
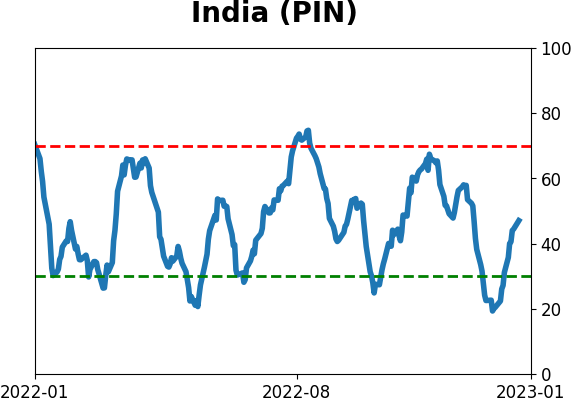
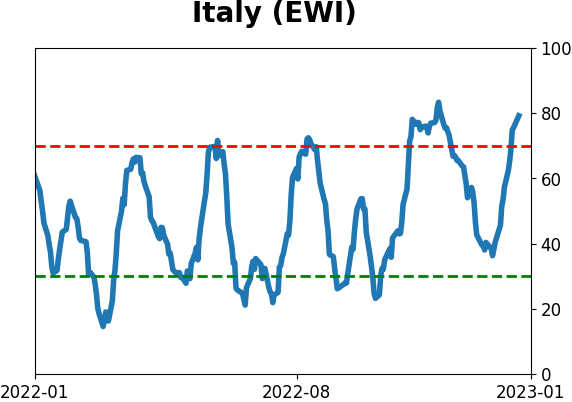
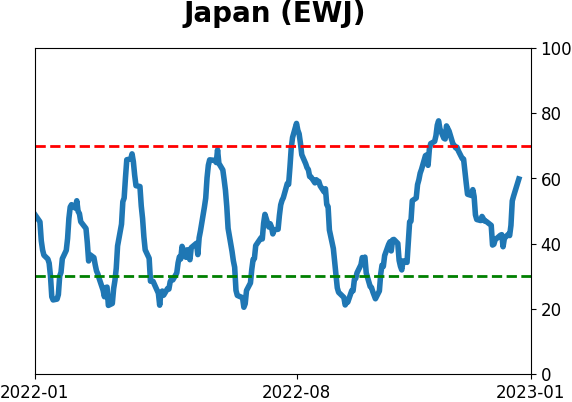
Country ETF's - 10-Day Moving Average
|
|
|
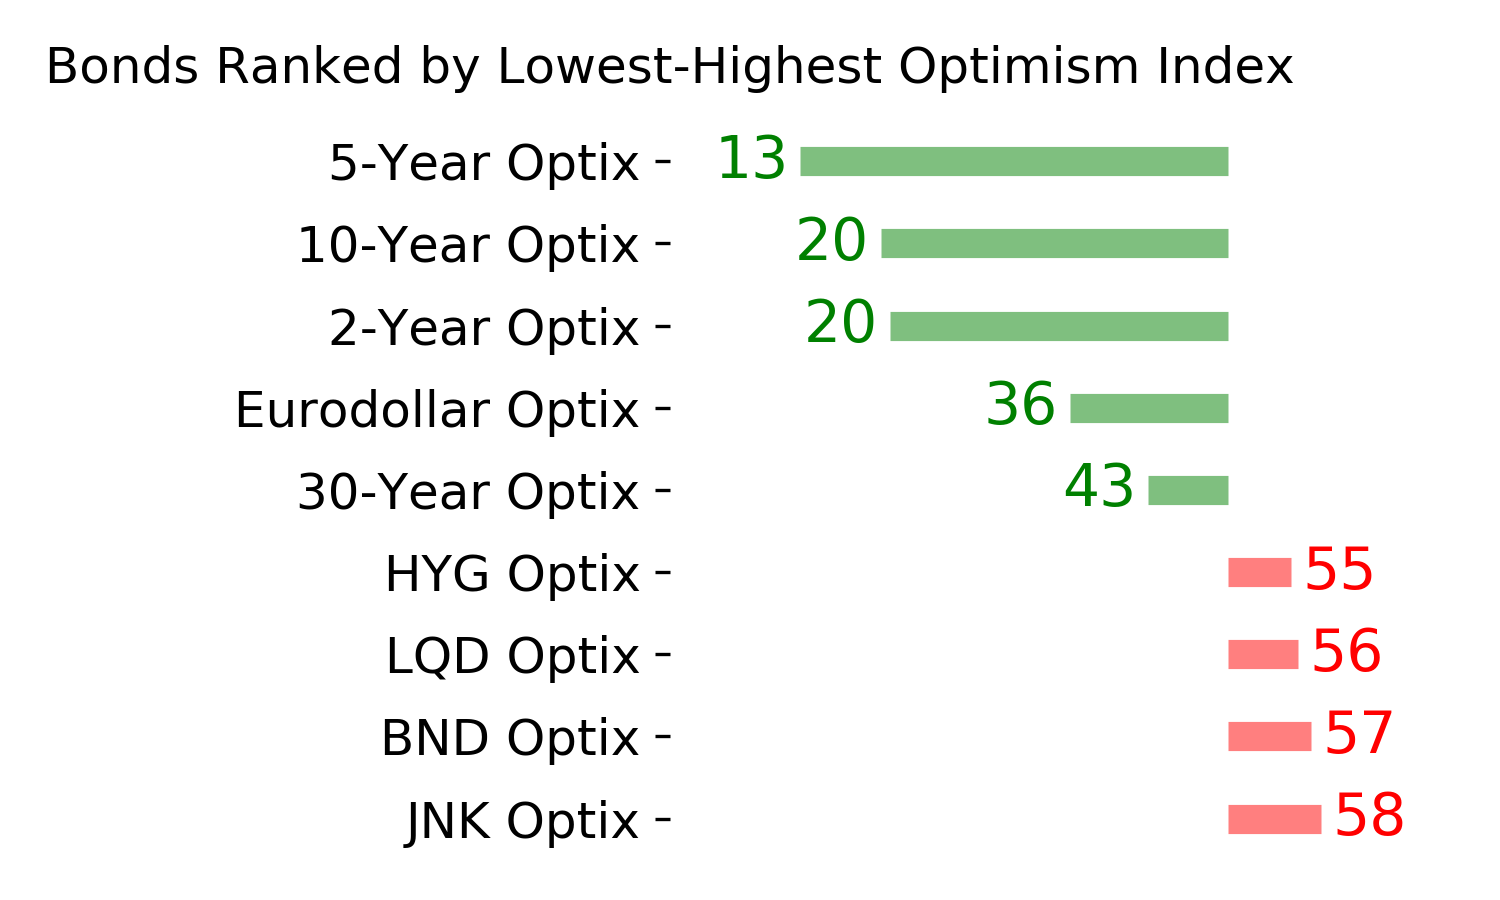
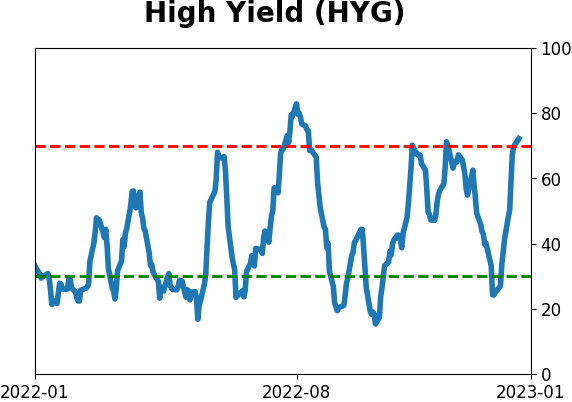
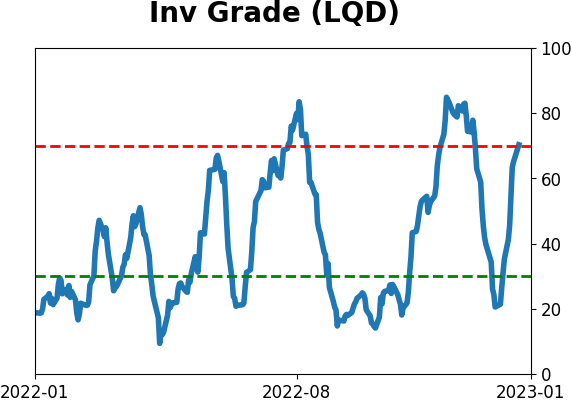
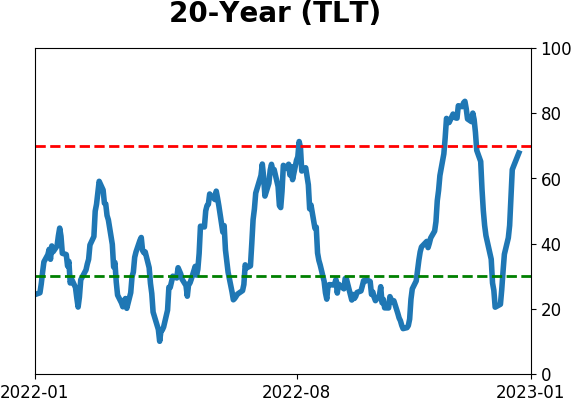
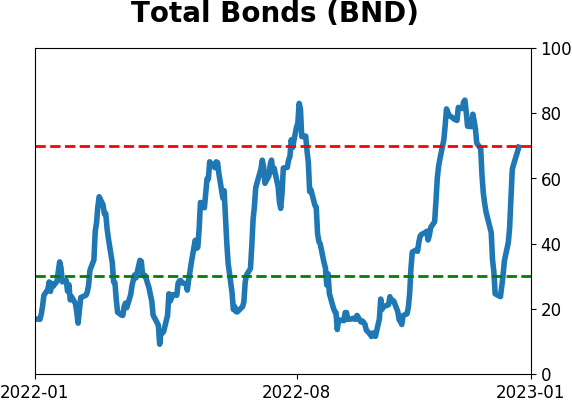
Bond ETF's - 10-Day Moving Average
|
|
|
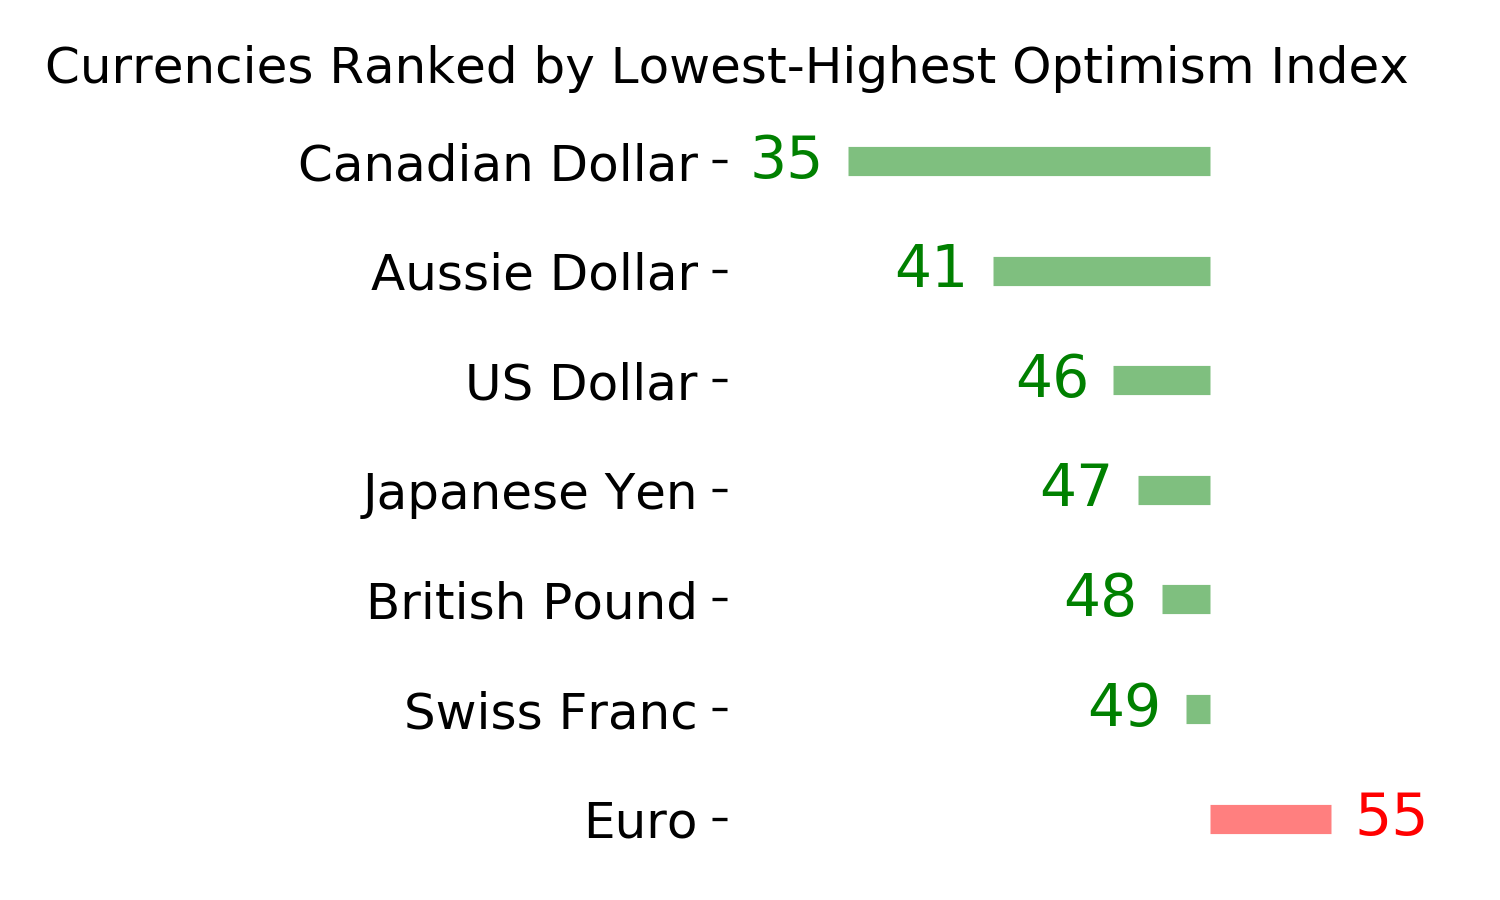
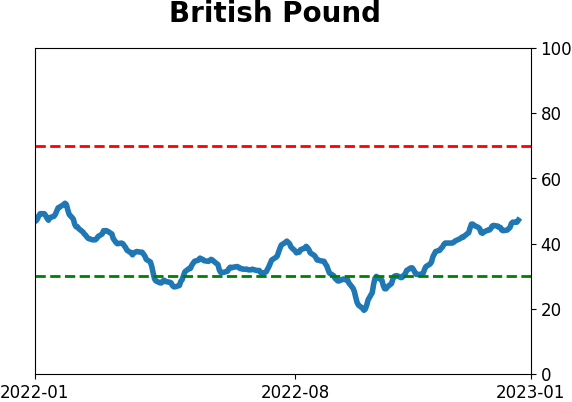
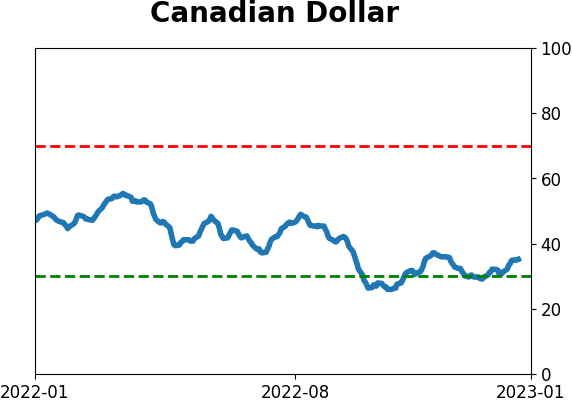
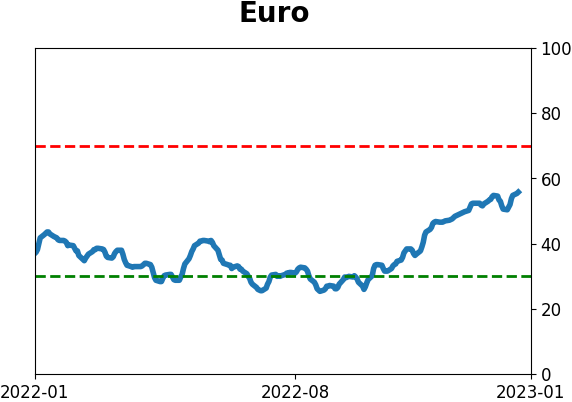
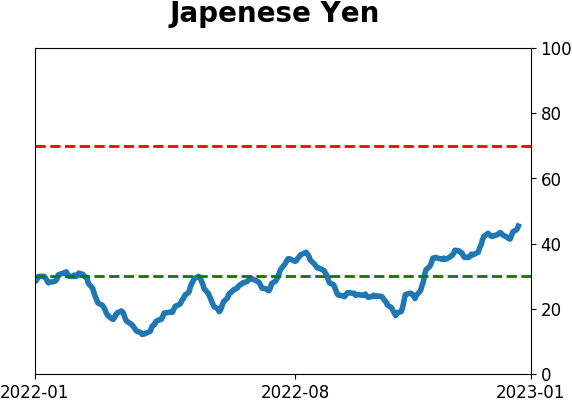
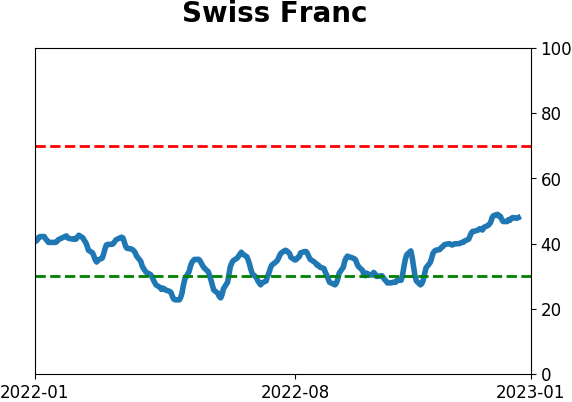
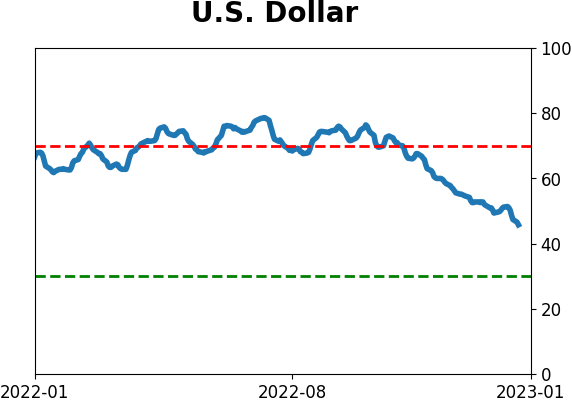
Currency ETF's - 5-Day Moving Average
|
|
|
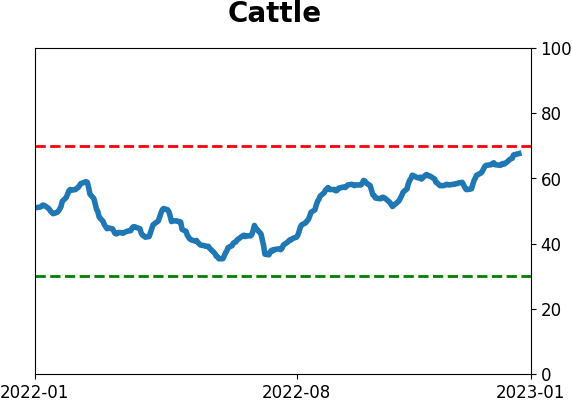
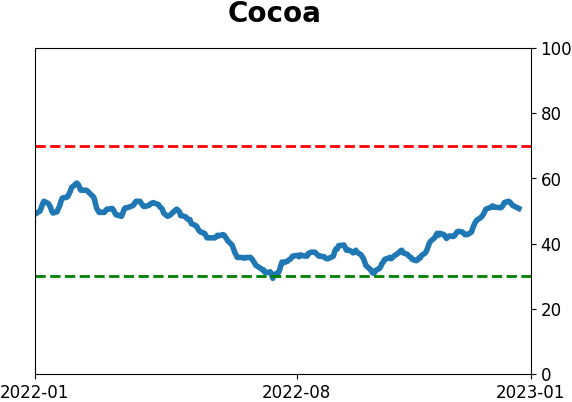
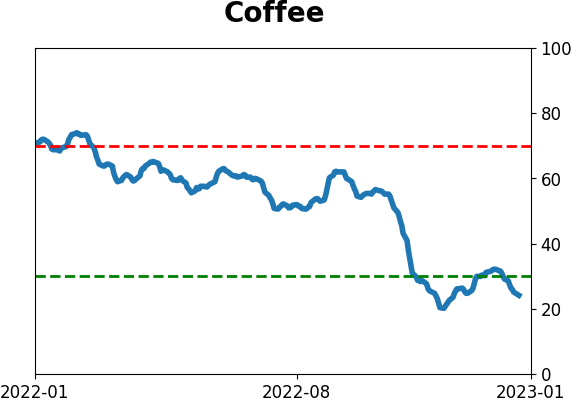
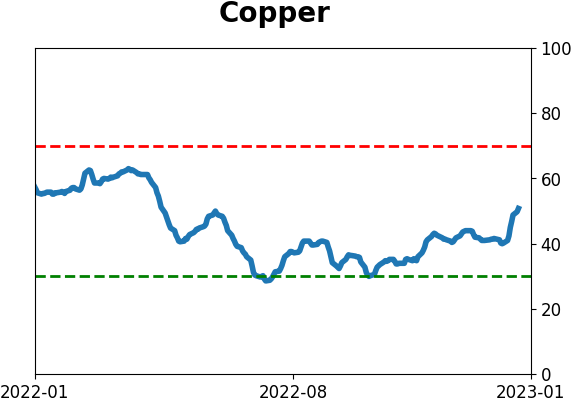
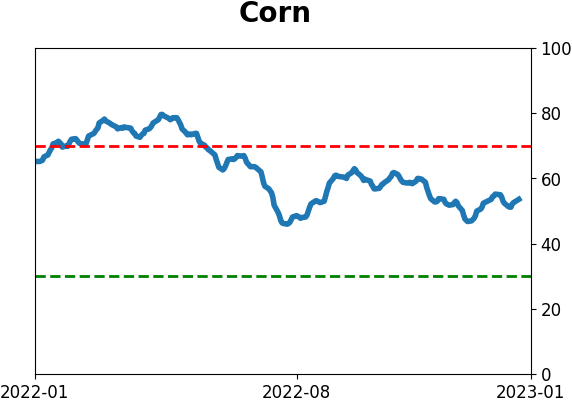
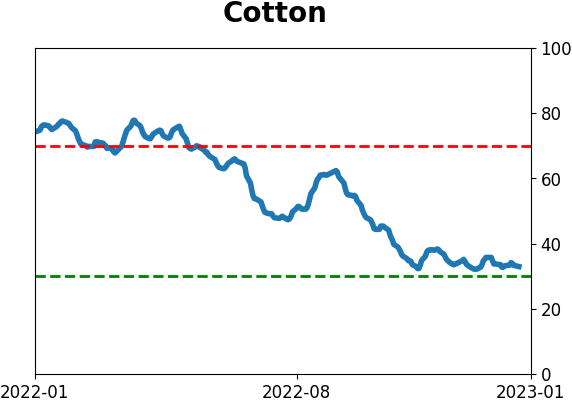
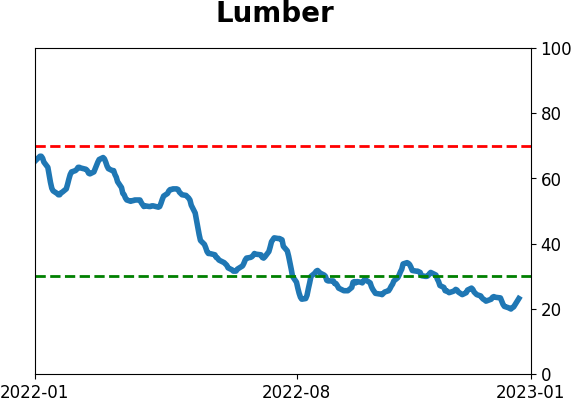
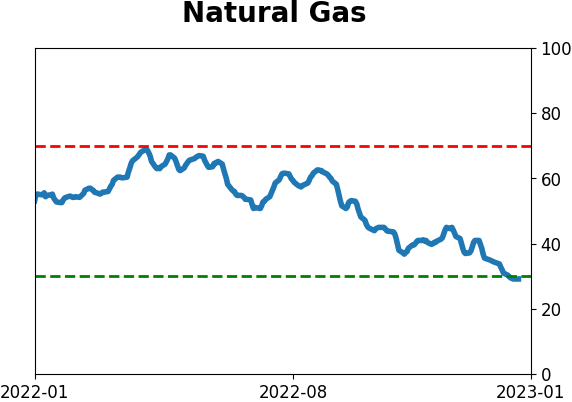
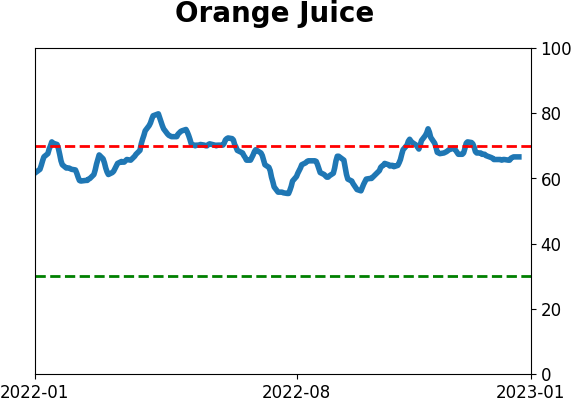
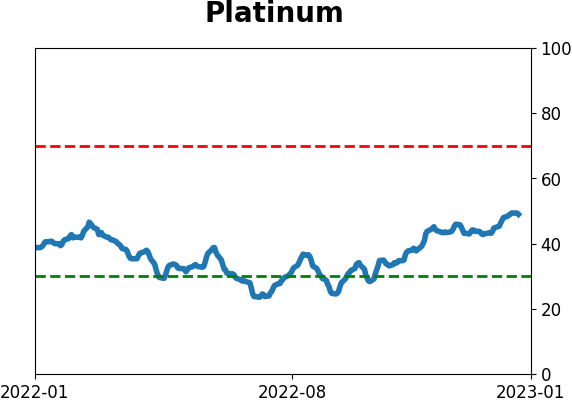
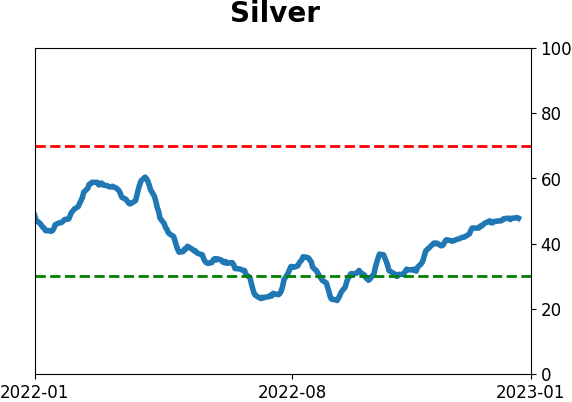
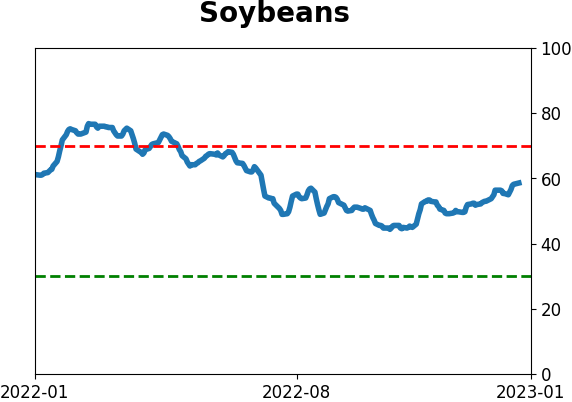
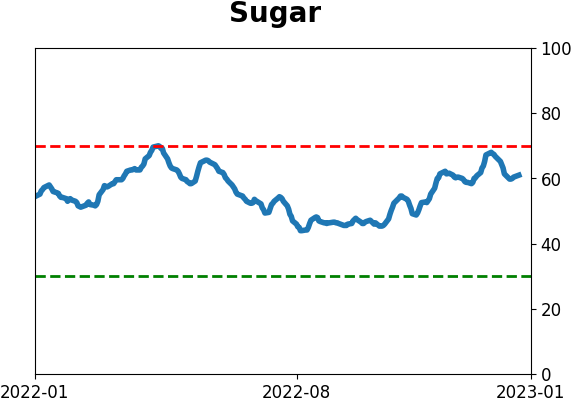
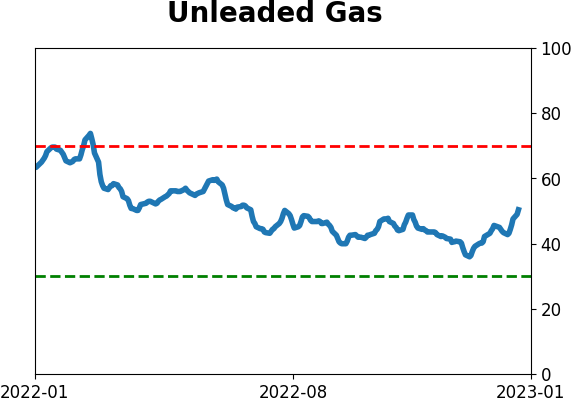
Commodity ETF's - 5-Day Moving Average
|
|