Headlines
|
|
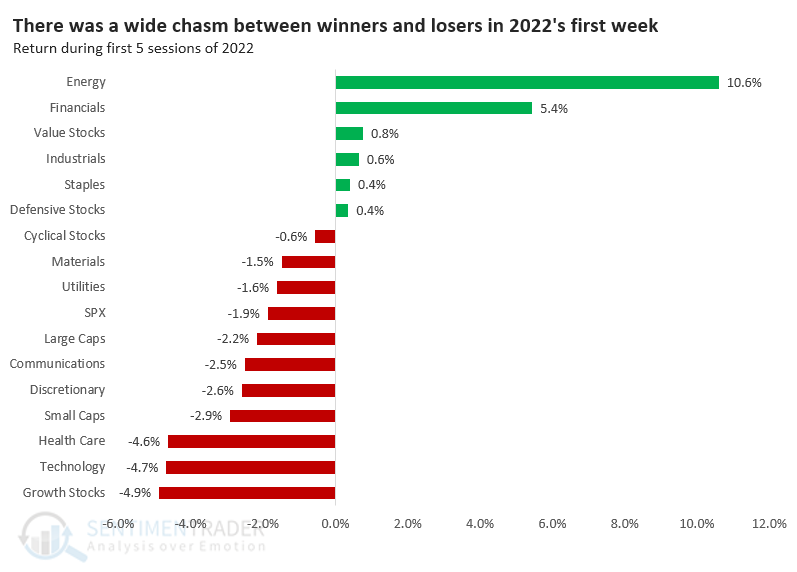
The first week of 2022 brings good tidings for Energy, not so much for the S&P:
During the first week of the new year, investors aggressively bought Energy and Financials while selling Technology and other Growth stocks. Going back to 1928, looking at investor behavior during the first week of a new year often set a tone for the rest of the year.
|
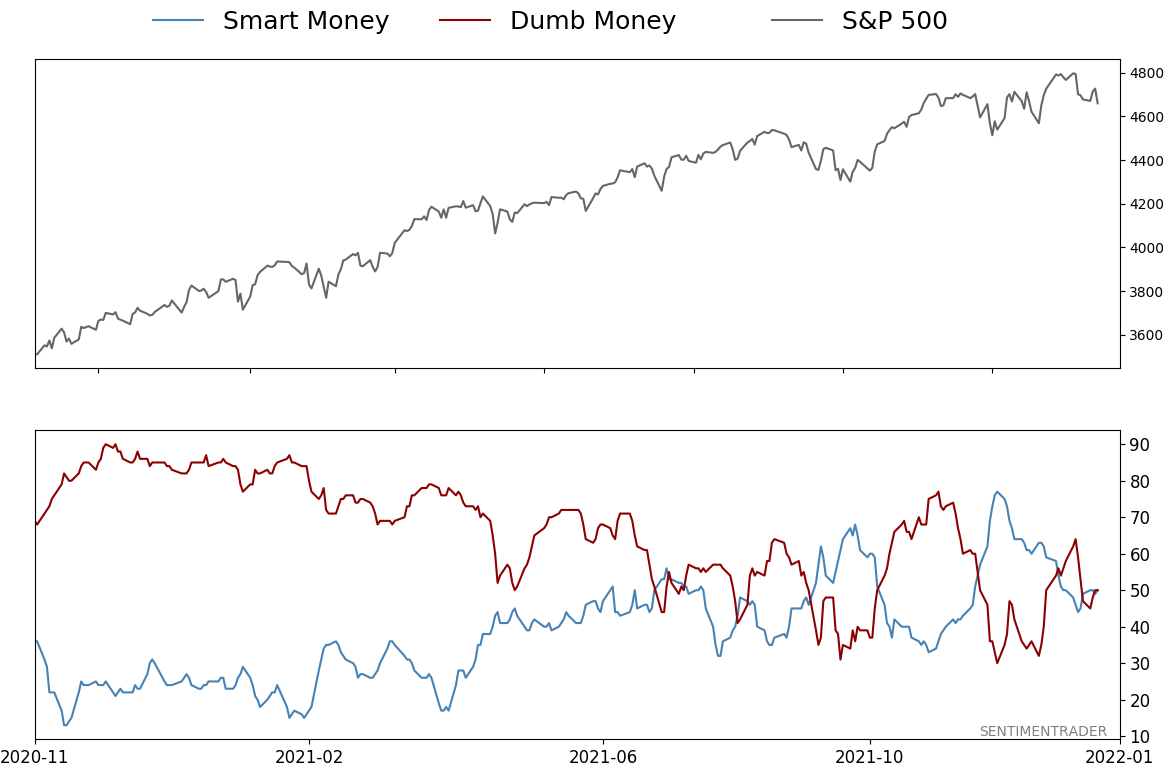
Smart / Dumb Money Confidence
|
Smart Money Confidence: 50%
Dumb Money Confidence: 50%
|
|
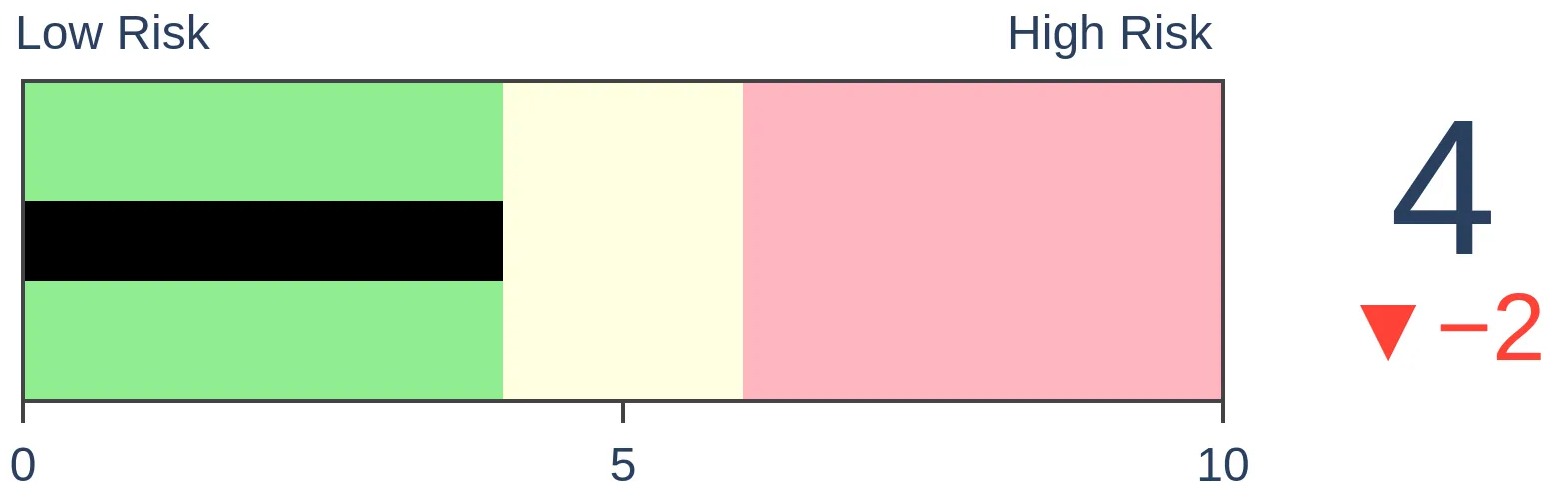
Risk Levels
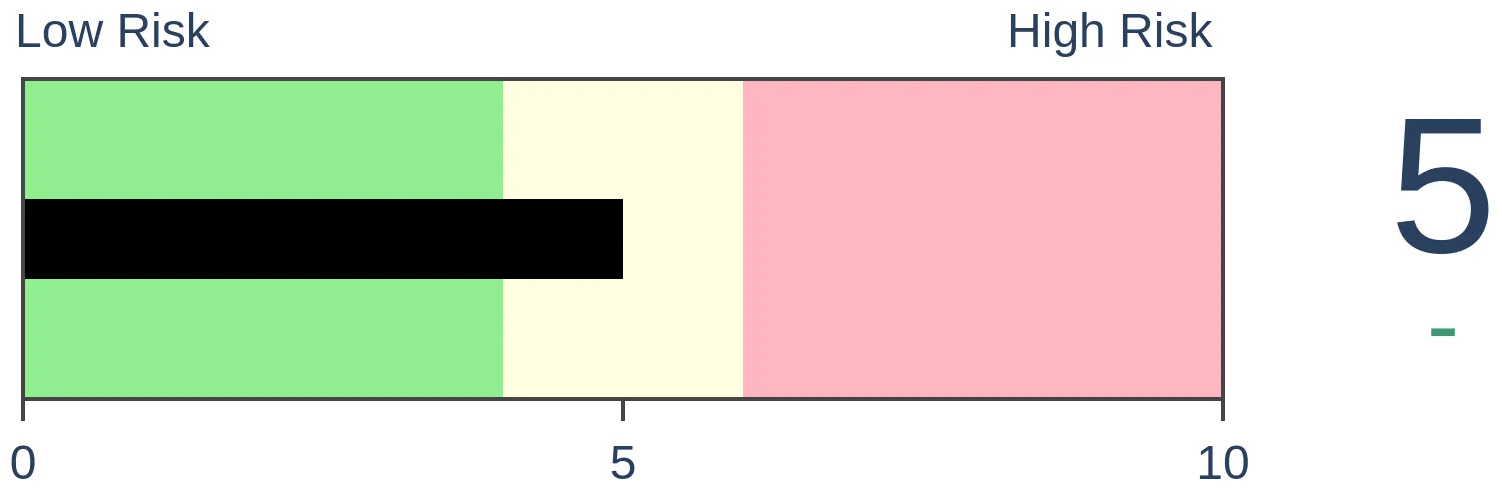
Stocks Short-Term
|
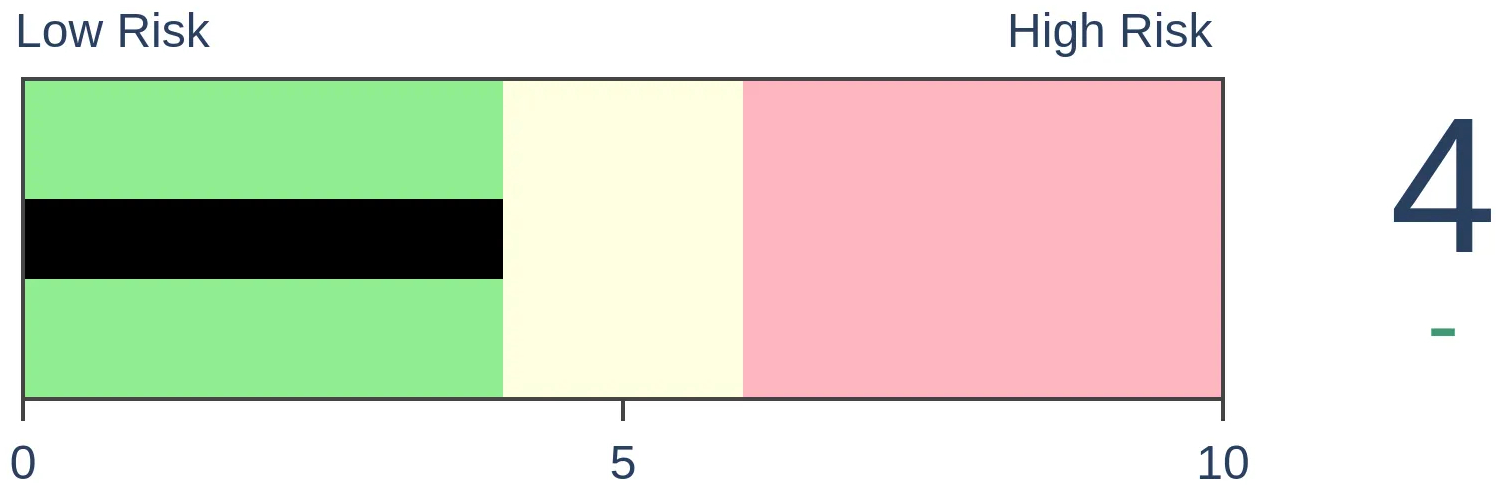
Stocks Medium-Term
|
|
Bonds
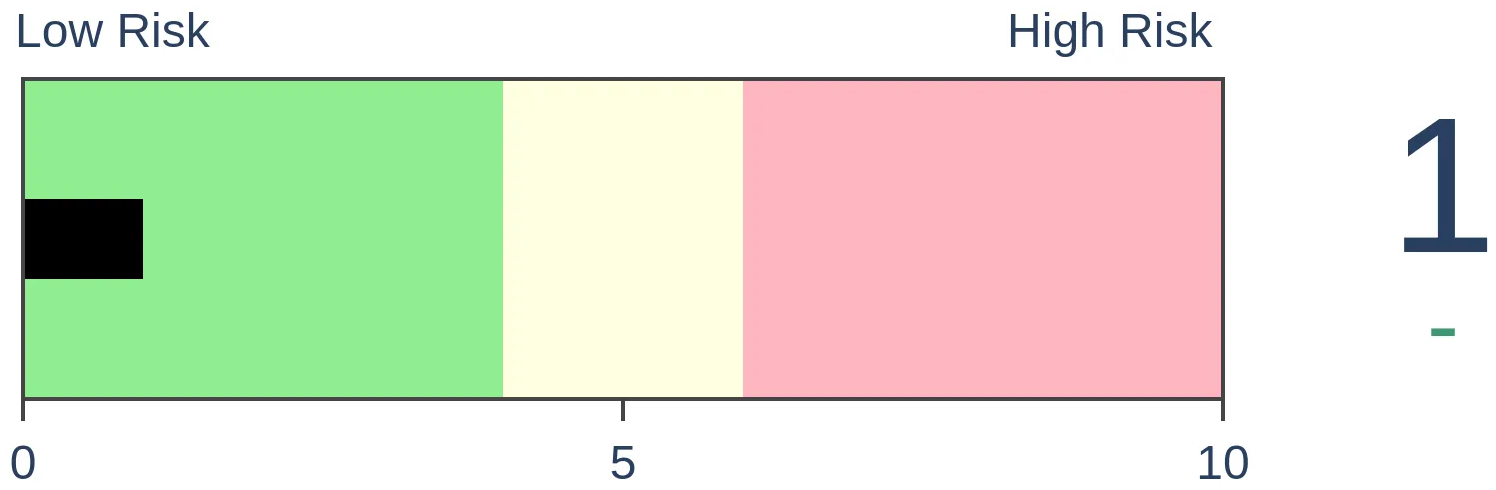
|
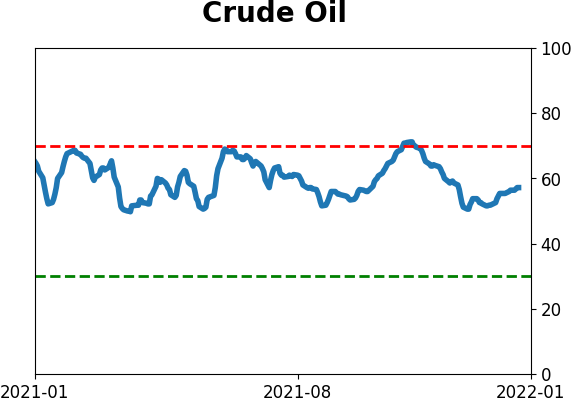
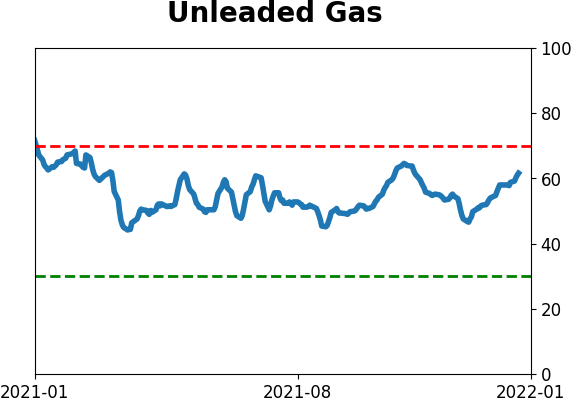
Crude Oil

|
|
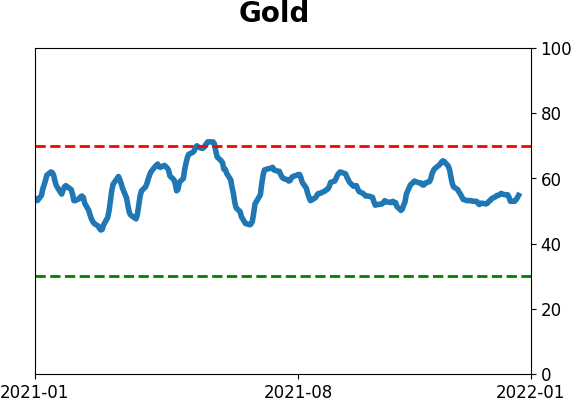
Gold

|
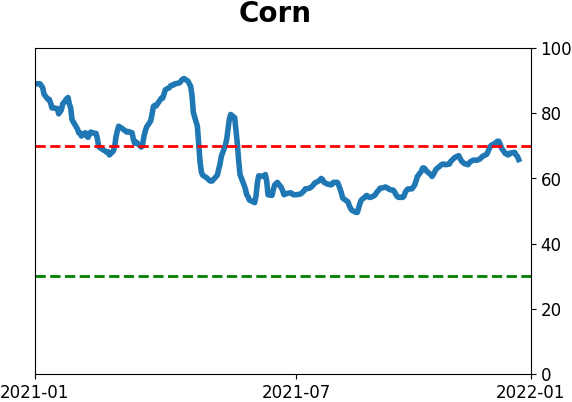
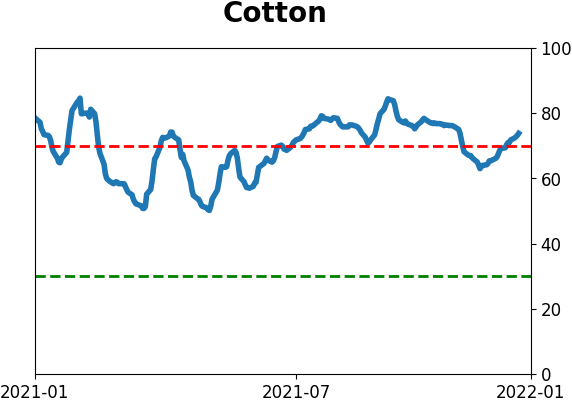
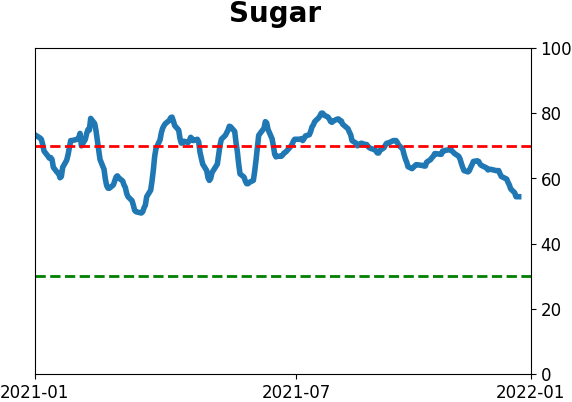
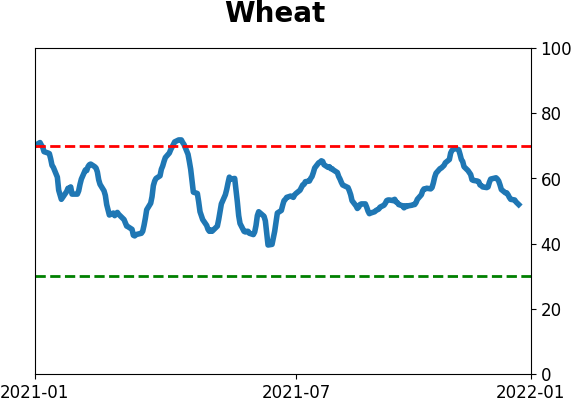
Agriculture
|
|
Research
By Jason Goepfert
BOTTOM LINE
During the first week of the new year, investors aggressively bought Energy and Financials while selling Technology and other Growth stocks. Going back to 1928, looking at investor behavior during the first week of a new year often set a tone for the rest of the year.
FORECAST / TIMEFRAME
None
|
Key points:
- The "first 5 days" indicator suggests that activity in the 1st week of a new year sets the tone for the rest of the year
- Looking at sectors and factors, Energy and Financial stocks have set a positive tone while Growth and Tech did not
- Returns during the rest of the year give a compelling case that recent trends should continue
Using the first 5 days as a precursor
A well-known seasonal pattern, originated by Stock Trader's Almanac, suggests that how investors behave in the first 5 days of a new year sets the tone for the rest of the year.
In theory, this is silly. There is no reason why such a short-term move would have any impact on returns nearly 12 months later. In practice, it's not so easy to dismiss.
Instead of rehashing the familiar, let's look at sectors and factors and see if there is any reason to be especially bullish or bearish on their prospects for the rest of this month and this year, depending on how they were treated during that first week. Based on that theory, things are looking good for Energy, Financial, and Value stocks. High-beta investors might have a reason to worry.
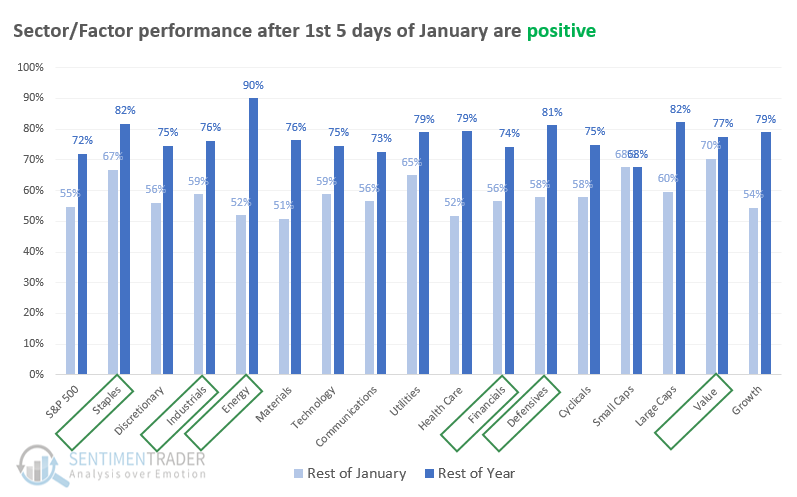
The results were good when we looked at how first-week winners performed for the rest of the month and the rest of the year. The chart below shows how often each sector and factor showed a positive return through January and year-end (not including the first 5 days of the year).
Taking first place was Energy, which added to its gains during the rest of the month only 52% of the time, but during the other approximately 247 other days in the year, it rose a whopping 90% of the time. Staples stocks added to their gains 82% of the time, and overall Defensive stocks 81% of the time. During the rest of January, returns were uninspiring, but it augurs well for the rest of the year. The boxes highlight the relevant sectors/factors for the first 5 days.
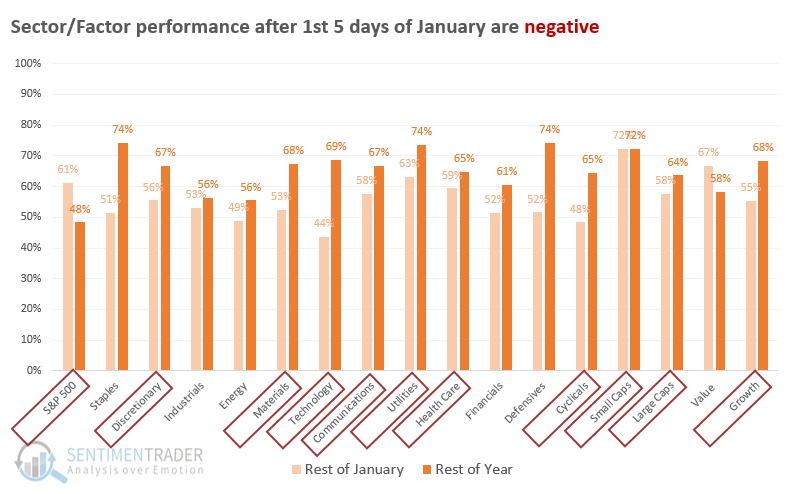
For the losers, it's not like the rest of the year was a complete failure. But the S&P 500 showed a positive return only 48% of the time, meager given the positive drift since 1928.
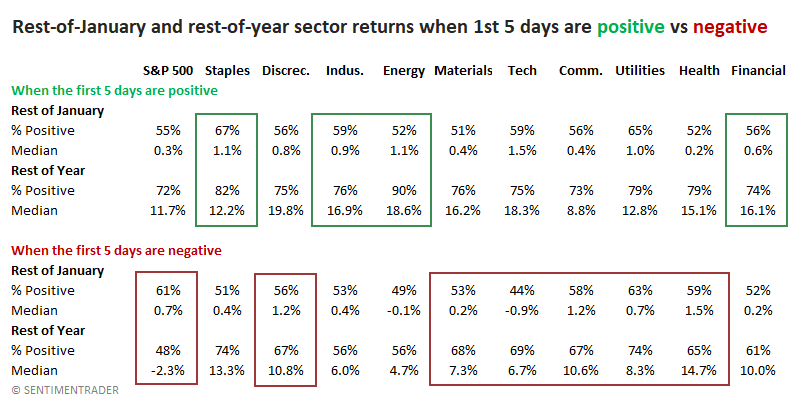
Energy stocks show a nearly 19% gain; Tech stocks less than 7%
The table below delves into the numbers in the tables above, giving the median returns and the winning percentage. Again, Energy stands out with a median gain of nearly 19% for the rest of the year. The S&P 500's median return of -2.3% is a significant outlier and a bit of a worry.
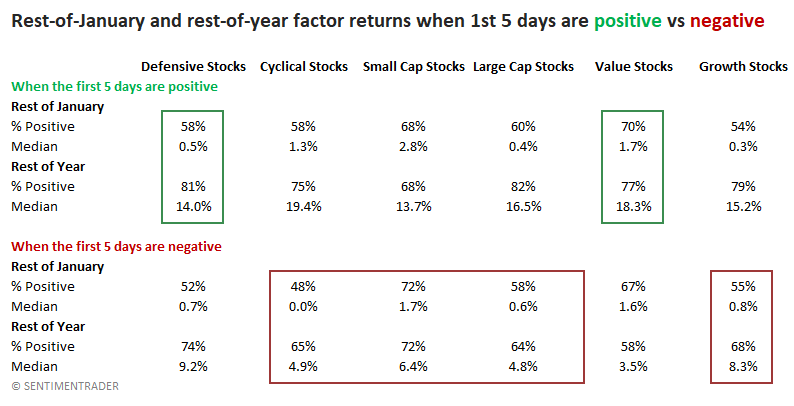
For factors, a good start to the year boded well for Defensive stocks, up an average of 14% through the rest of the year. Cyclical stocks, by contrast, averaged only 4.9% and were positive 65% of the time when they started the year with selling pressure as they did this year.
What the research tells us...
We generally stress that short-term indicators are better indicators of short-term forward returns than they are long-term returns. So, it's a stretch to suggest that returns over only 5 days might influence returns during the next 247 days. Even though the results above are compelling in a few cases, we'd have that caveat in mind. And those results suggest that a good start to the year might be a positive for Energy, Staple, Defensive, and Value stocks for the rest of the year. While not a negative per se, it's less positive that the S&P 500, Tech, Cyclical, and Large Cap stocks met the new year with selling pressure.
Active Studies
| Time Frame | Bullish | Bearish | | Short-Term | 2 | 0 | | Medium-Term | 13 | 2 | | Long-Term | 13 | 4 |
|
Indicators at Extremes
Portfolio
| Position | Description | Weight % | Added / Reduced | Date | | Stocks | RSP | 35.9 | Added 25.2% | 2022-01-03 | | Bonds | 32.7% BND, 7.1% SCHP | 39.8 | Added 8.3% | 2021-10-26 | | Commodities | GCC | 2.4 | Reduced 2.1%
| 2020-09-04 | | Precious Metals | GDX | 4.6 | Reduced 4.2% | 2021-05-19 | | Special Situations | 9.8% KWEB, 4.7% XLE, 2.9% PSCE | 17.3 | Added 9.78% | 2021-10-01 | | Cash | | 0.1 | | |
|
Updates (Changes made today are underlined)
Coinciding with the new year, there was a thrust in participation in the S&P 500 near the end of December. Thrusts have been among the most consistent signals over the decades, and this is hard to ignore. I have greater confidence in thrusts when coming off extreme pessimism, like the spring of 2020, as opposed to near all-time highs on low volume. Still, it's hard to justify not being at least neutral weight stocks given this behavior. Bond sentiment is trying to recover from a recent bout of pessimism, and gold stocks are doing their thing which is not much at all. They've been flat for six months. Chinese tech stocks were doing exactly what they're supposed to do, then did *not* by plunging to new lows. This is troubling on a shorter-term time frame, but this was never meant for a trade, rather a multi-year investment. Recent behavior is troubling and I will not be adding any exposure as long as that's the case. RETURN YTD: +0.4% 2021: +8.7%, 2020: +8.1%, 2019: +12.6%, 2018: +0.6%, 2017: +3.8%, 2016: +17.1%, 2015: +9.2%, 2014: +14.5%, 2013: +2.2%, 2012: +10.8%, 2011: +16.5%, 2010: +15.3%, 2009: +23.9%, 2008: +16.2%, 2007: +7.8%
|
|
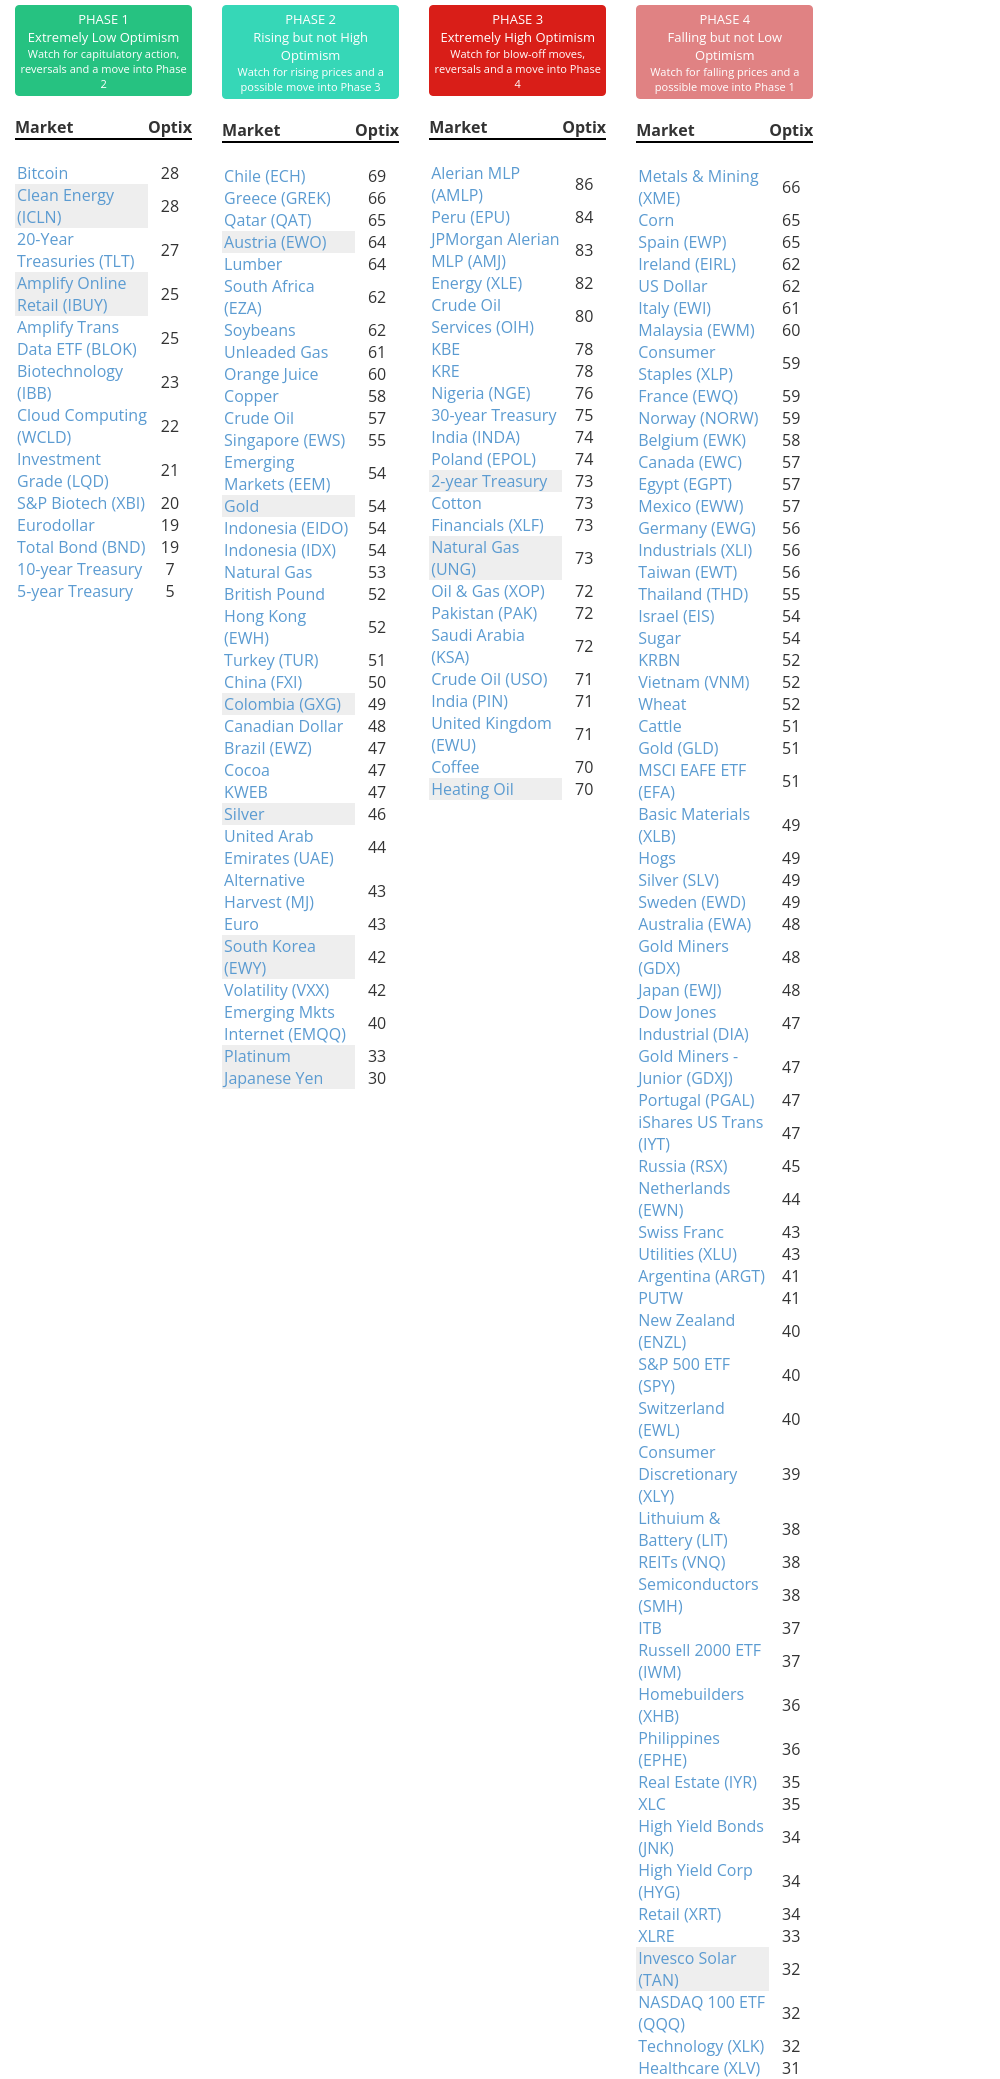
Phase Table
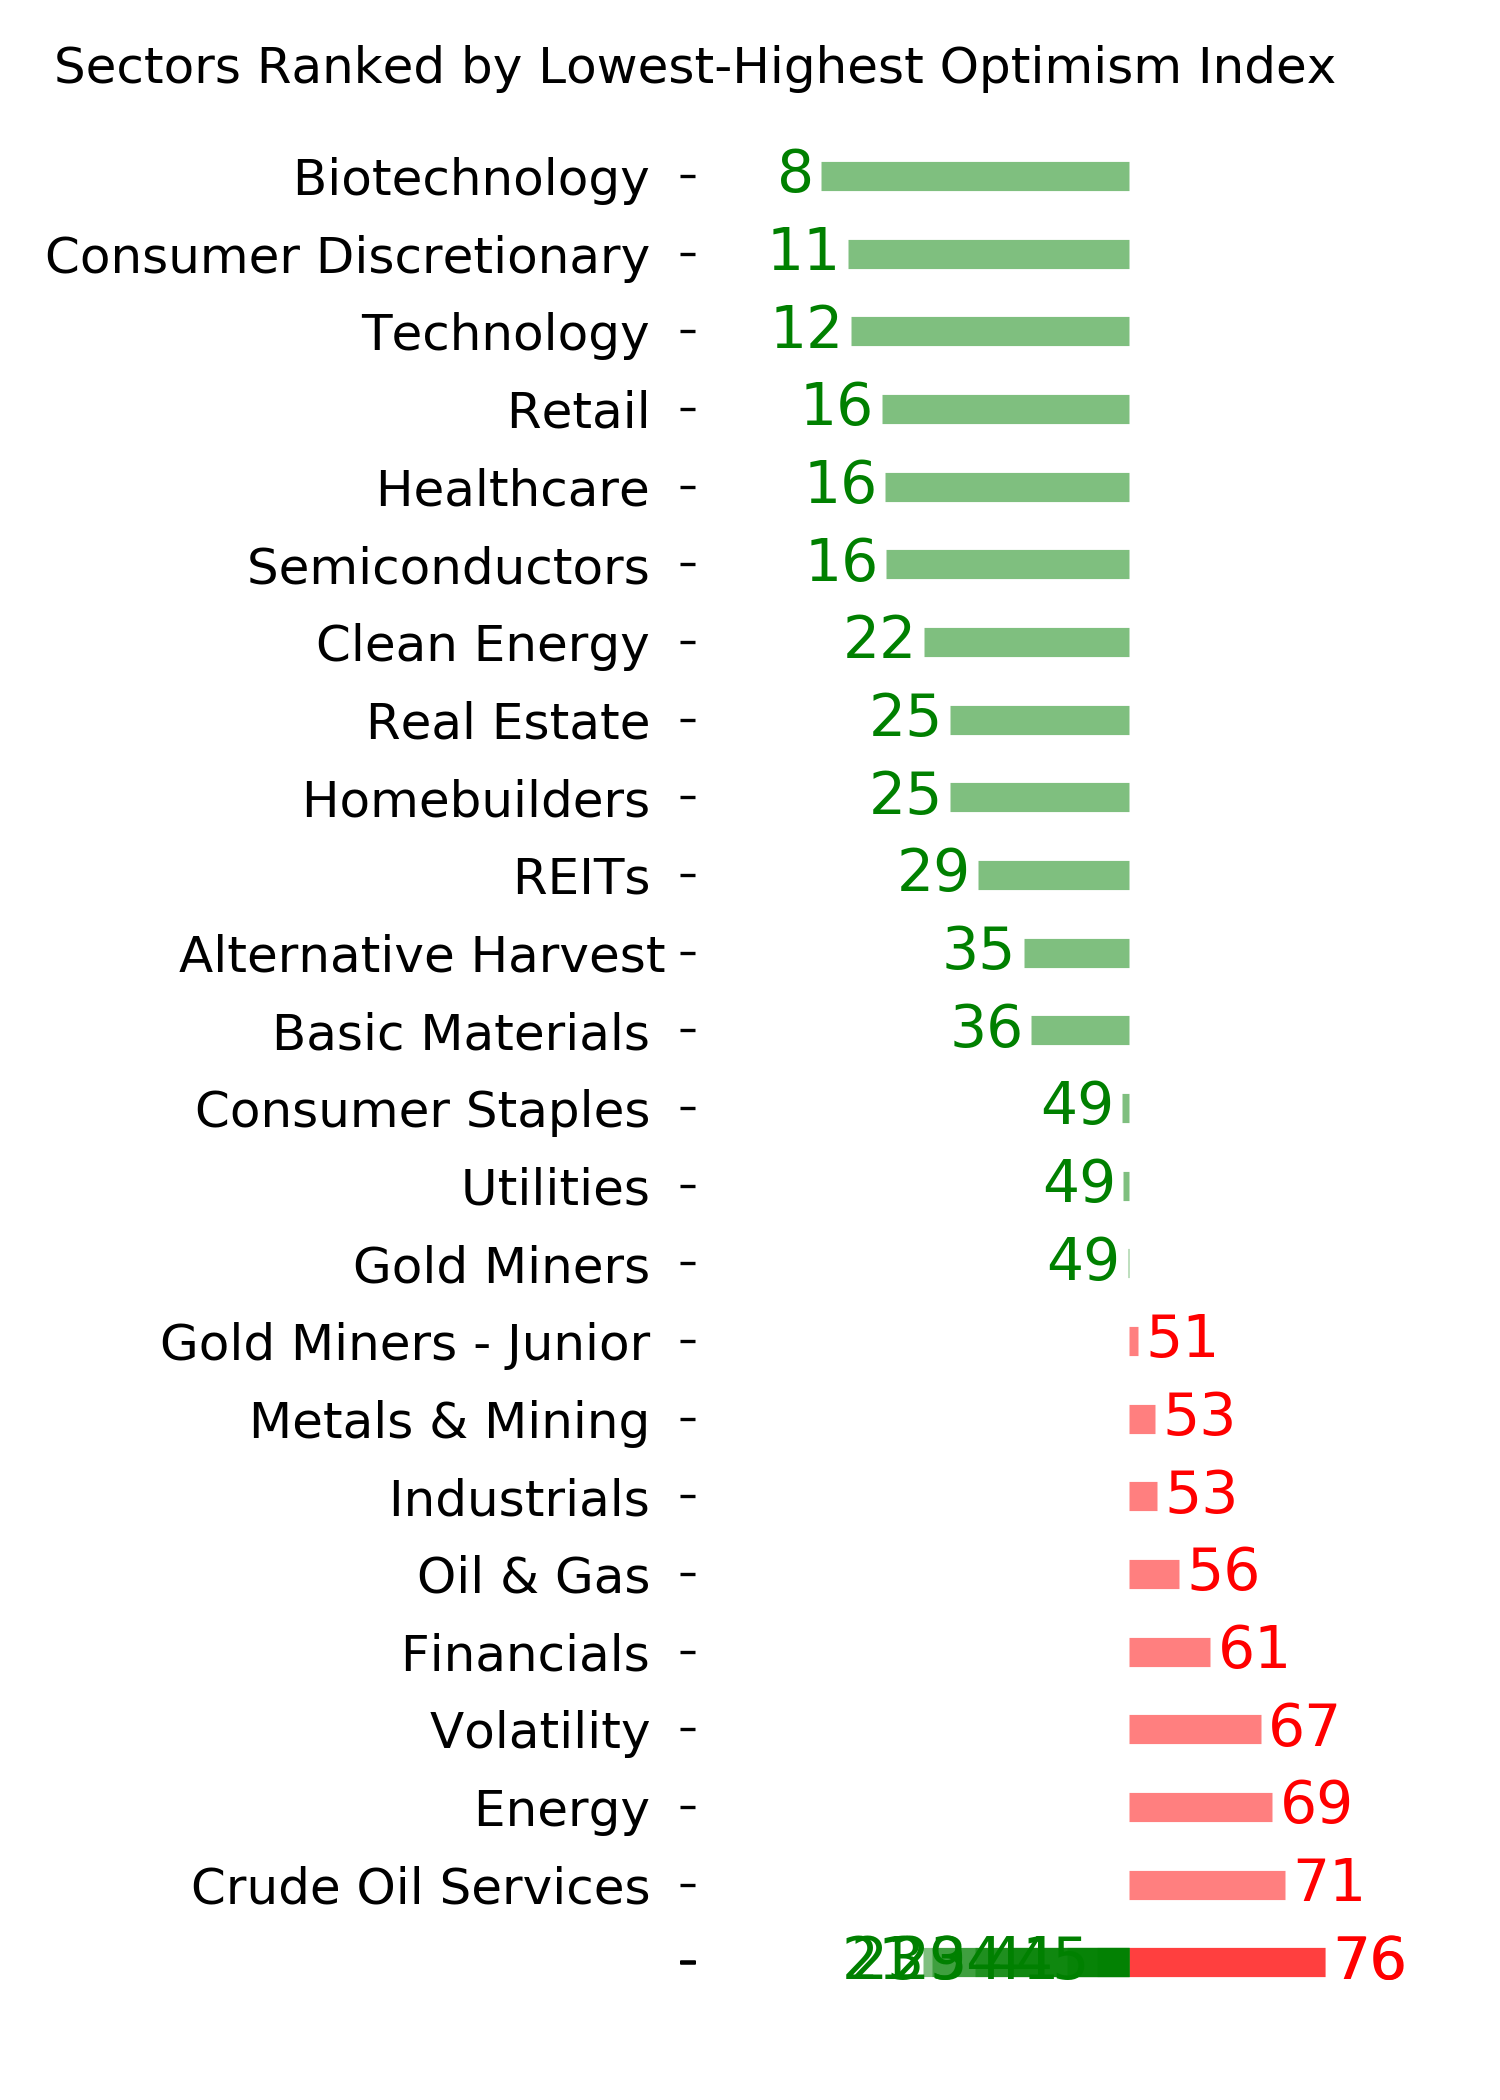
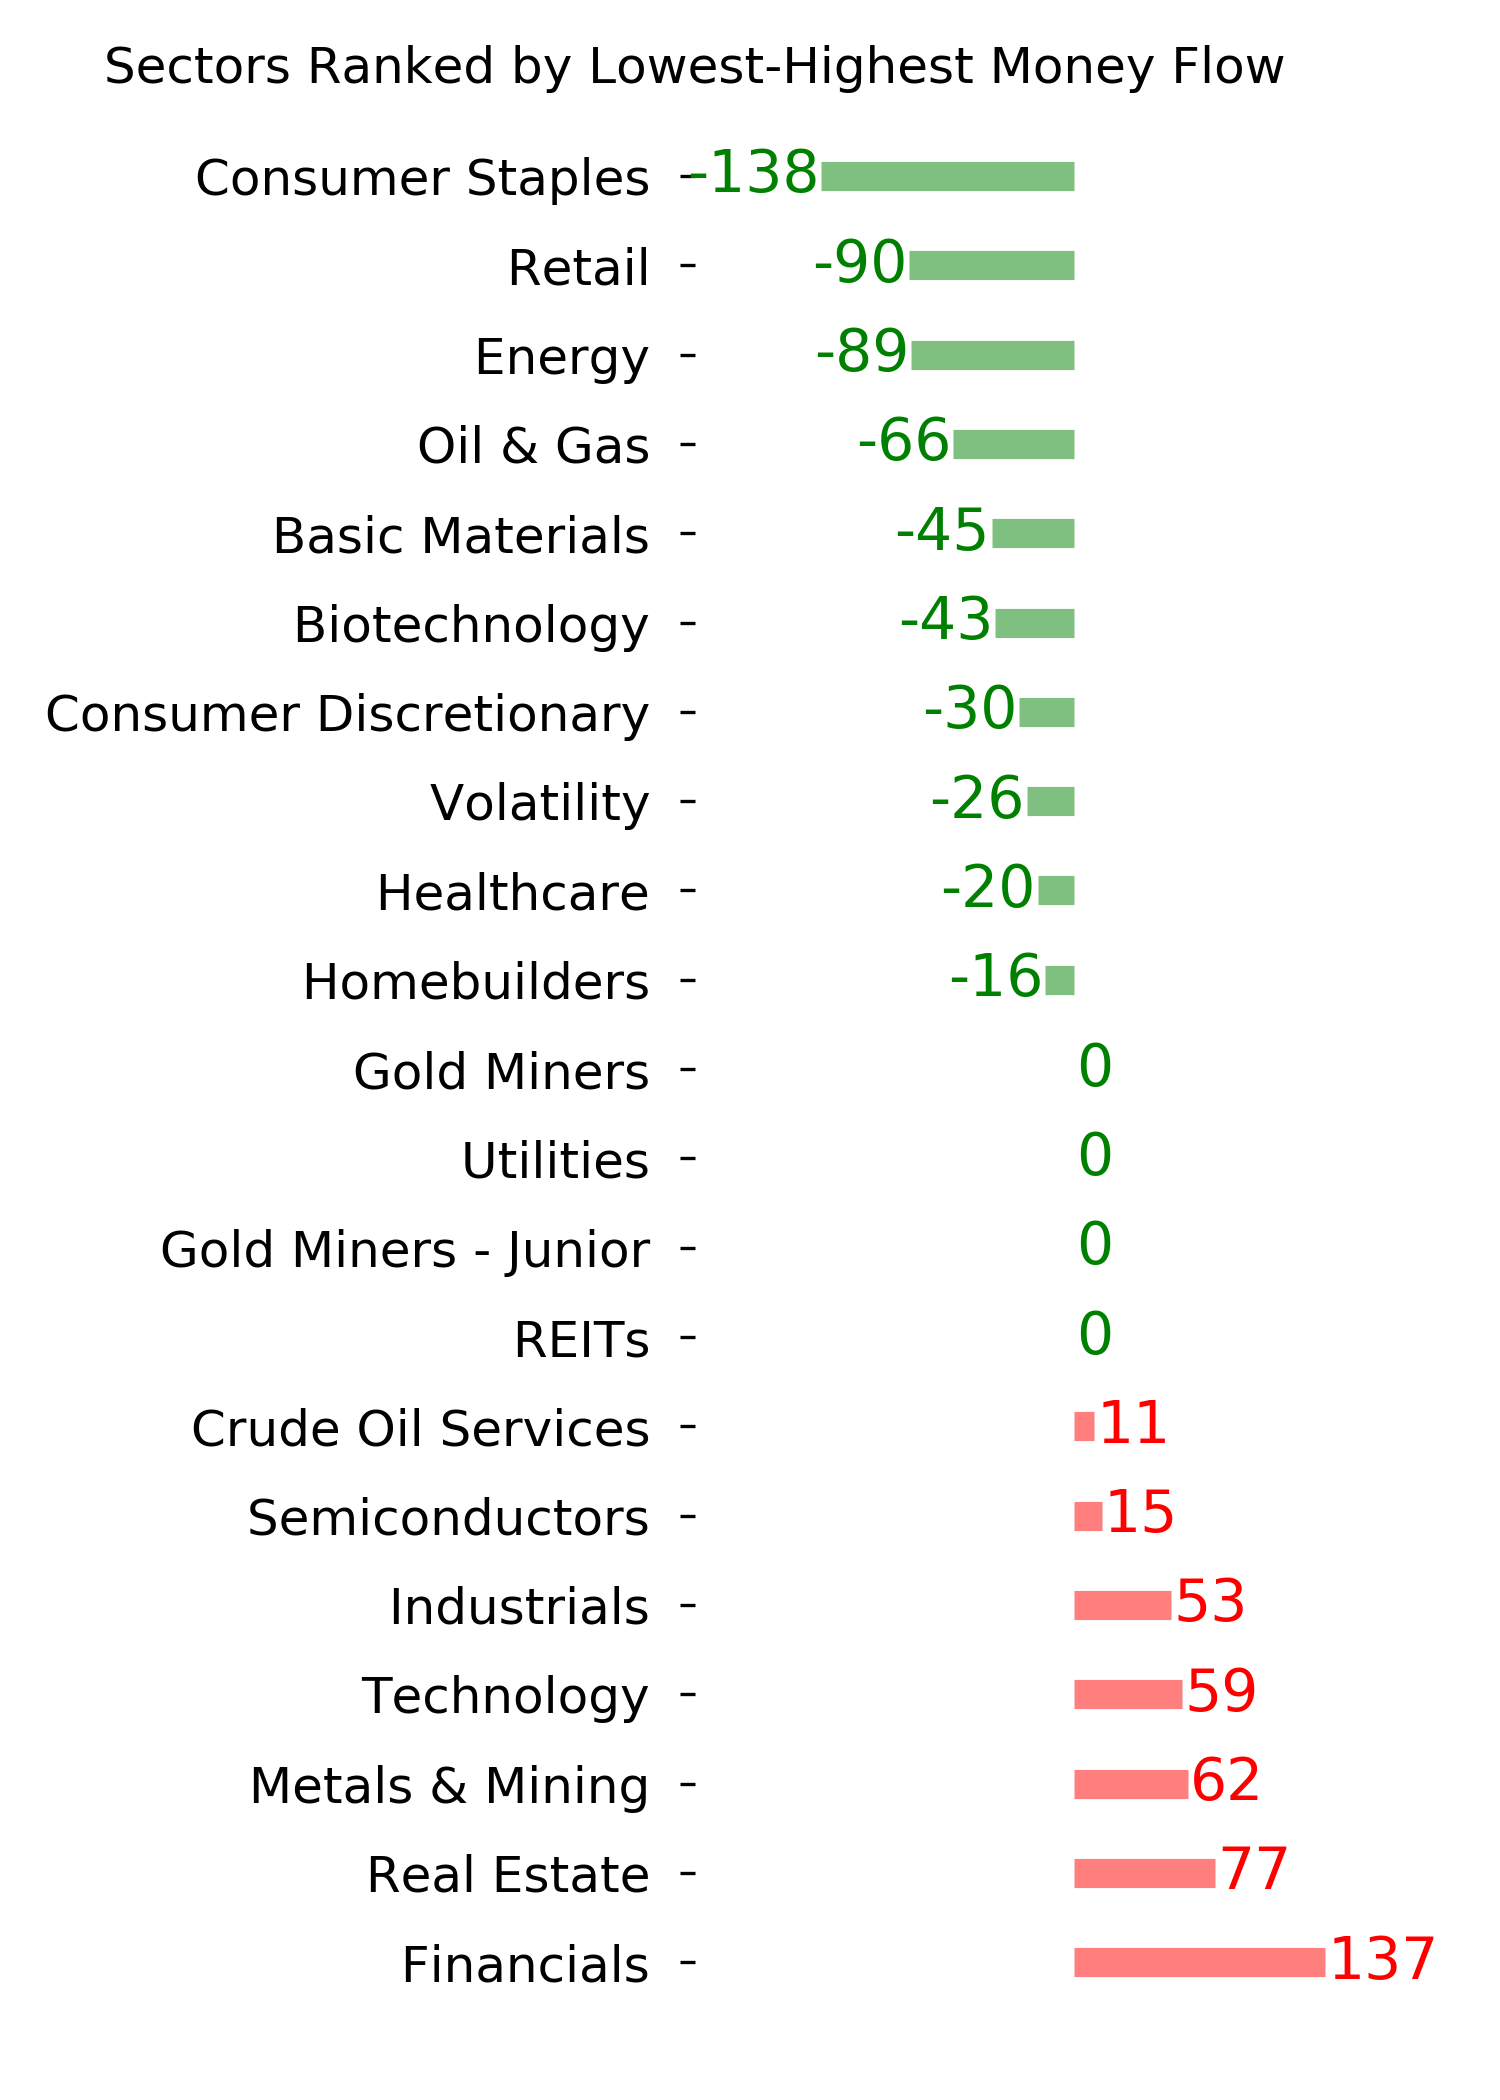
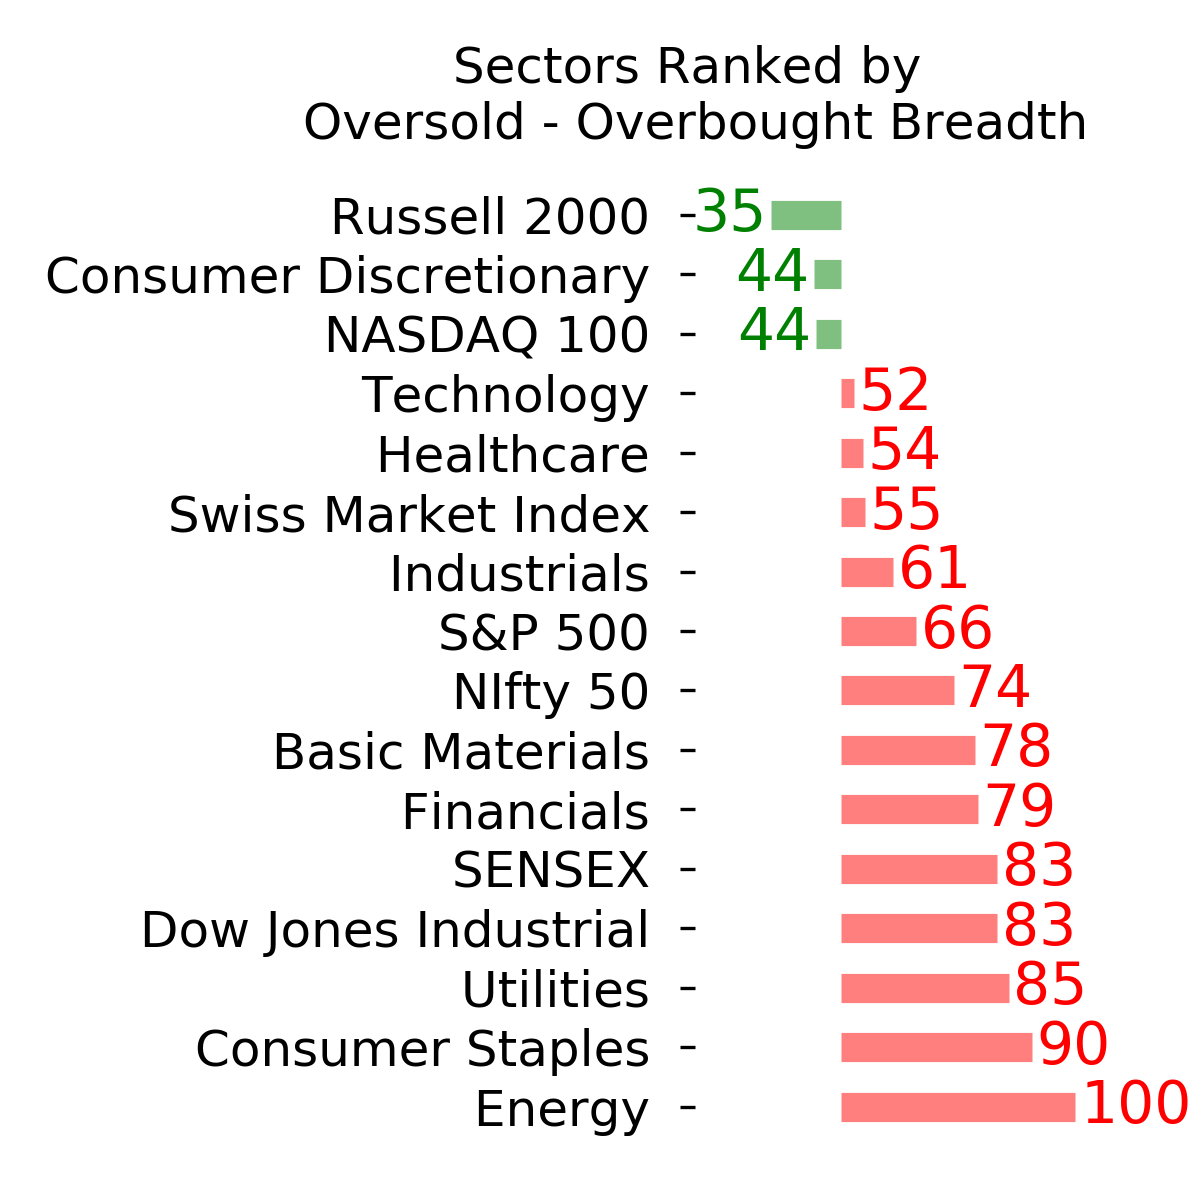
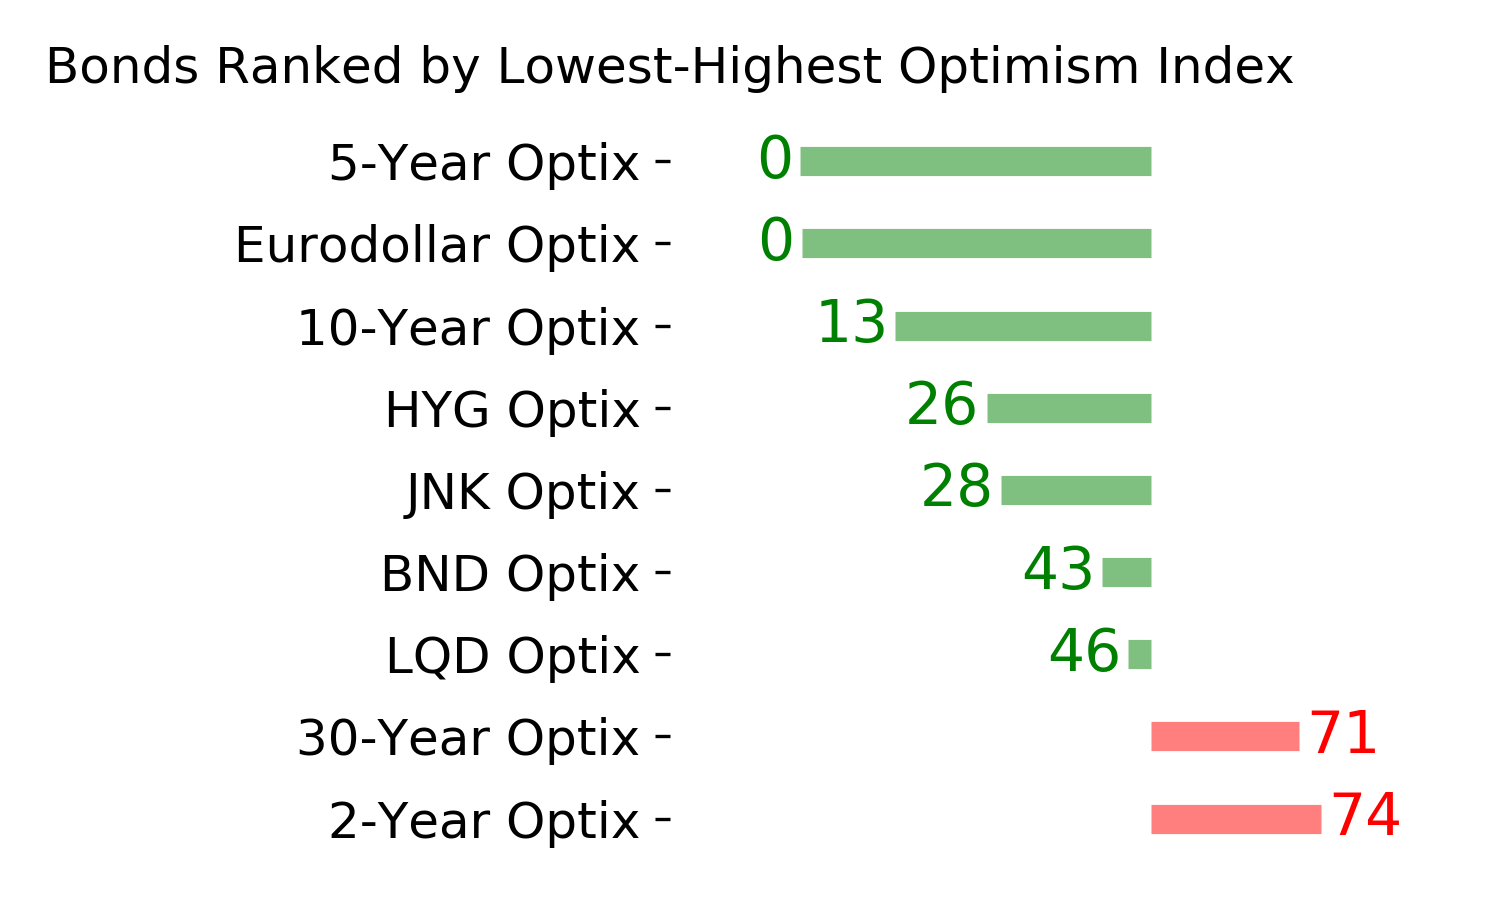
Ranks
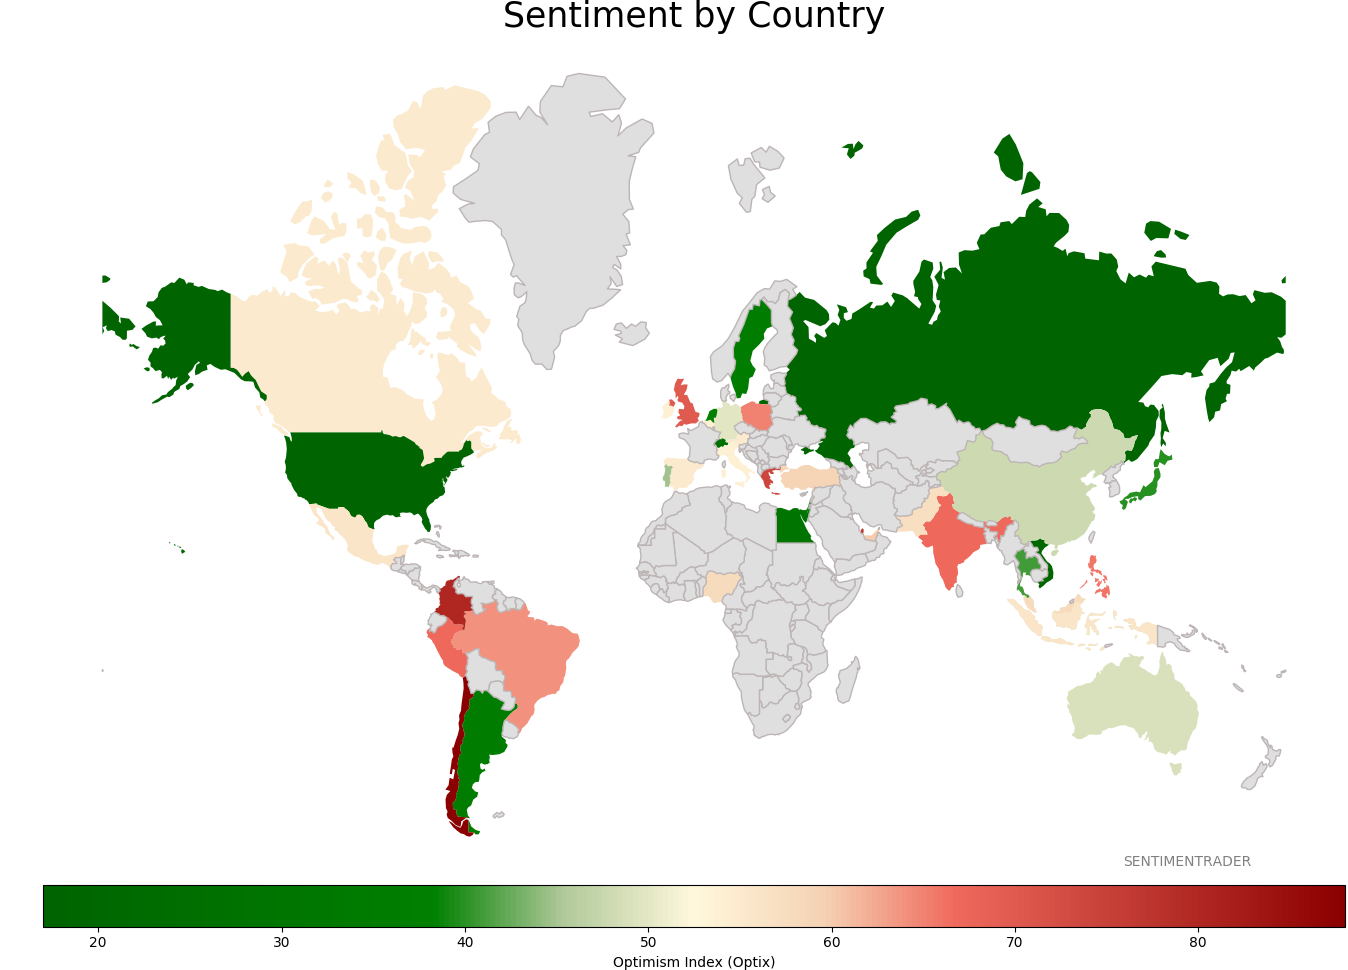
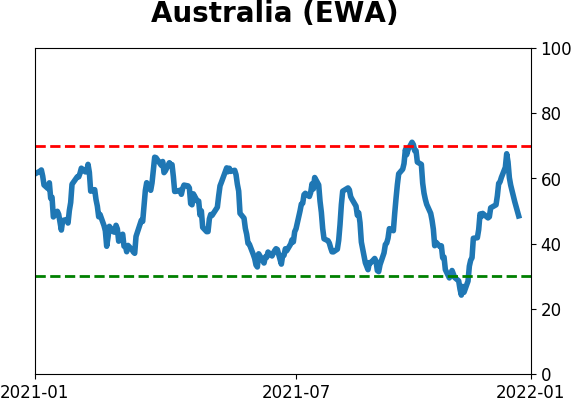
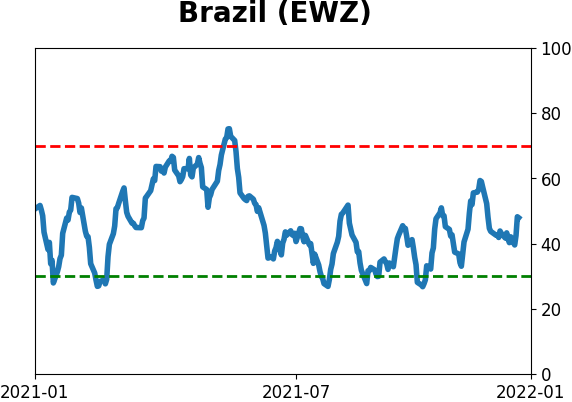
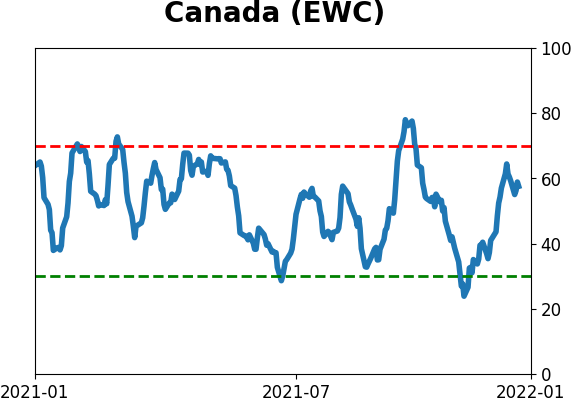
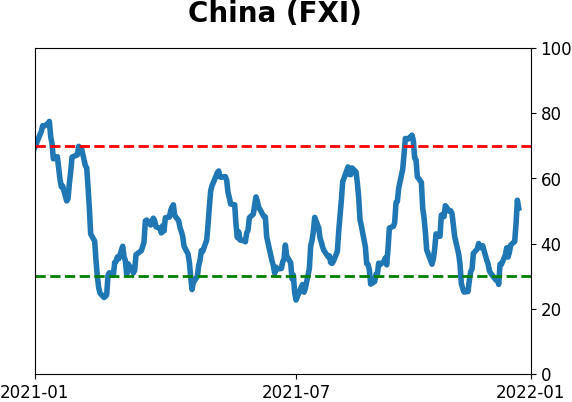
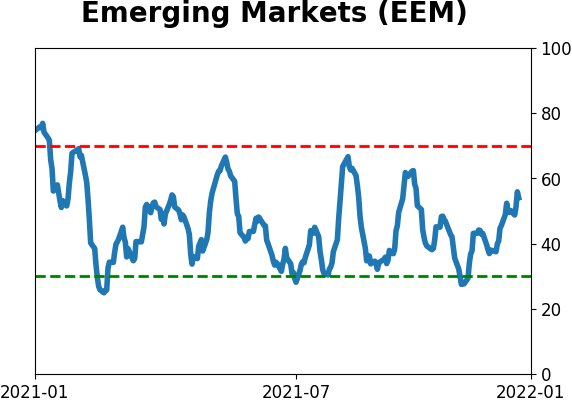
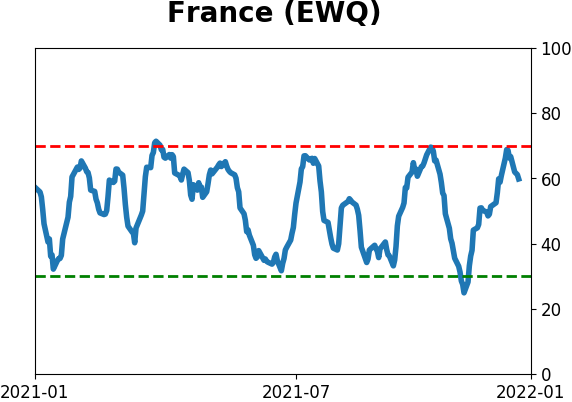
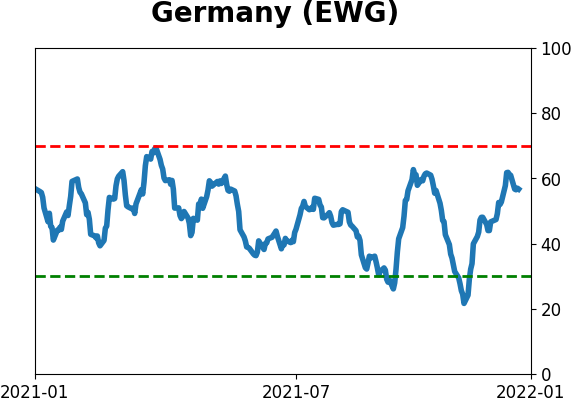
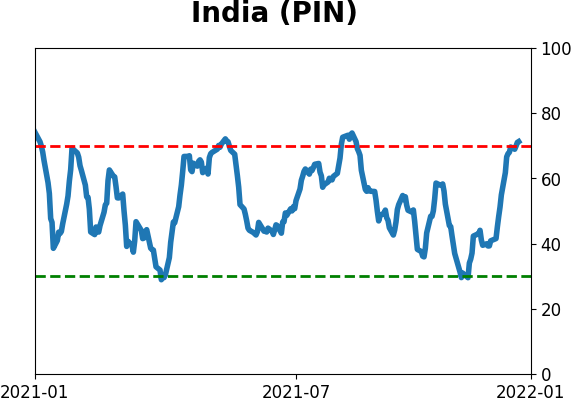
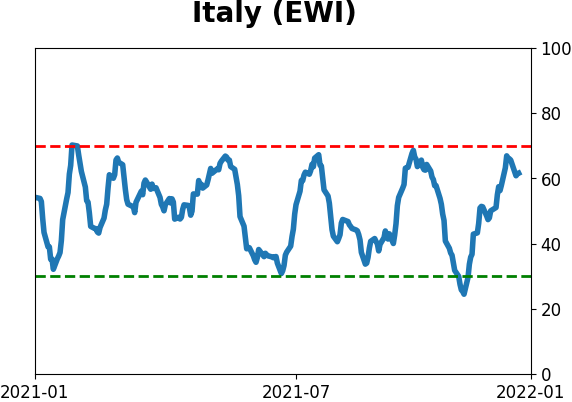
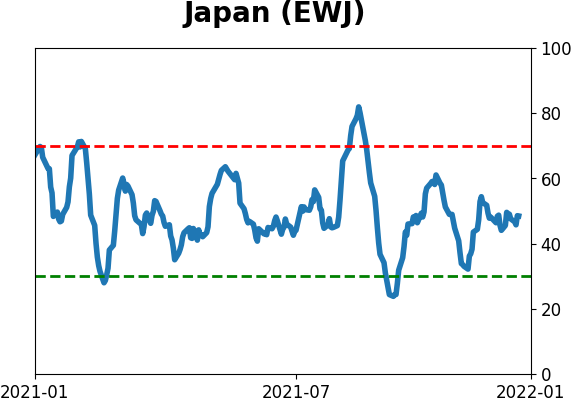
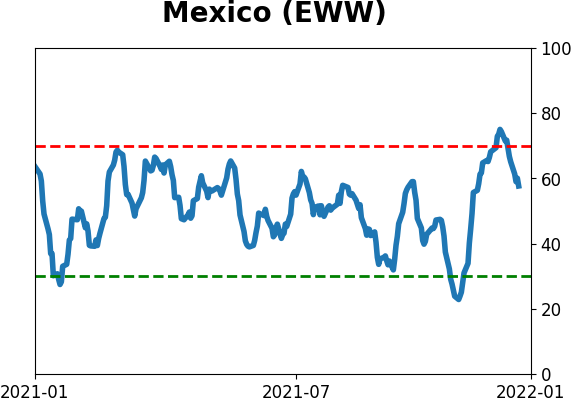
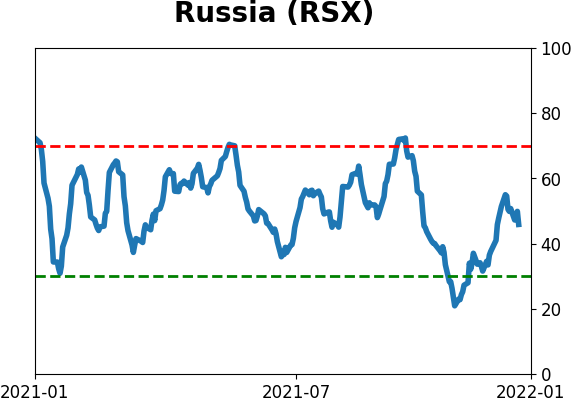
Sentiment Around The World
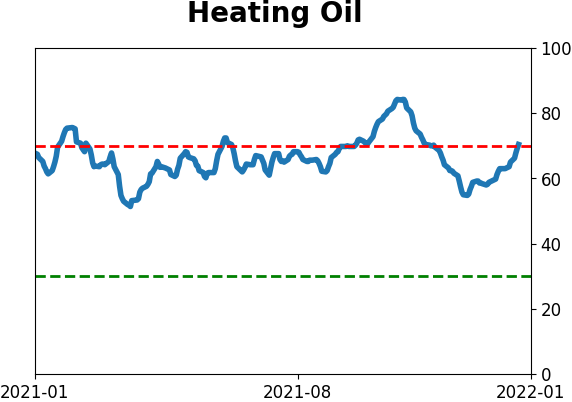
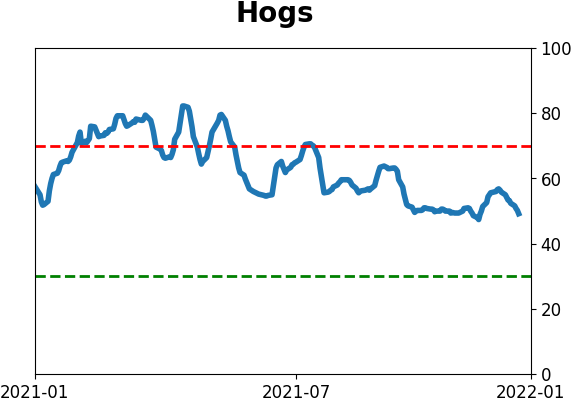
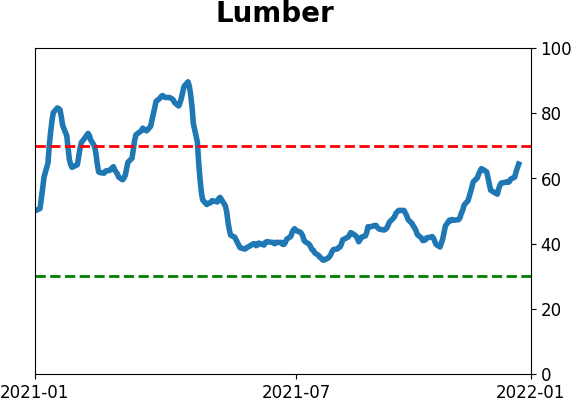
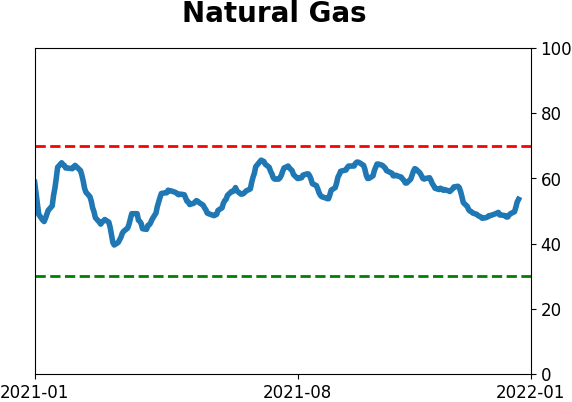
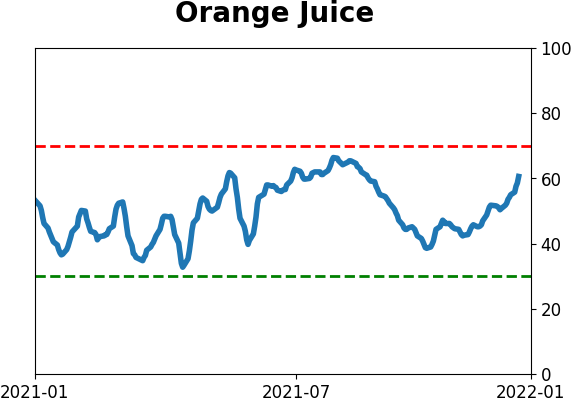
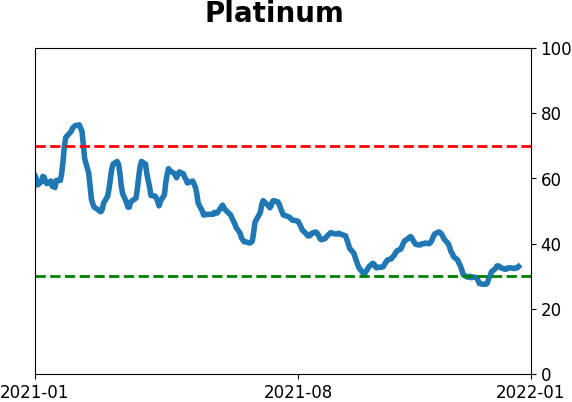
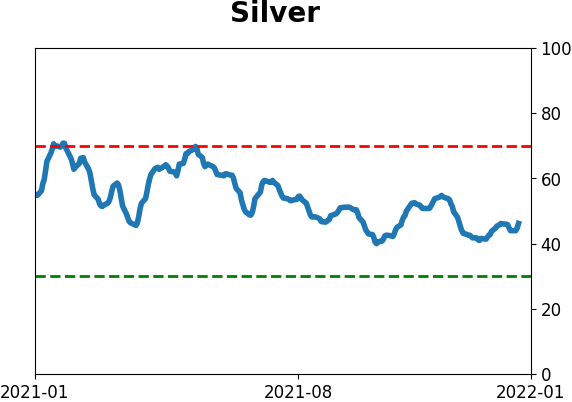
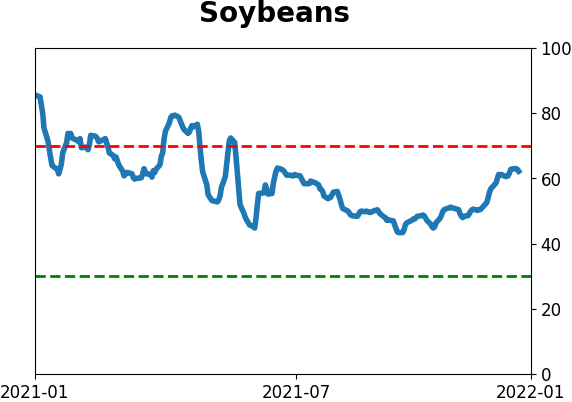
Optimism Index Thumbnails
|
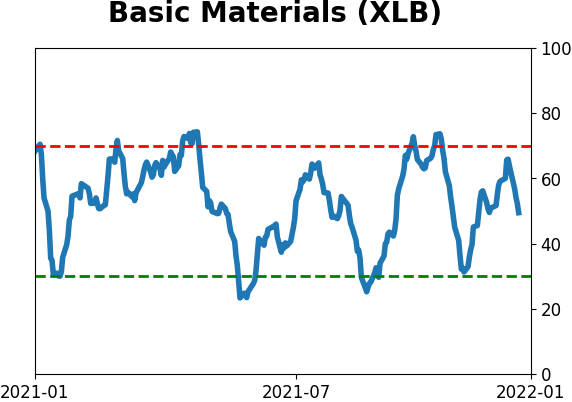
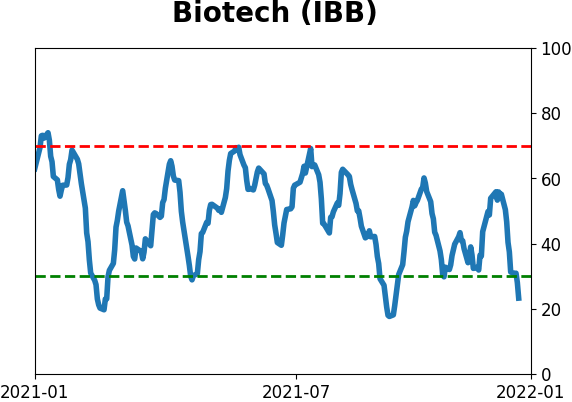
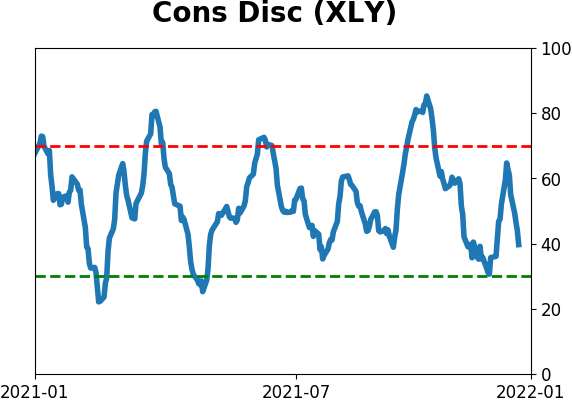
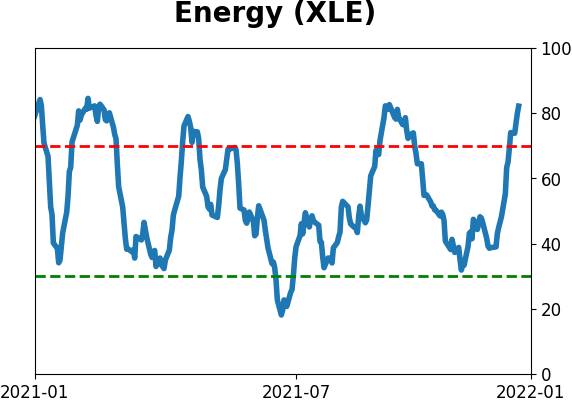
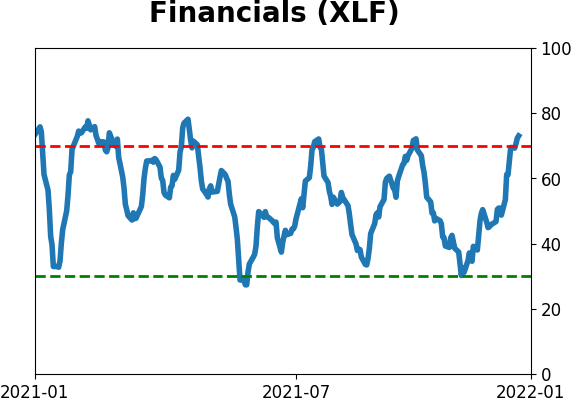
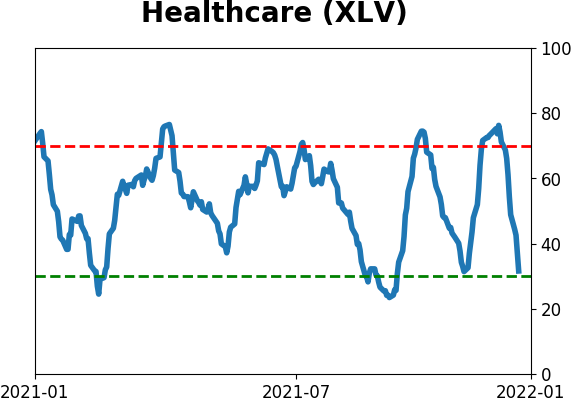
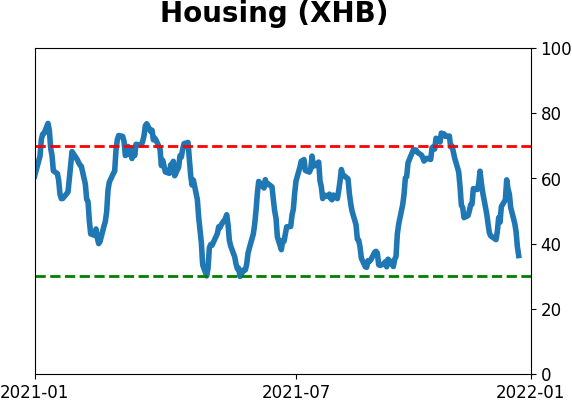
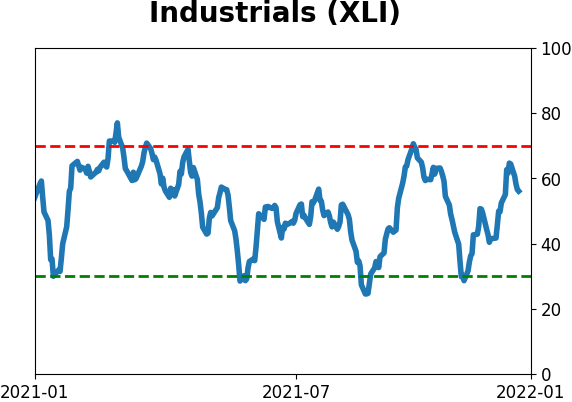
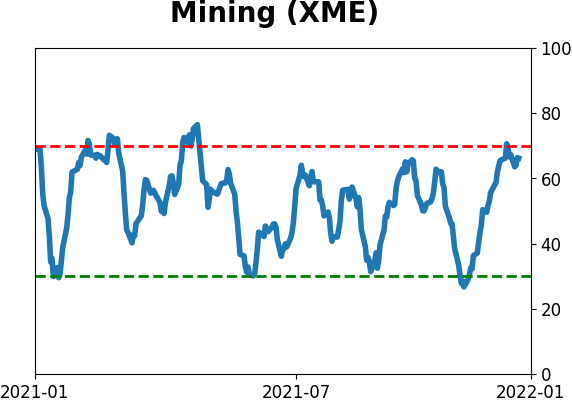
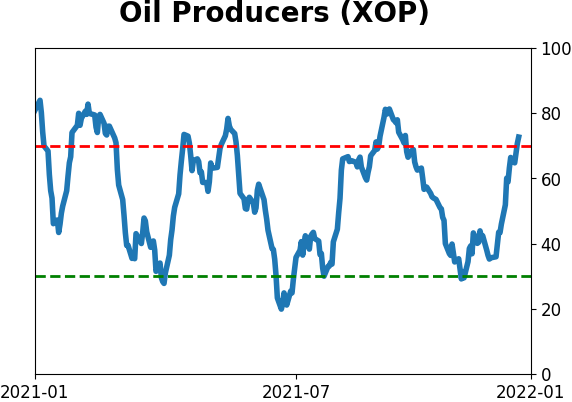
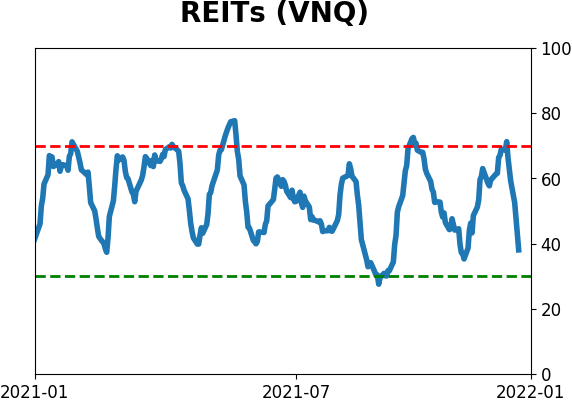
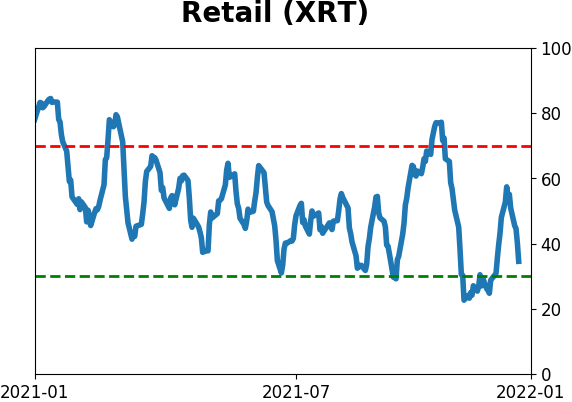
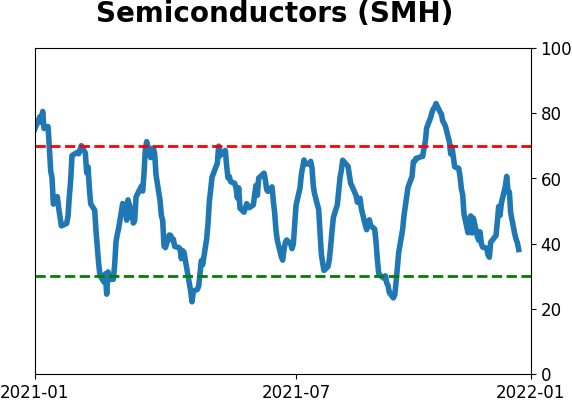
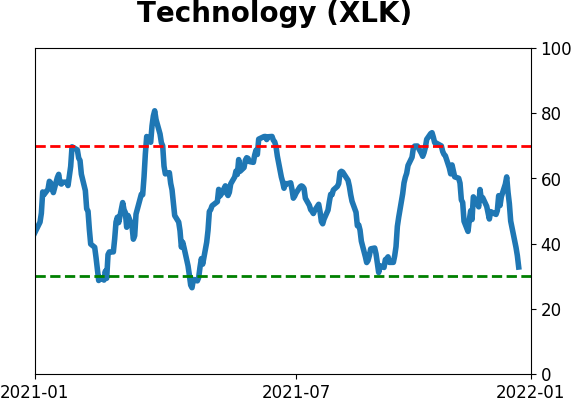
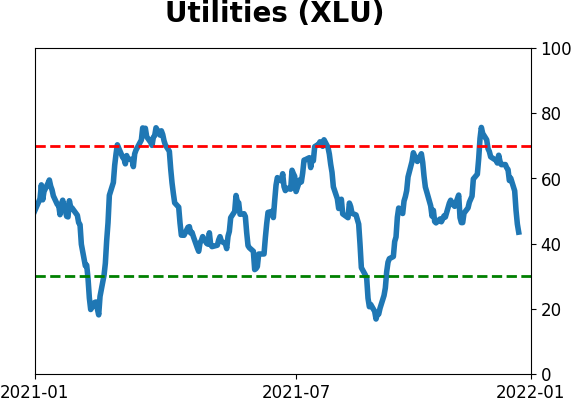
Sector ETF's - 10-Day Moving Average
|
|
|
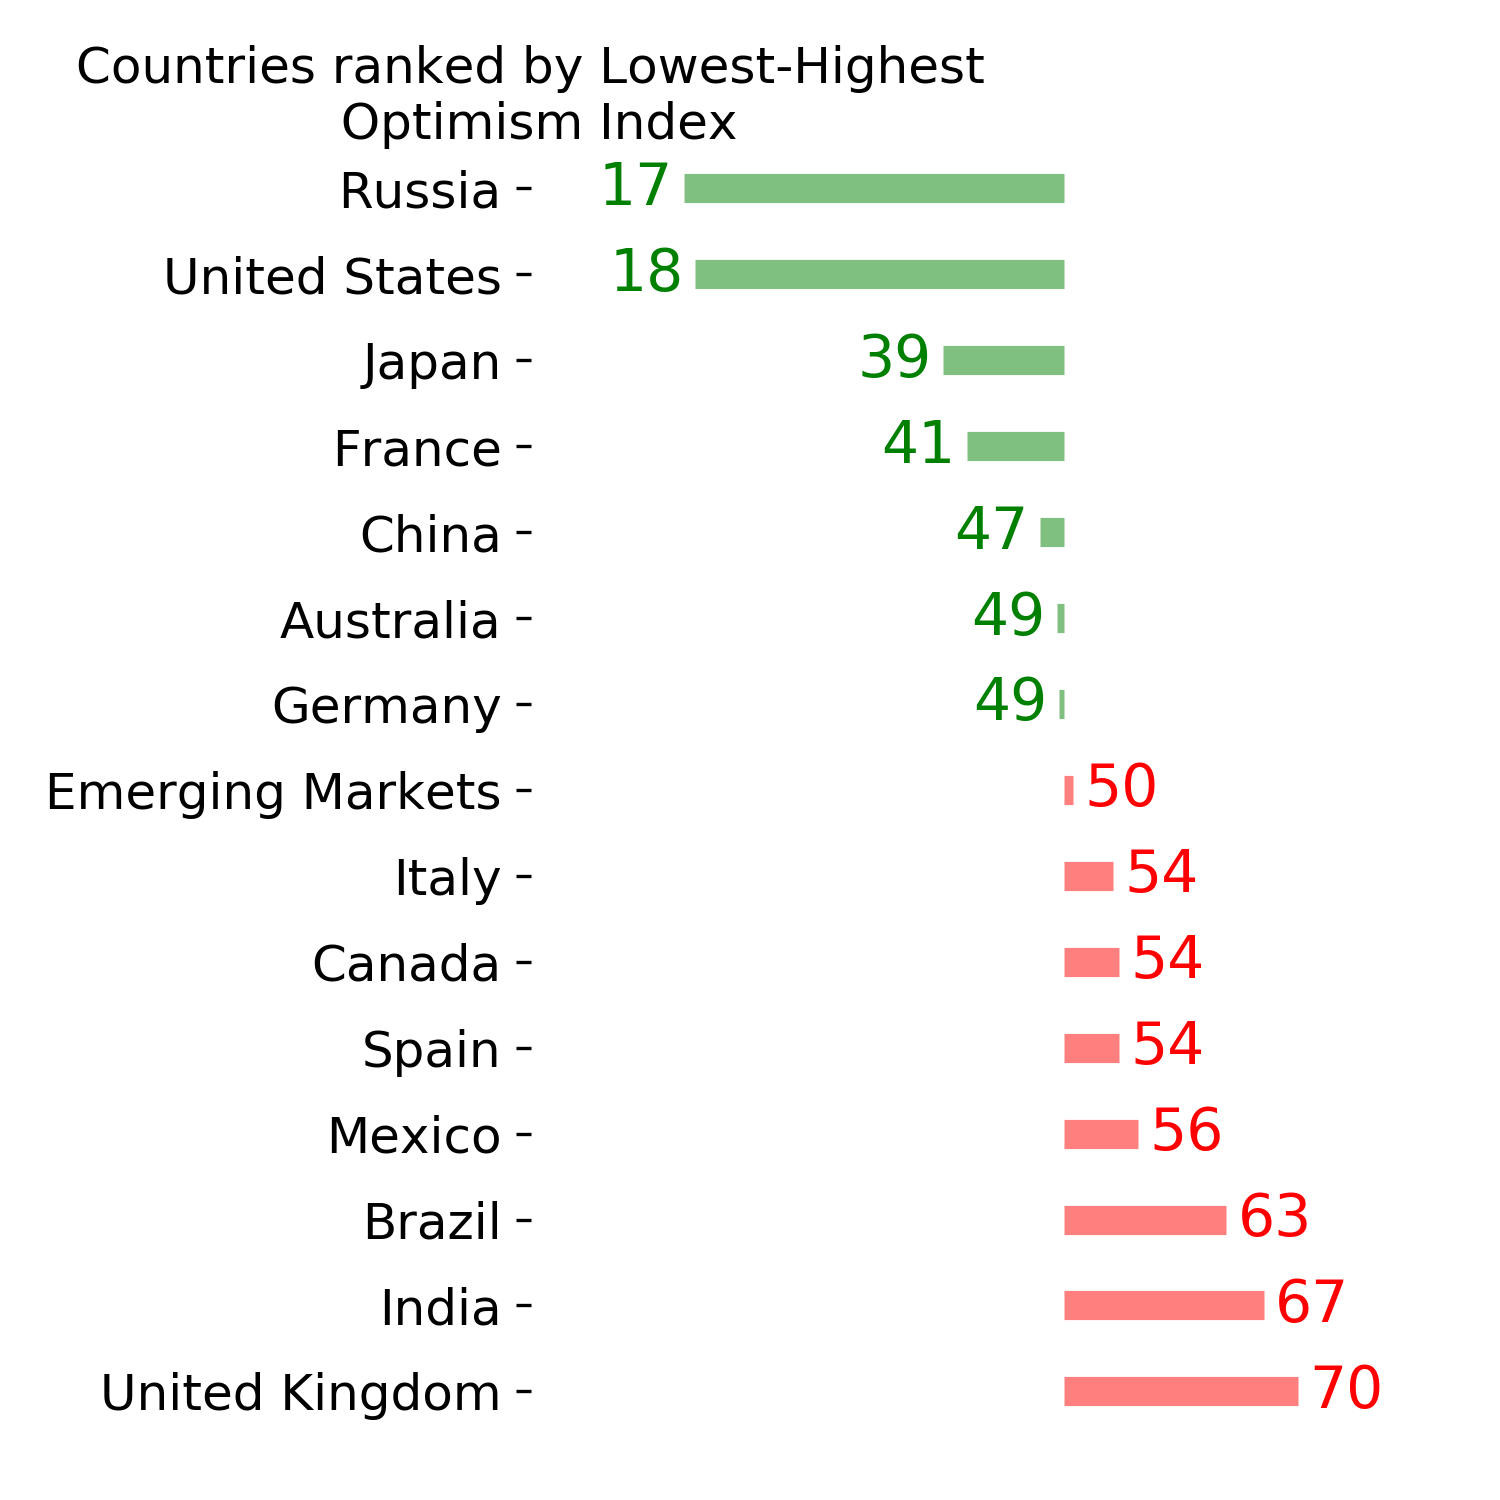
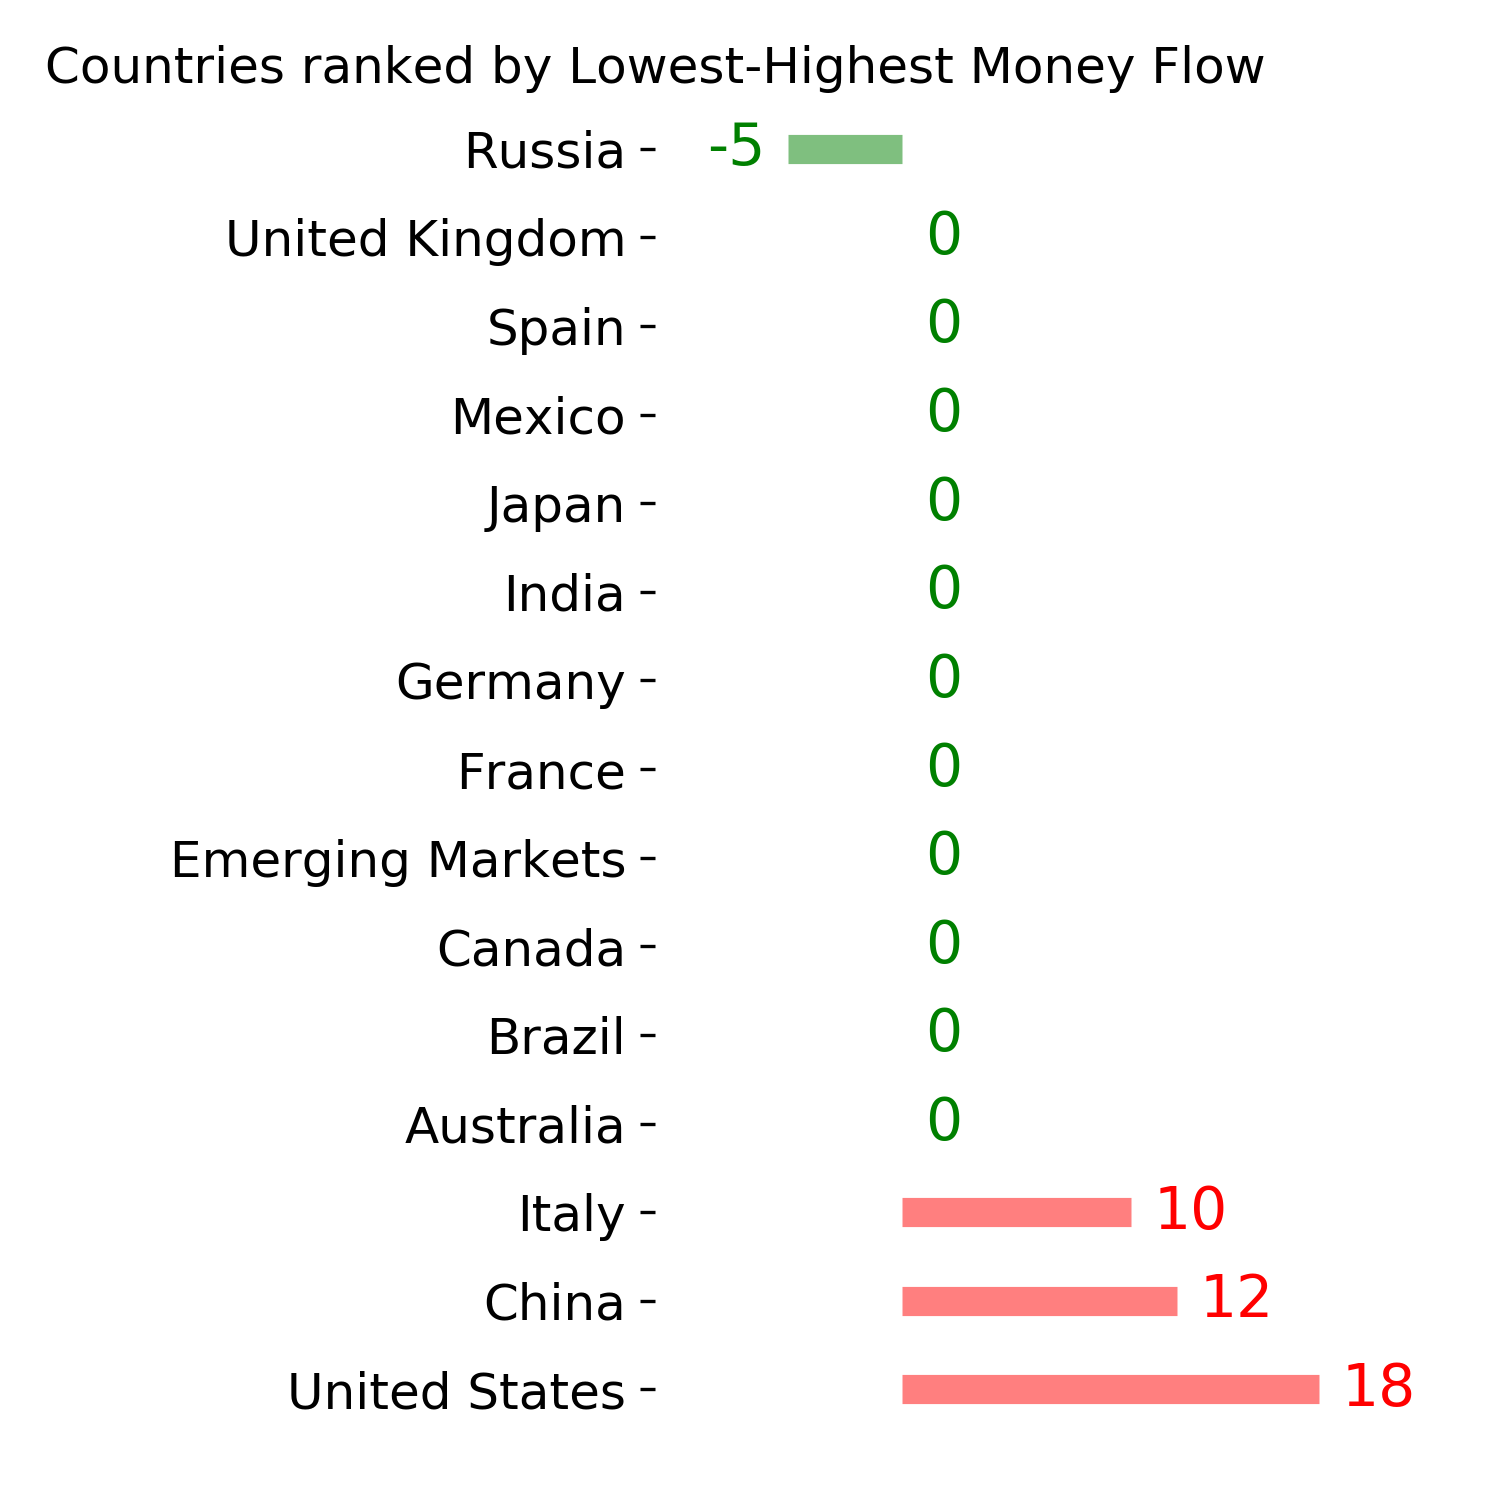
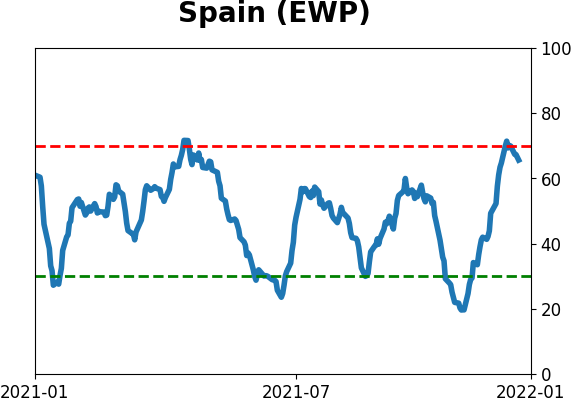
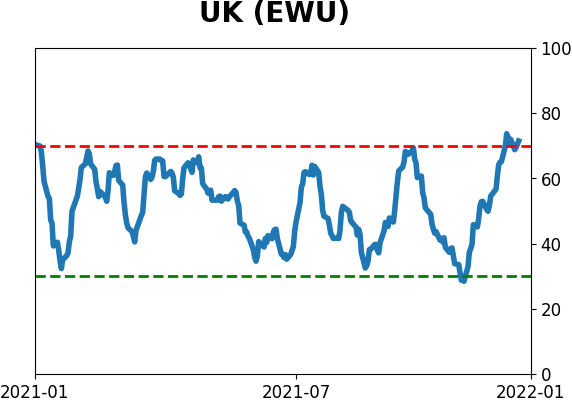
Country ETF's - 10-Day Moving Average
|
|
|
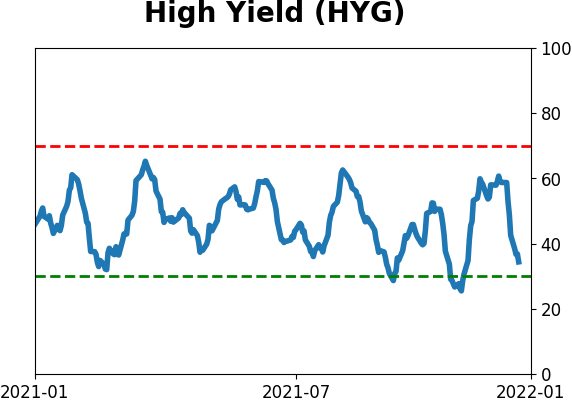
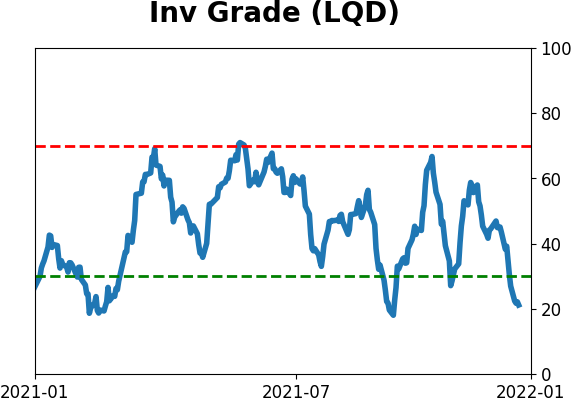
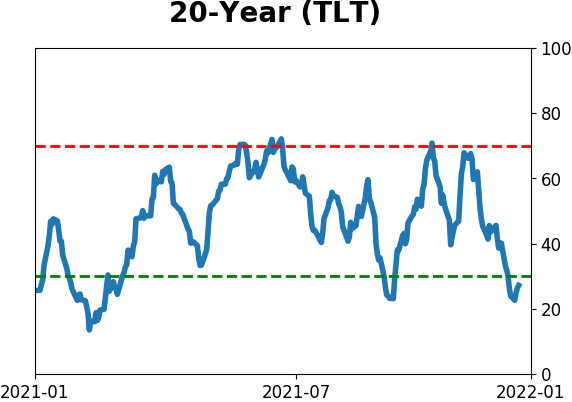
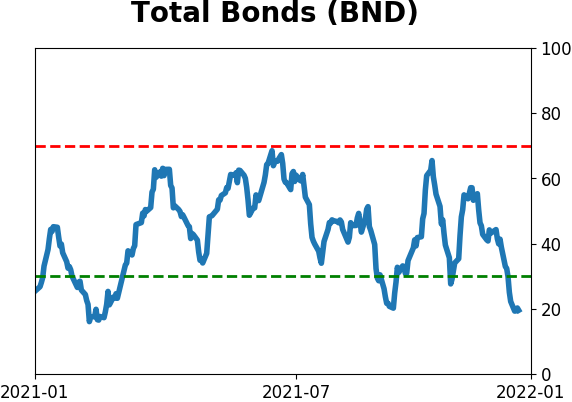
Bond ETF's - 10-Day Moving Average
|
|
|
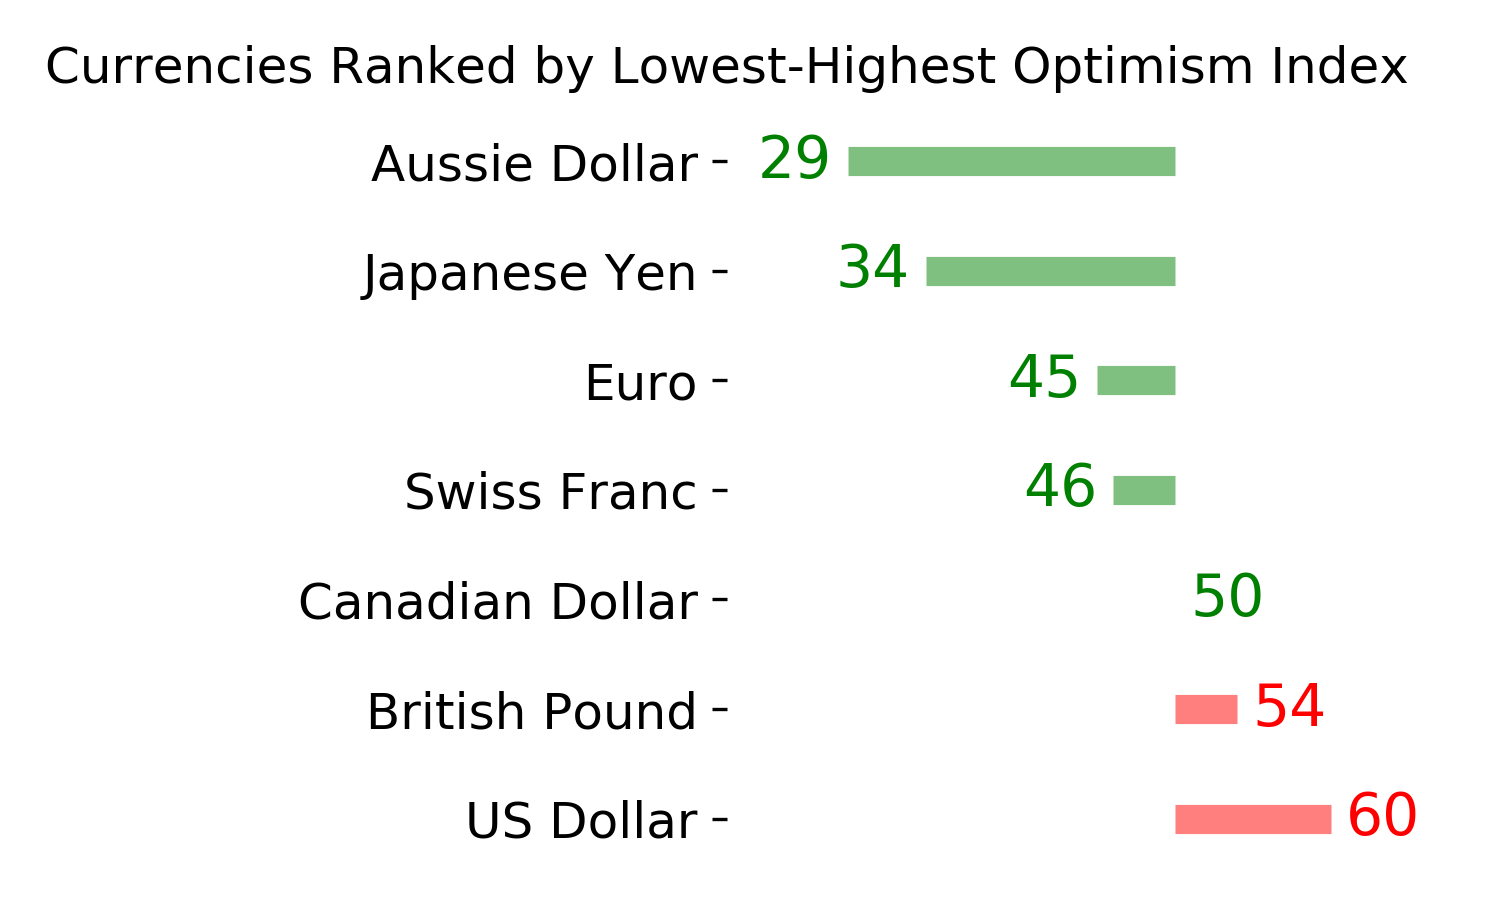
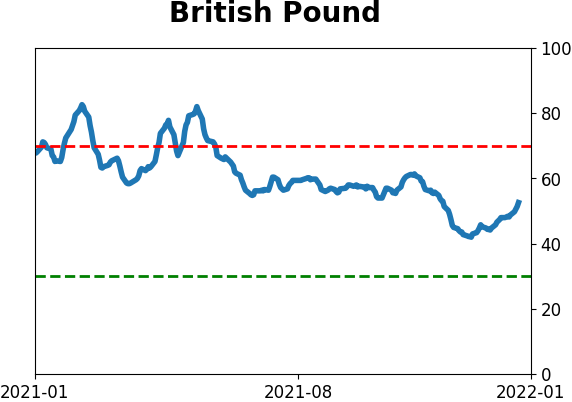
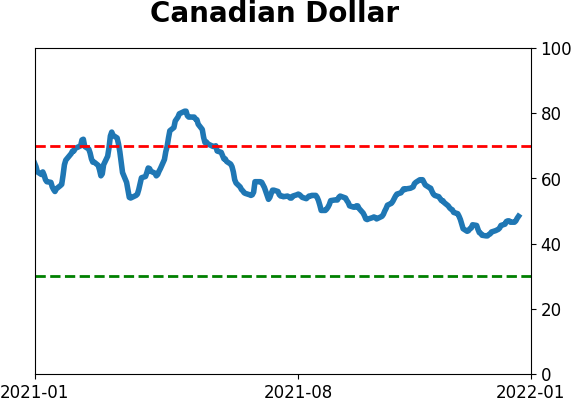
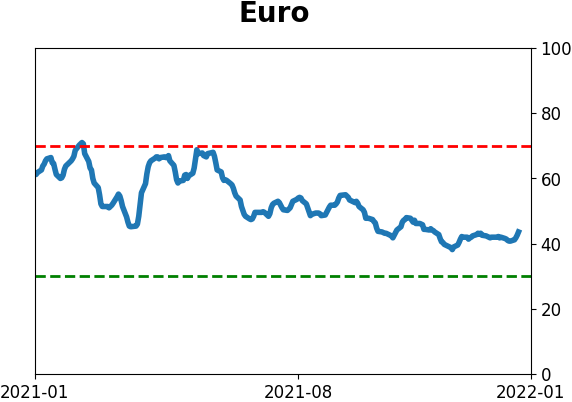
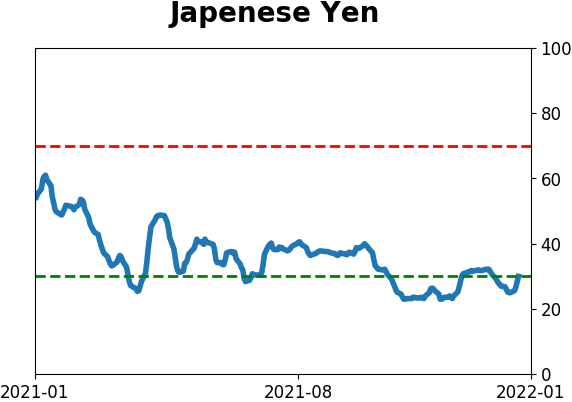
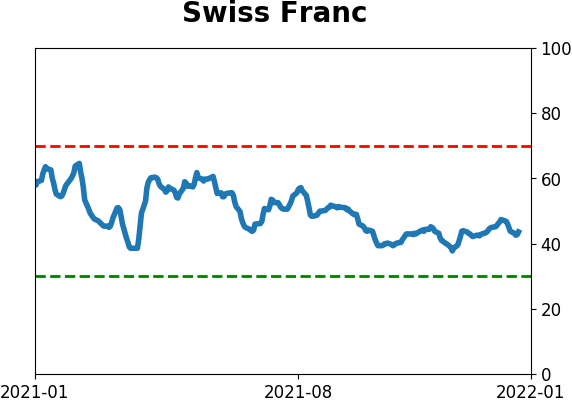
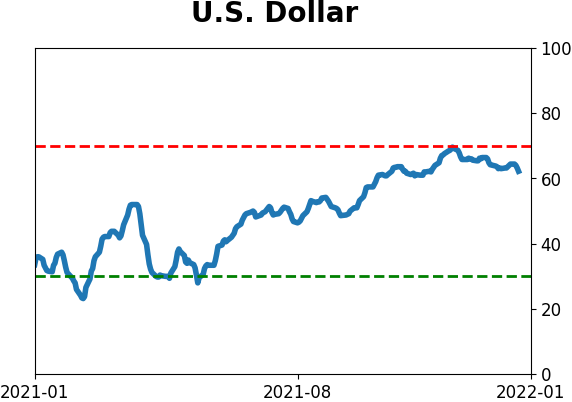
Currency ETF's - 5-Day Moving Average
|
|
|
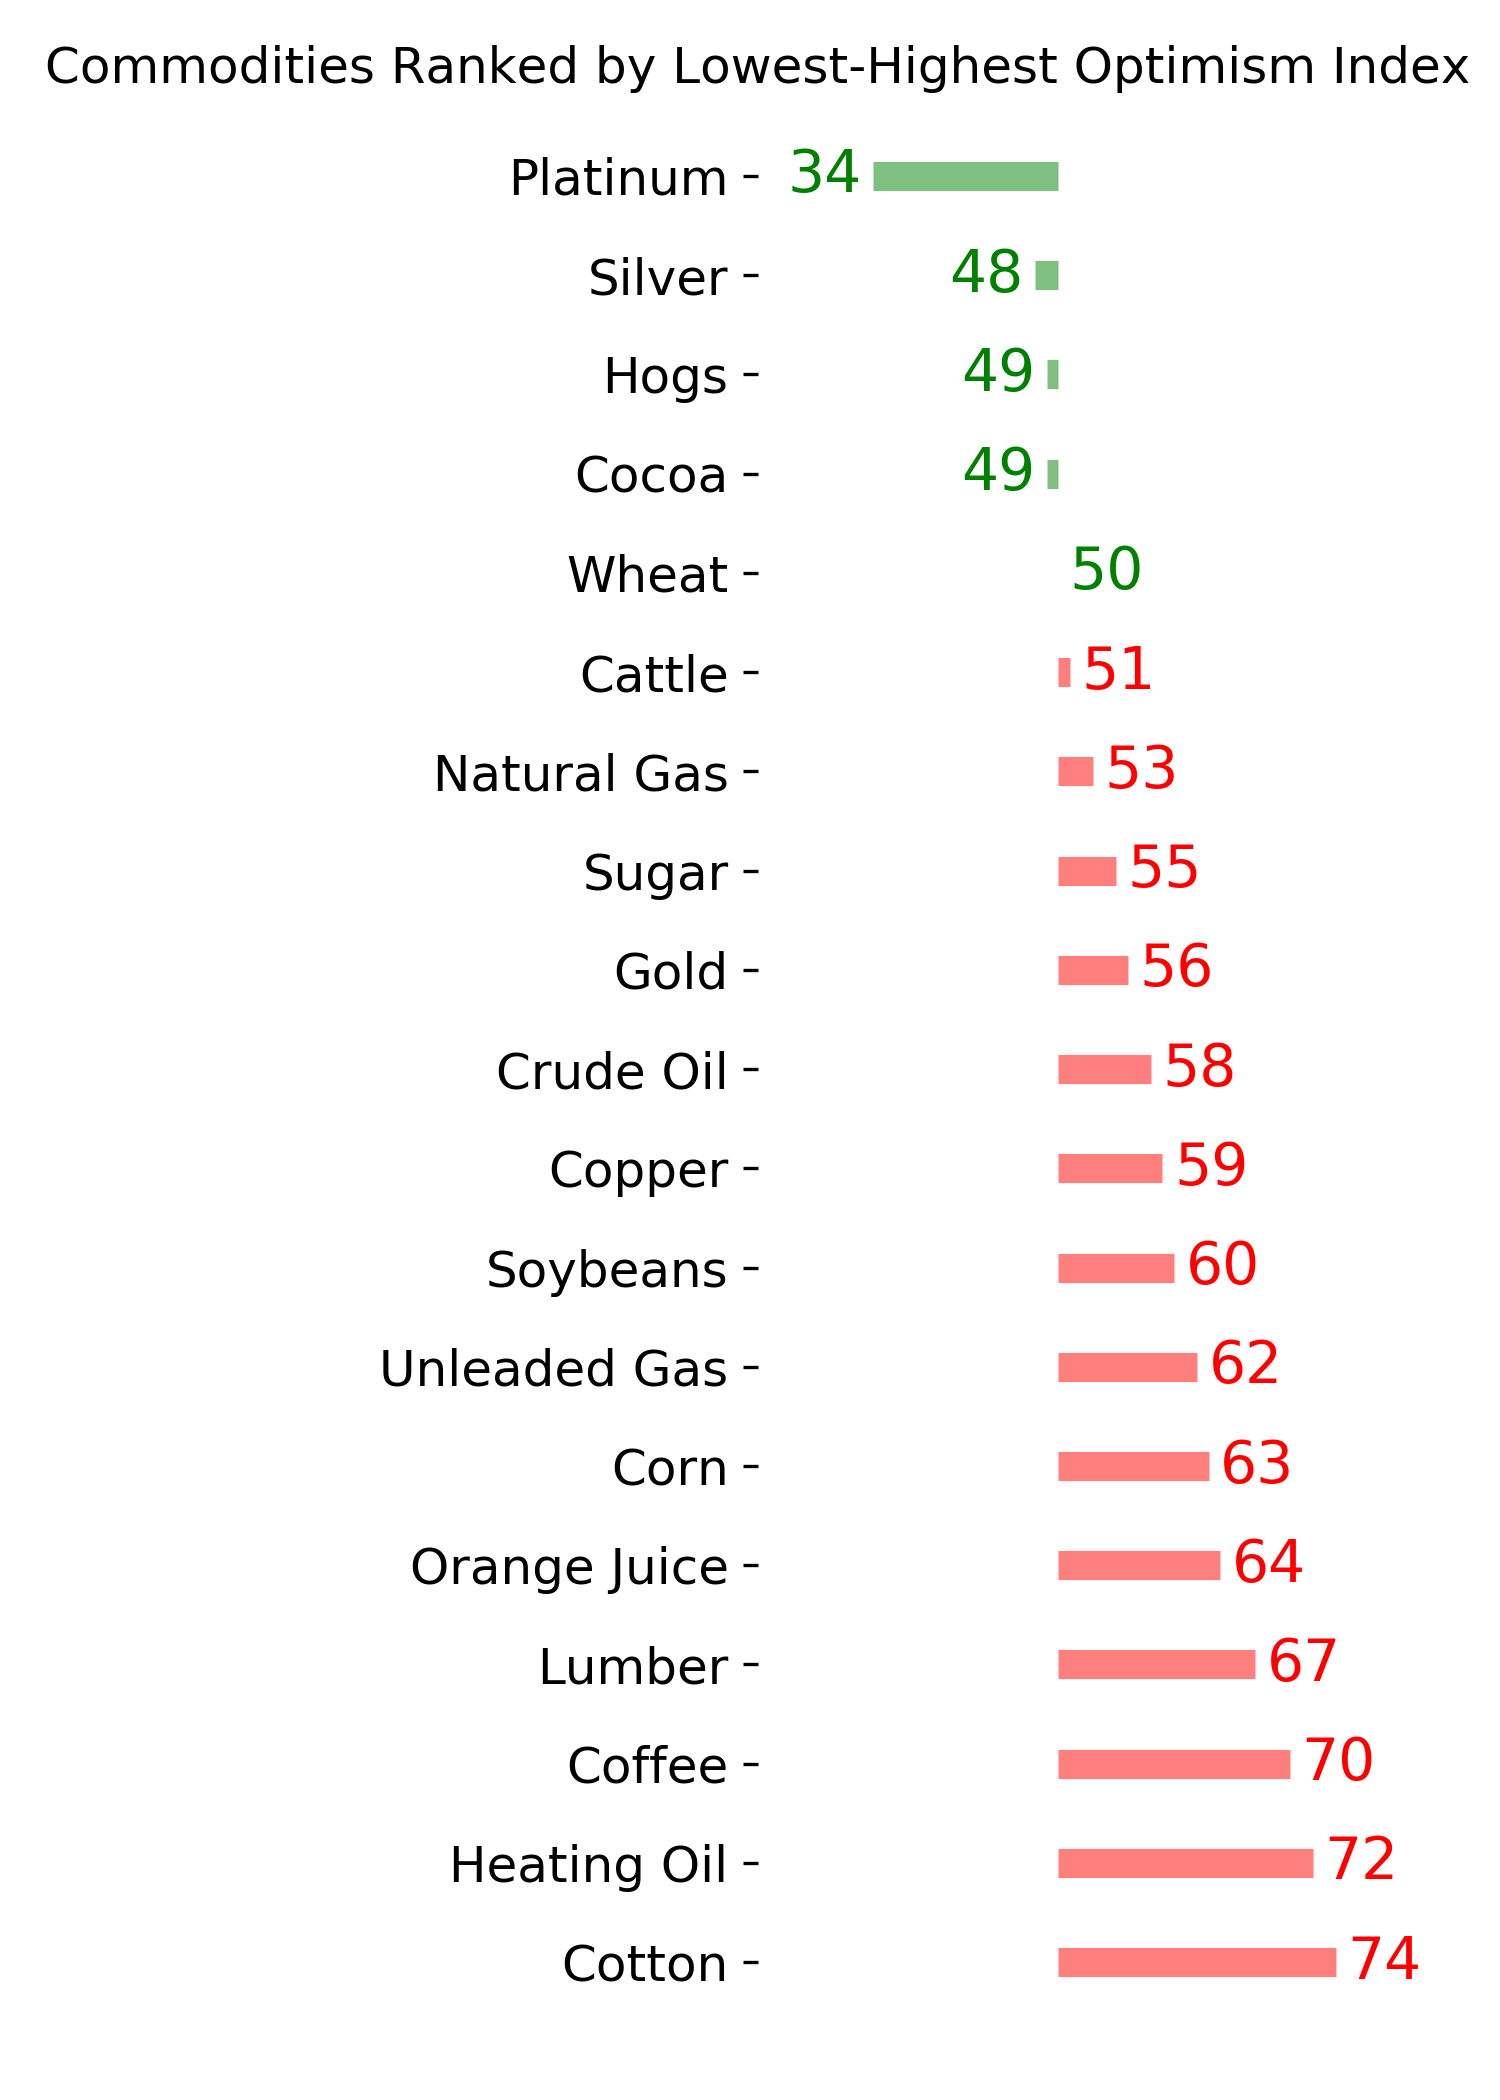
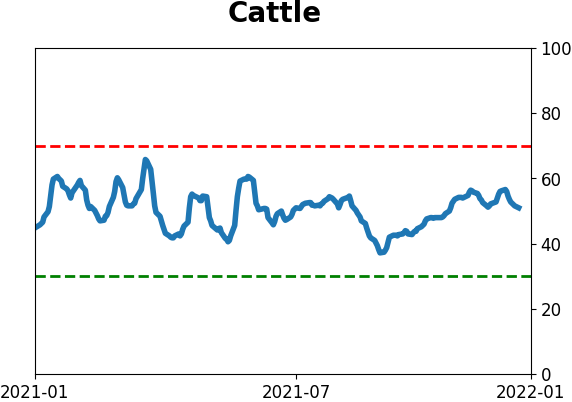
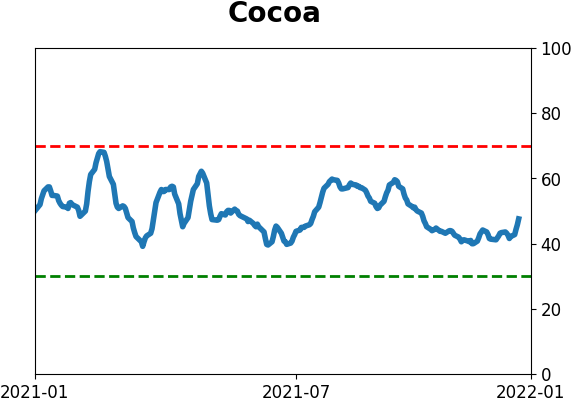
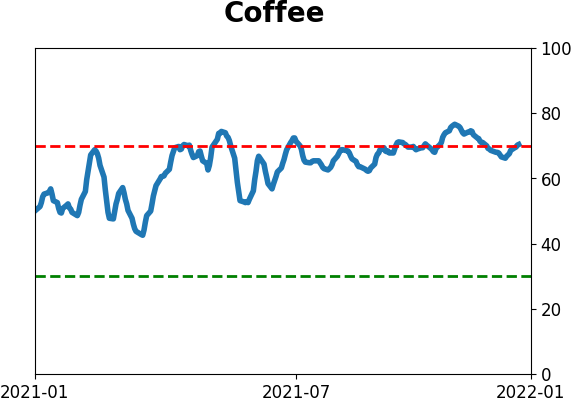
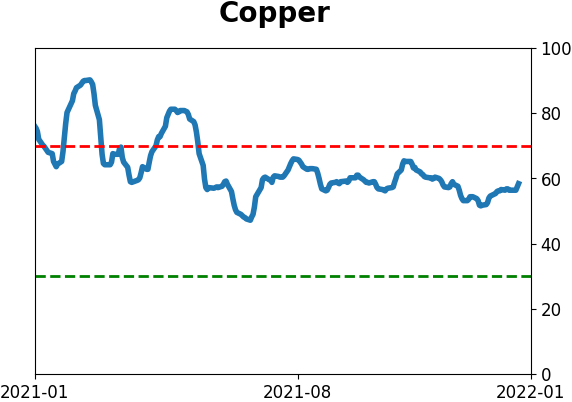
Commodity ETF's - 5-Day Moving Average
|
|