Headlines
|
|
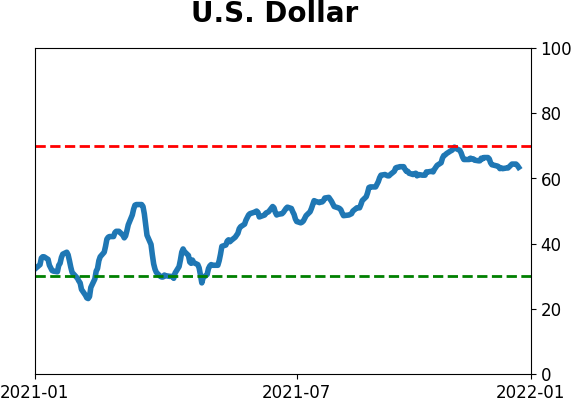
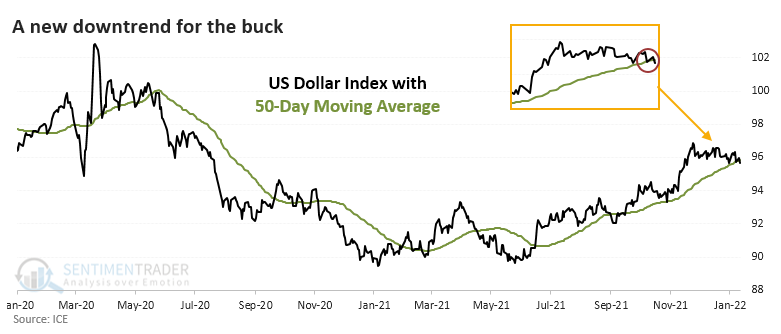
After surge in optimism, the dollar falls into a downtrend:
For the first time in almost 4 months, the U.S. dollar closed below its 50-day average. This is coming on the heels of a bout of excessive optimism. Those factors tend to precede more losses for the dollar, though it didn't necessarily translate to consistent gains (or losses) in other markets.
|
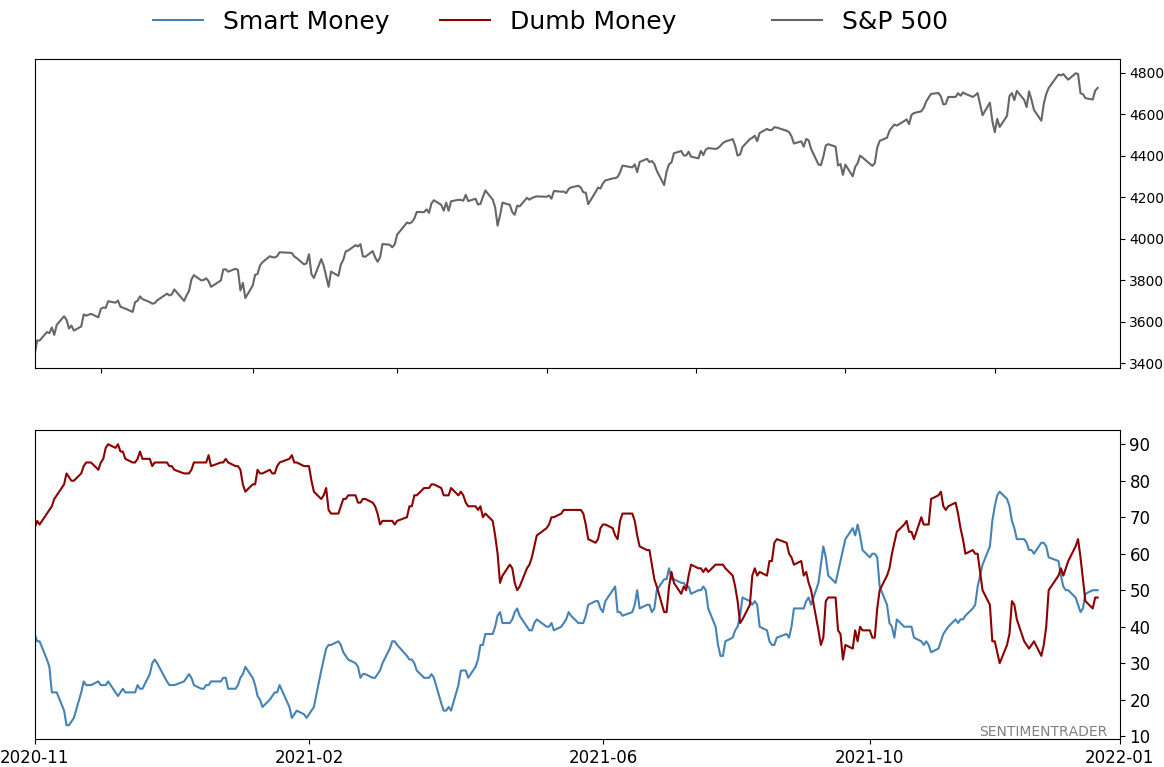
Smart / Dumb Money Confidence
|
Smart Money Confidence: 50%
Dumb Money Confidence: 48%
|
|
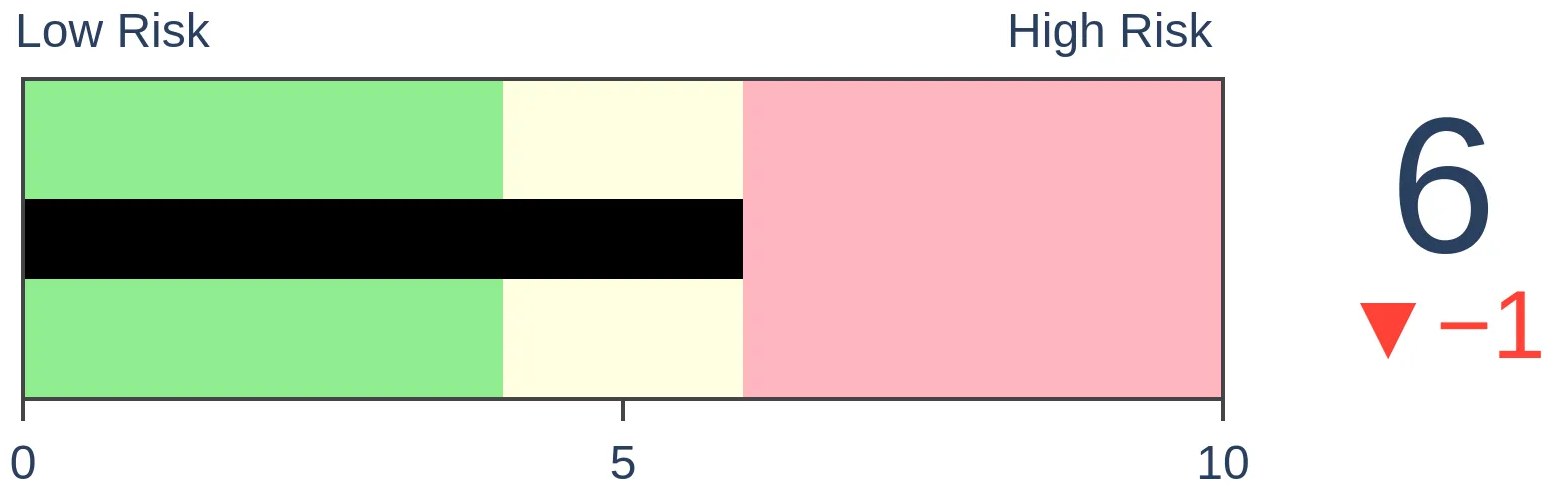
Risk Levels
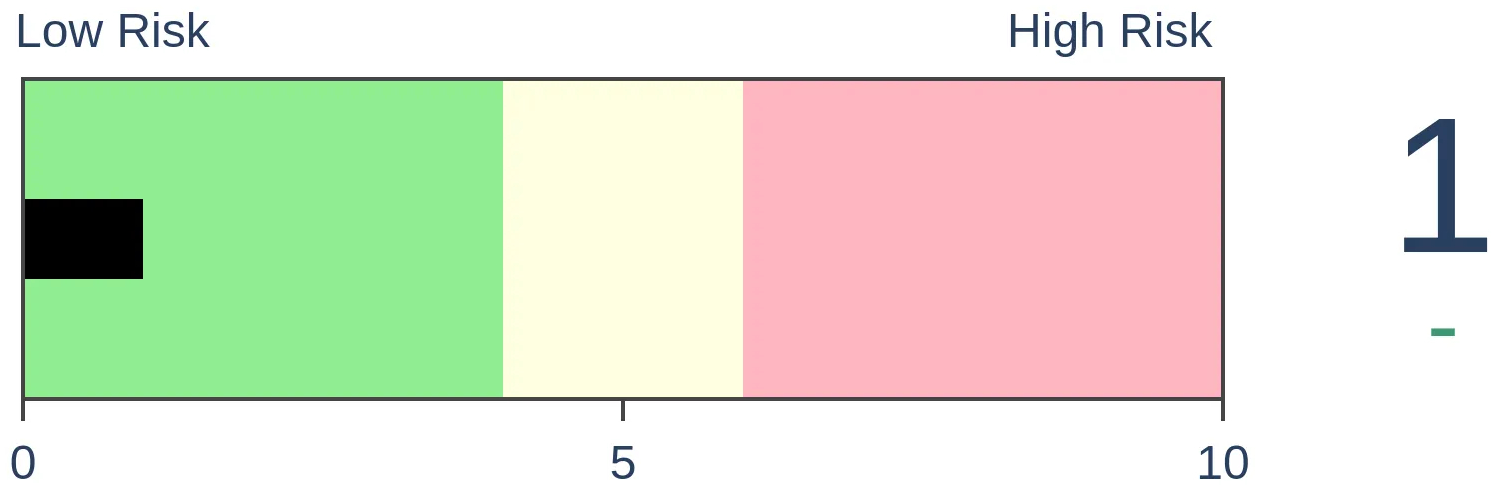
Stocks Short-Term
|
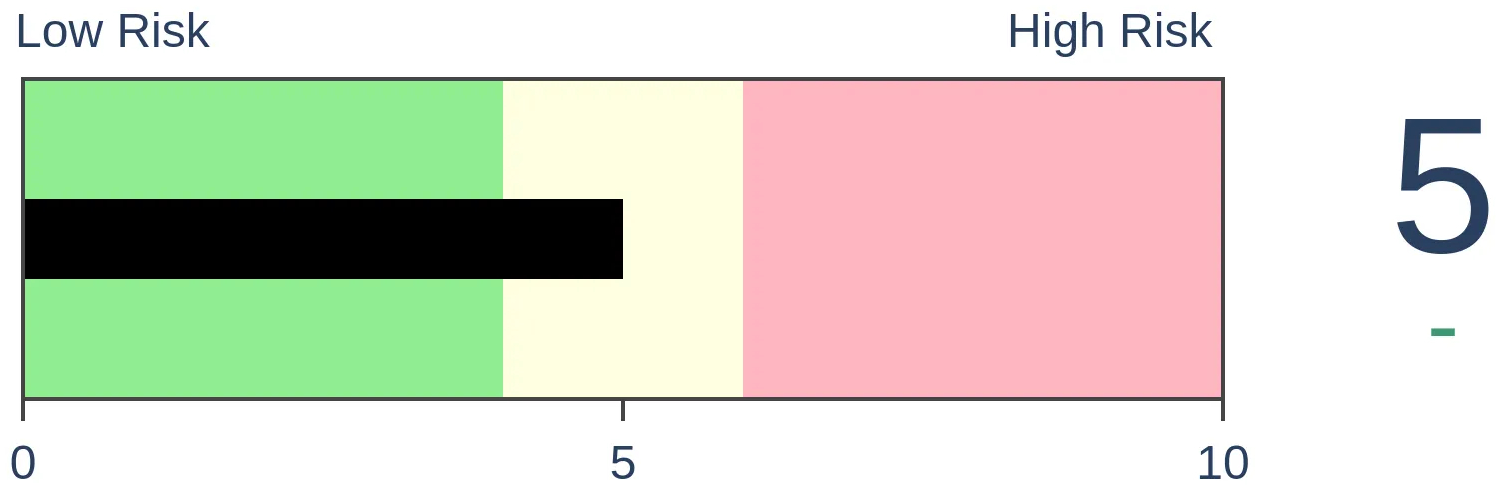
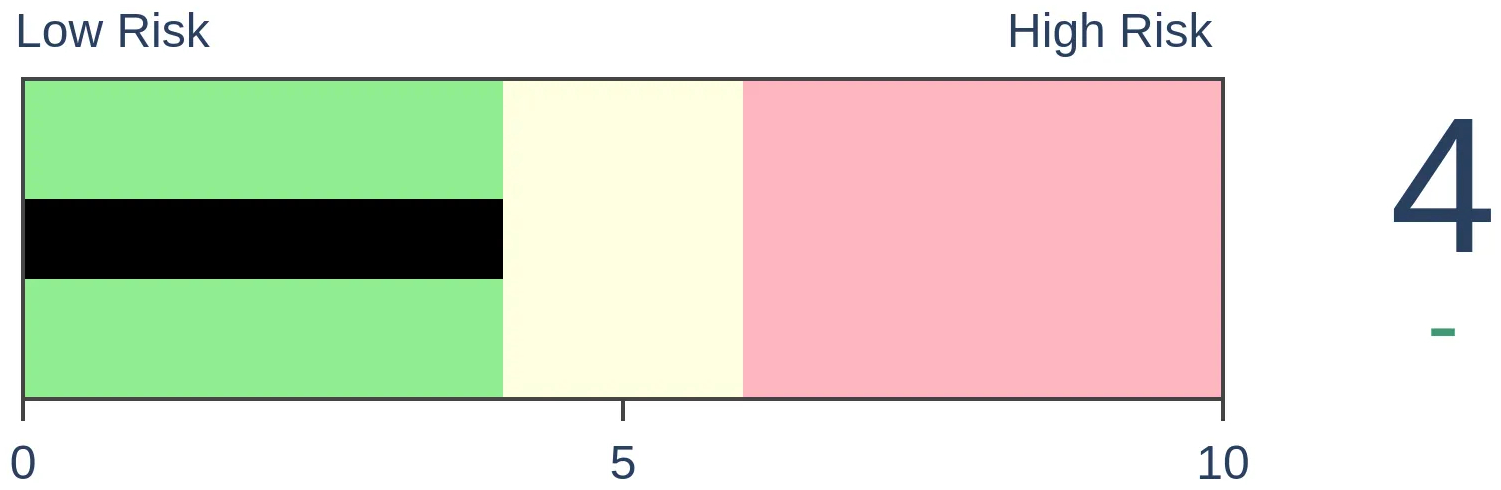
Stocks Medium-Term
|
|
Bonds
|
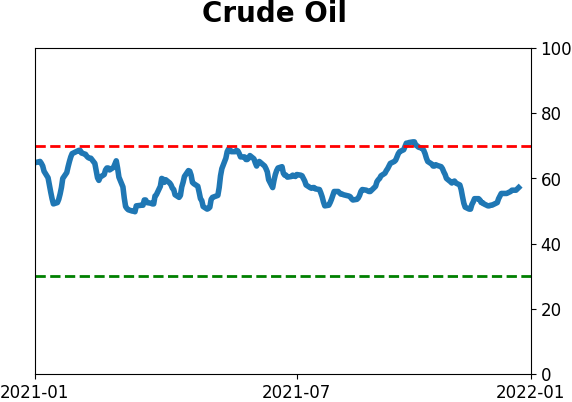
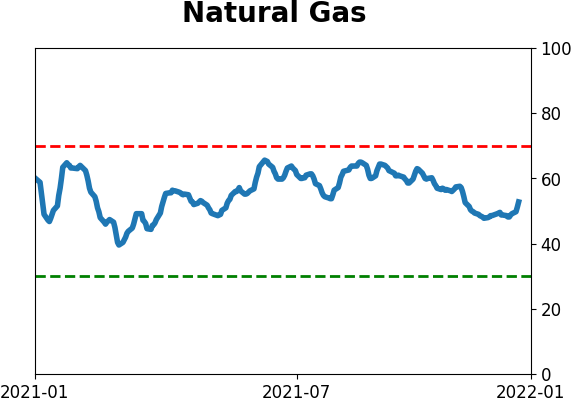
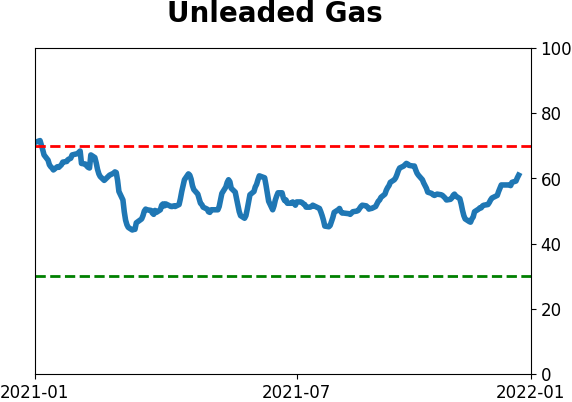
Crude Oil
|
|
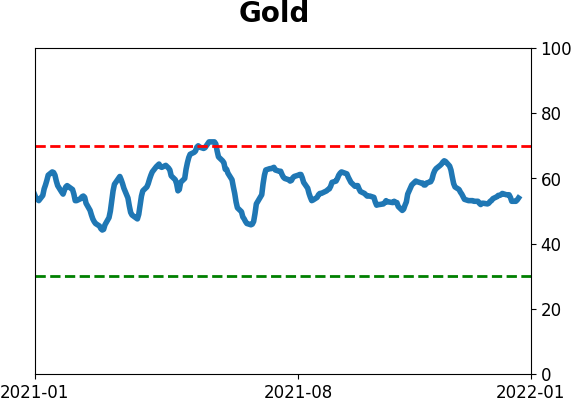
Gold

|
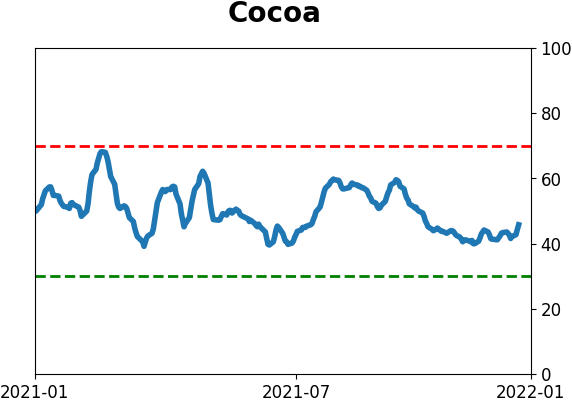
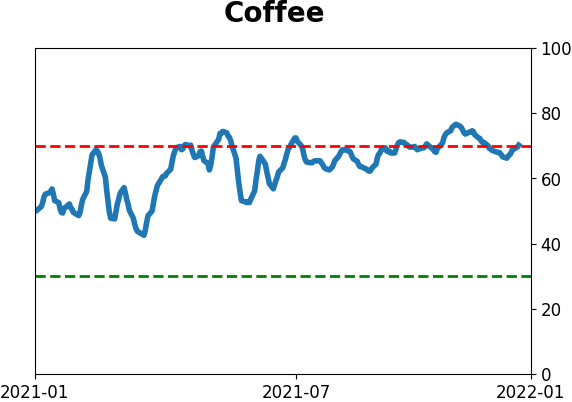
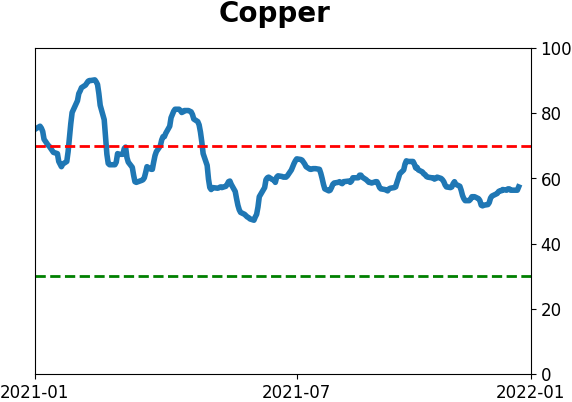
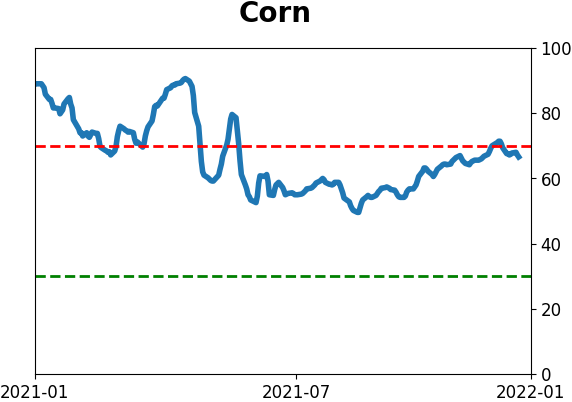
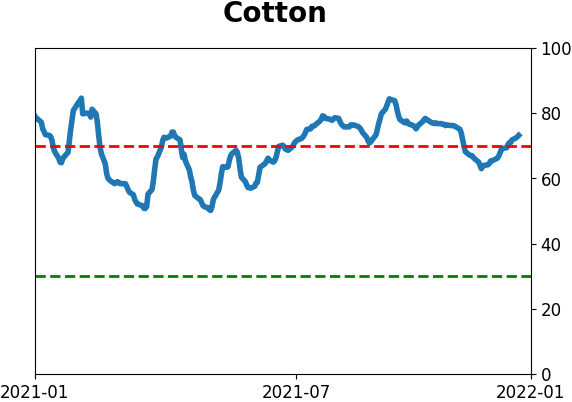
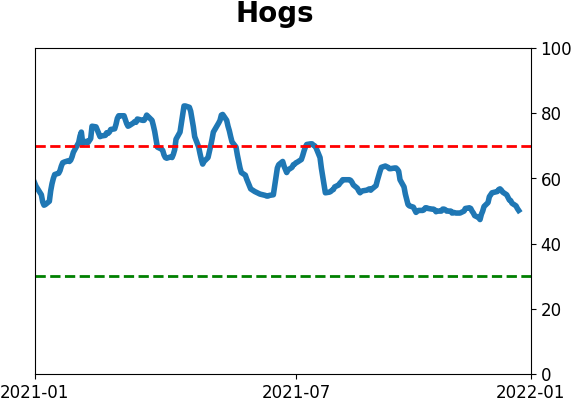
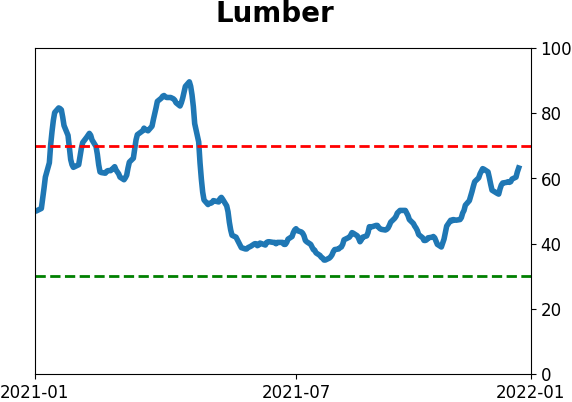
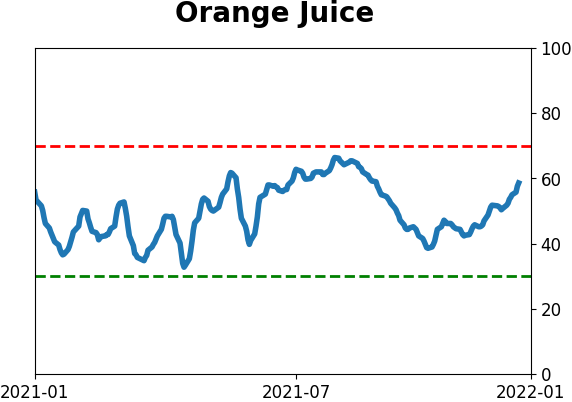
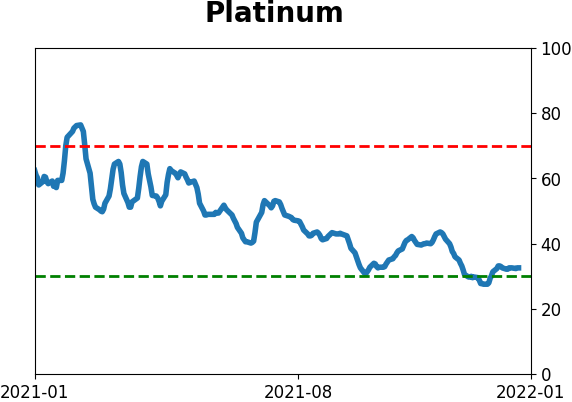
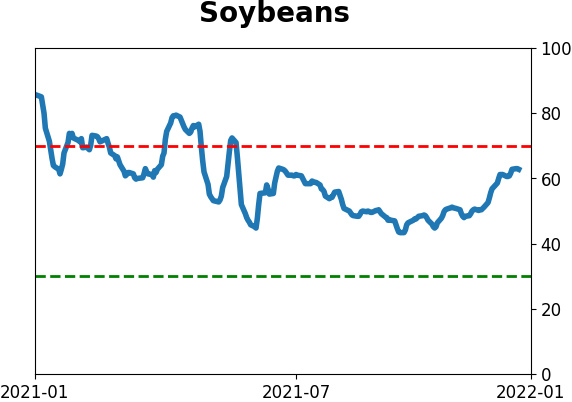
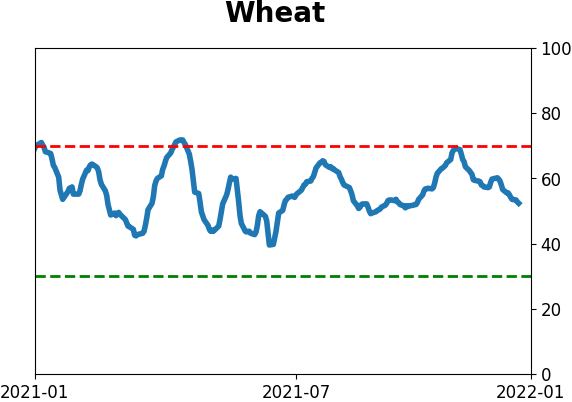
Agriculture

|
|
Research
By Jason Goepfert
BOTTOM LINE
For the first time in almost 4 months, the U.S. dollar closed below its 50-day average. This is coming on the heels of a bout of excessive optimism. Those factors tend to precede more losses for the dollar, though it didn't necessarily translate to consistent gains (or losses) in other markets.
FORECAST / TIMEFRAME
UUP -- Down, Short-Term
|
Key points:
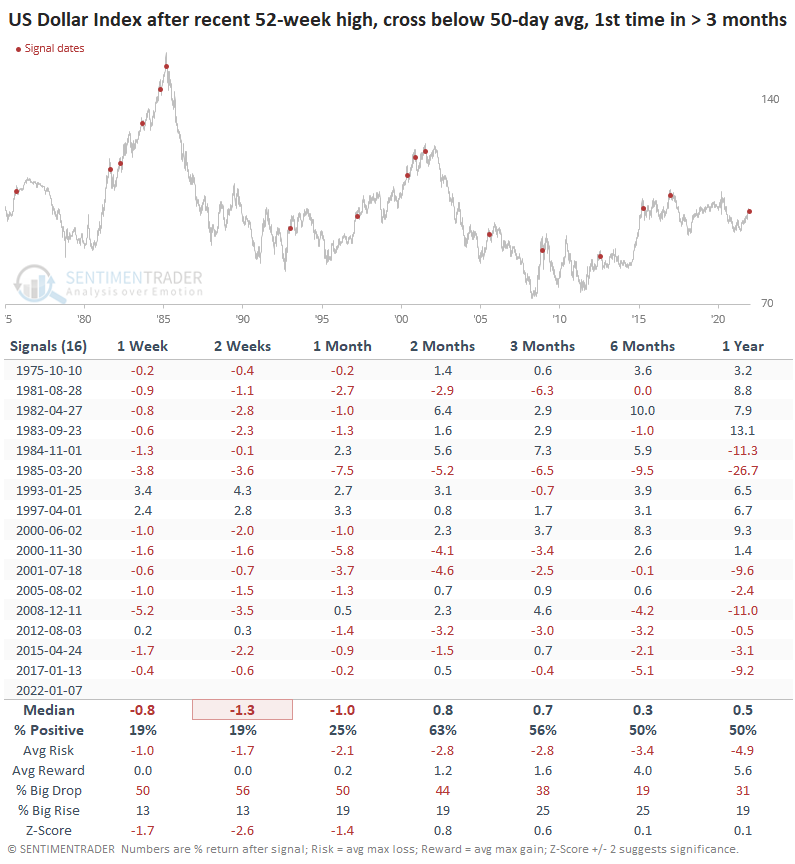
- The U.S. dollar closed below its 50-day average for the 1st time in 80 days
- The ends of similarly long streaks above its average preceded further losses
- Other indicators suggest the dollar may have trouble rising in the weeks and months ahead
The dollar loses its 50-day average for the 1st time in months
The U.S. dollar has been on investors' radars for months as it climbed to its highest level in more than a year. In recent weeks, the uptrend stagnated. The buck crossed below its 50-day average on Friday, followed by a lower low on Tuesday potentially confirming the move lower.
The dollar had gone 80 sessions above its 50-day average. The drop on Friday ended one of its longest-ever streaks above its medium-term moving average.
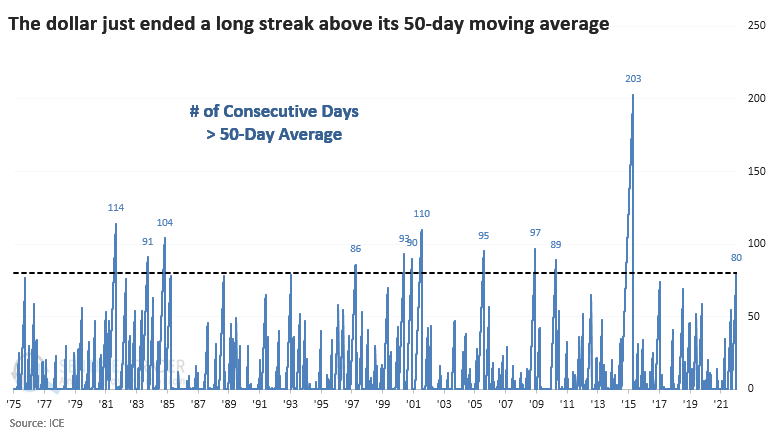
When the dollar fell below its 50-day average for the first time in months and had set a 52-week high at some point in the prior 2 months, it has usually kept falling. Its shorter-term returns were fragile, with only 19% of the signals preceding a bounce over the next 1-2 weeks.
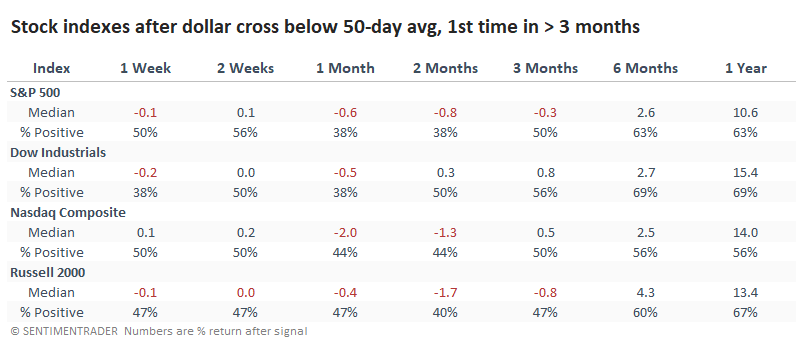
Other assets didn't really benefit, either
Conventional wisdom suggests that stocks do better with a rising dollar. There is evidence of that in the table below, which shows equity index performance after the signals in the table above. Over the next 1-2 months, stock indexes were weak, especially the S&P 500.
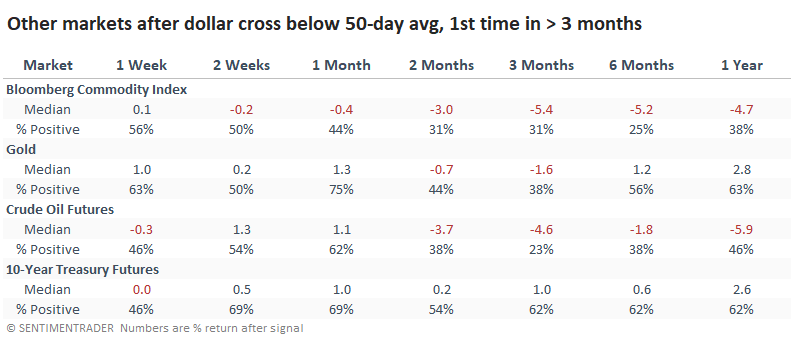
We might expect a falling dollar to be a net positive among other markets. Gold did tend to see a quick bounce, but it showed weak returns after that. So did crude oil and commodities in general. Treasury notes tended to rise (in price, meaning a lower yield), but it wasn't a decisive edge.
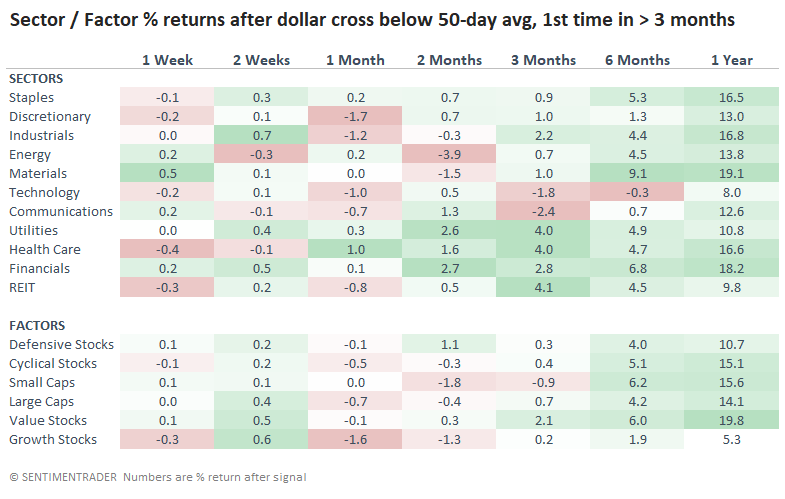
Sector and factor performance was kind of a mess. There wasn't much green over the next month, except for Health Care. Growth and Discretionary stocks saw the largest average losses.
Other measures show challenges for the dollar
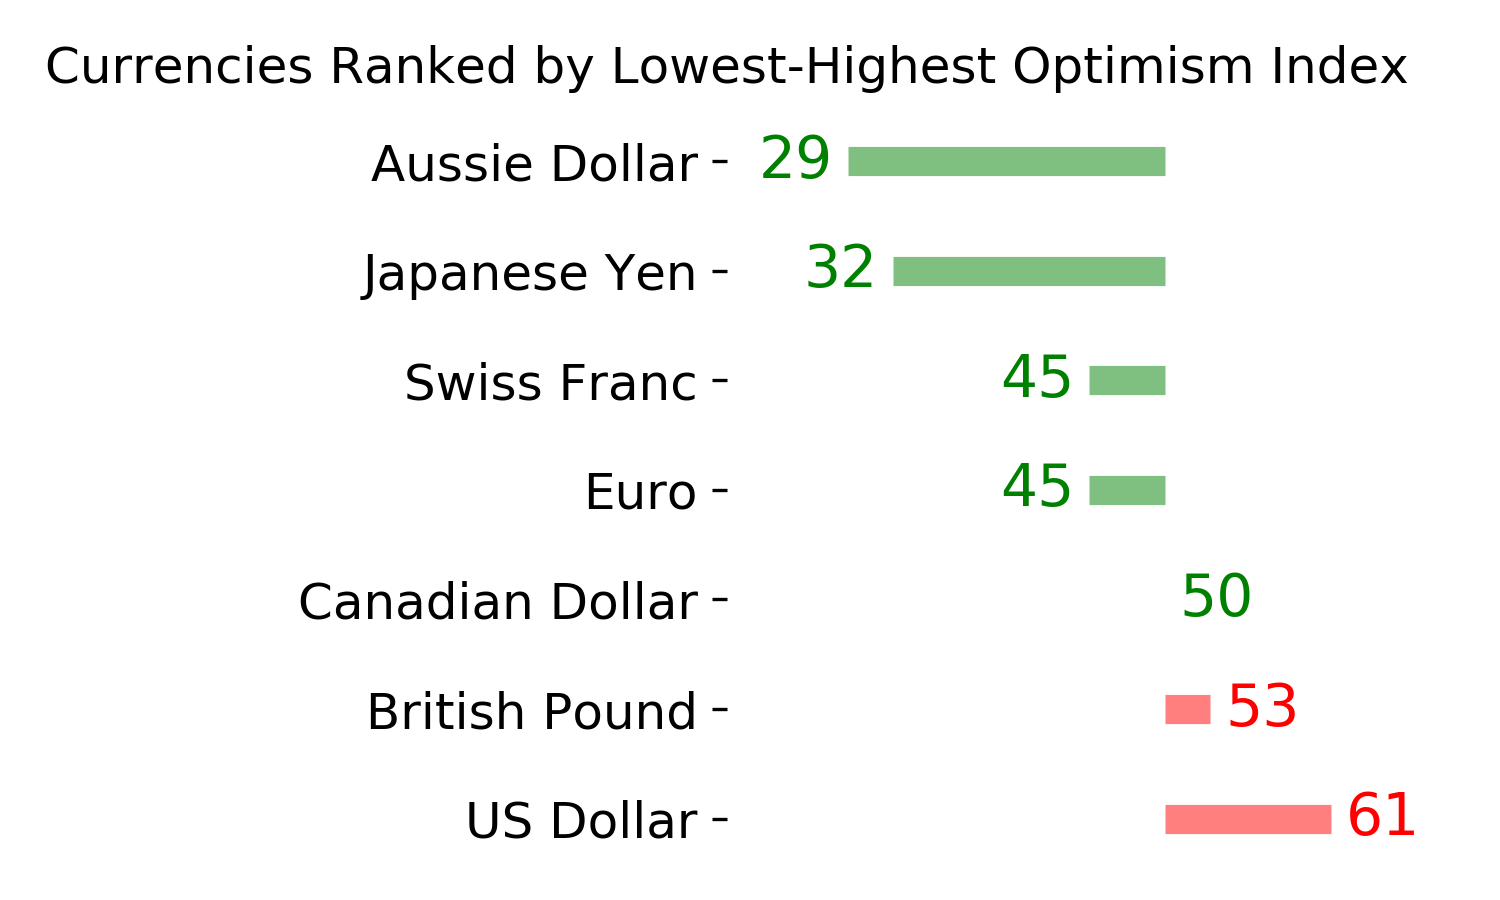
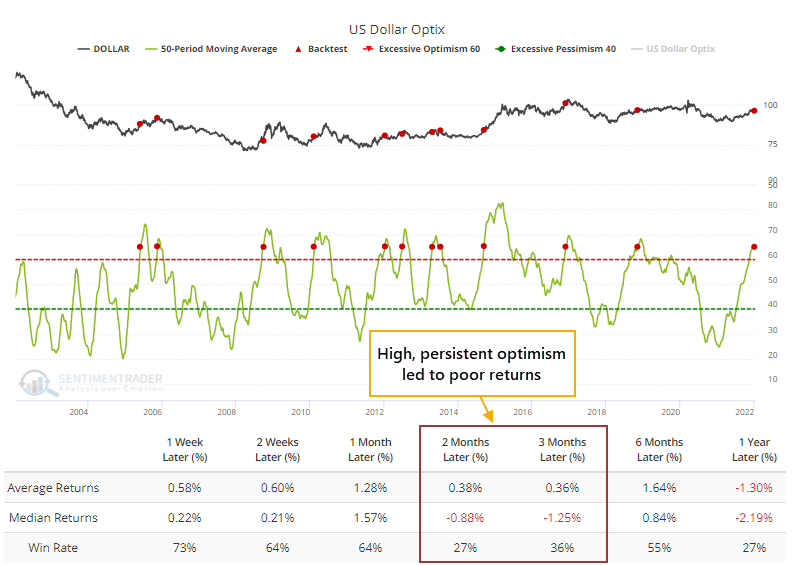
The persistent rise in the dollar encouraged traders and spurred a high degree of confidence that the rally could continue.
The 50-day average of the Optimism Index for the dollar just crossed above 65%. While currencies tend to trend, rendering sentiment extremes less consistent as contrary indicators, the Backtest Engine shows how much the dollar struggled with high optimism.
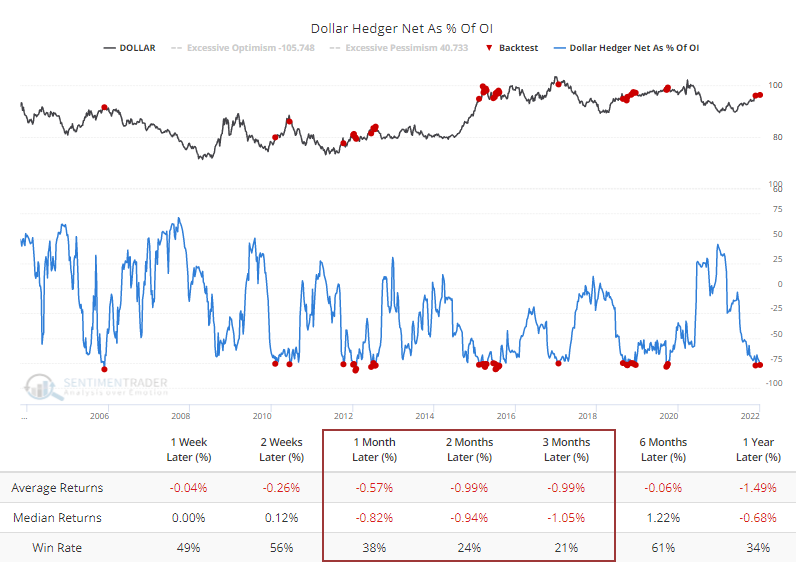
Part of the reason for the high optimism is that speculators are aggressively long the dollar. Commercial hedgers take the opposite sides of those trades, so they are heavily short. The Backtest Engine shows that when hedgers held more than 75% of open interest net short, the dollar had trouble keeping upside momentum. Over the next 3 months, it rose only 21% of the time.
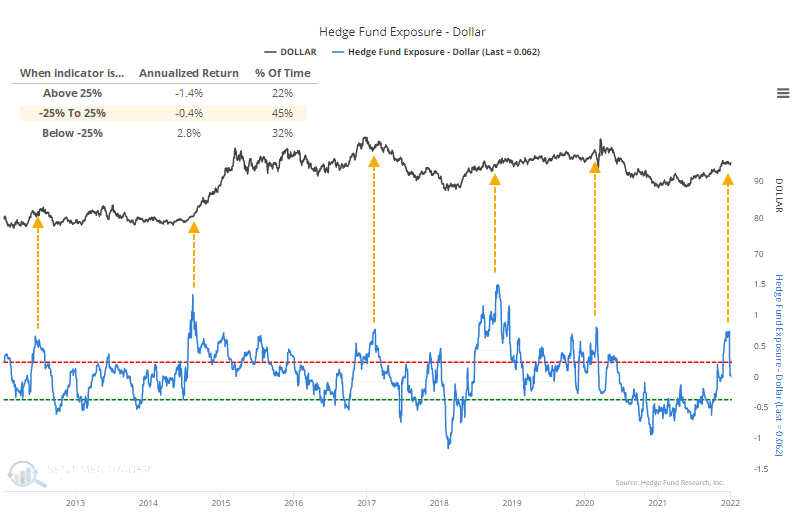
It's a rough approximation, but suggestions are that hedge funds are just now paring back heavy exposure to the dollar. Heavy exposure was not a perfect contrary indicator, but generally, the dollar did better when exposure was lower.
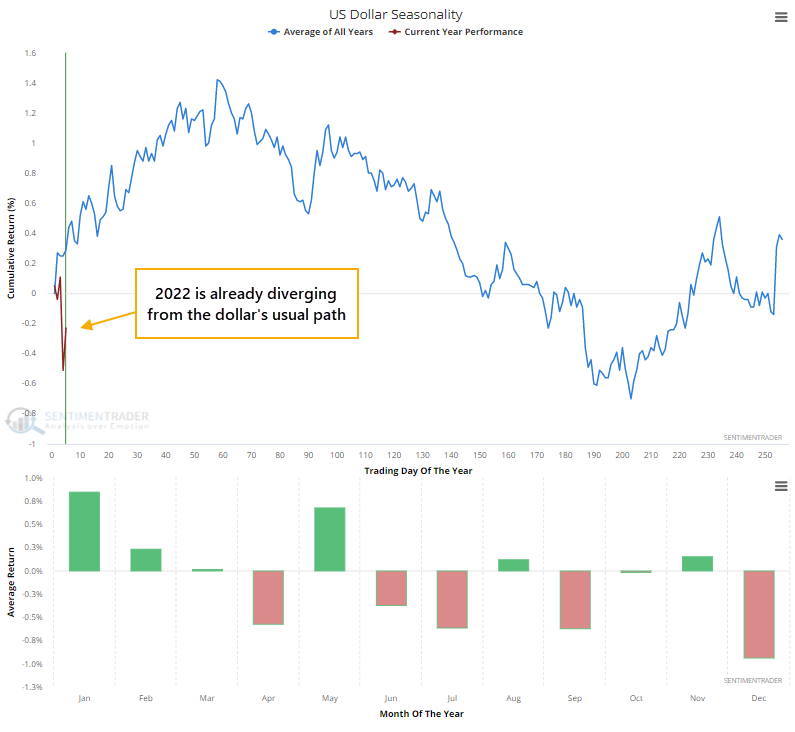
At least there's the calendar. The dollar has had a positive drift in the first couple of months of a new year, but it's already bucking its seasonal window.
What the research tells us...
The U.S. dollar has been stagnant for a month, and it recently dropped below its 50-day moving average for the first time in months. Its historical reaction to this kind of behavior has been further declines, especially in the short-term. A potential trend change in the dollar hasn't been beneficial to stocks or most other major asset classes. Other indicators suggest that optimism declining from a high level is a problem for the dollar, suggesting more selling pressure ahead.
Active Studies
| Time Frame | Bullish | Bearish | | Short-Term | 2 | 0 | | Medium-Term | 13 | 2 | | Long-Term | 13 | 4 |
|
Indicators at Extremes
Portfolio
| Position | Description | Weight % | Added / Reduced | Date | | Stocks | RSP | 35.9 | Added 25.2% | 2022-01-03 | | Bonds | 32.7% BND, 7.1% SCHP | 39.8 | Added 8.3% | 2021-10-26 | | Commodities | GCC | 2.4 | Reduced 2.1%
| 2020-09-04 | | Precious Metals | GDX | 4.6 | Reduced 4.2% | 2021-05-19 | | Special Situations | 9.8% KWEB, 4.7% XLE, 2.9% PSCE | 17.3 | Added 9.78% | 2021-10-01 | | Cash | | 0.1 | | |
|
Updates (Changes made today are underlined)
Coinciding with the new year, there was a thrust in participation in the S&P 500 near the end of December. Thrusts have been among the most consistent signals over the decades, and this is hard to ignore. I have greater confidence in thrusts when coming off extreme pessimism, like the spring of 2020, as opposed to near all-time highs on low volume. Still, it's hard to justify not being at least neutral weight stocks given this behavior. Bond sentiment is trying to recover from a recent bout of pessimism, and gold stocks are doing their thing which is not much at all. They've been flat for six months. Chinese tech stocks were doing exactly what they're supposed to do, then did *not* by plunging to new lows. This is troubling on a shorter-term time frame, but this was never meant for a trade, rather a multi-year investment. Recent behavior is troubling and I will not be adding any exposure as long as that's the case. RETURN YTD: +1.2% 2021: +8.7%, 2020: +8.1%, 2019: +12.6%, 2018: +0.6%, 2017: +3.8%, 2016: +17.1%, 2015: +9.2%, 2014: +14.5%, 2013: +2.2%, 2012: +10.8%, 2011: +16.5%, 2010: +15.3%, 2009: +23.9%, 2008: +16.2%, 2007: +7.8%
|
|
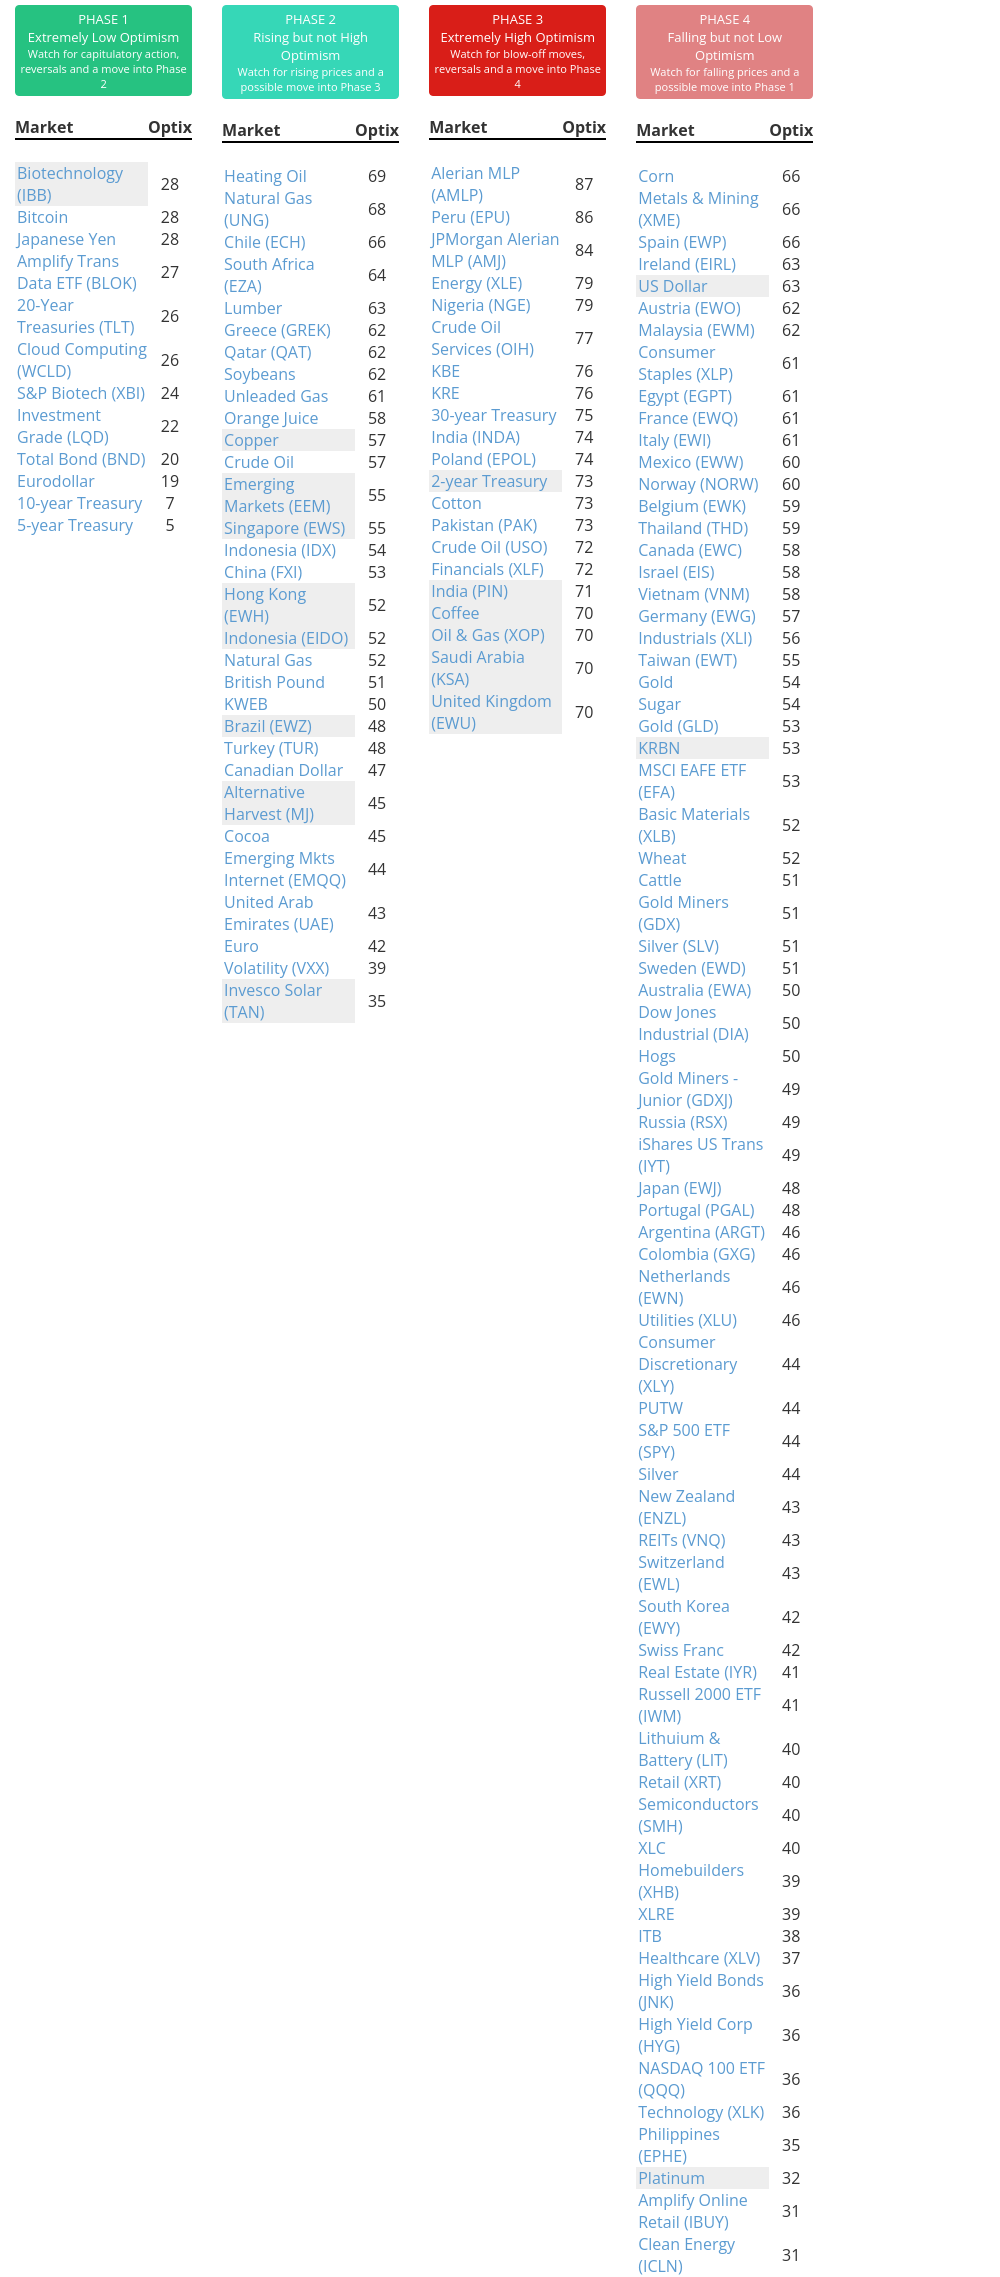
Phase Table
Ranks
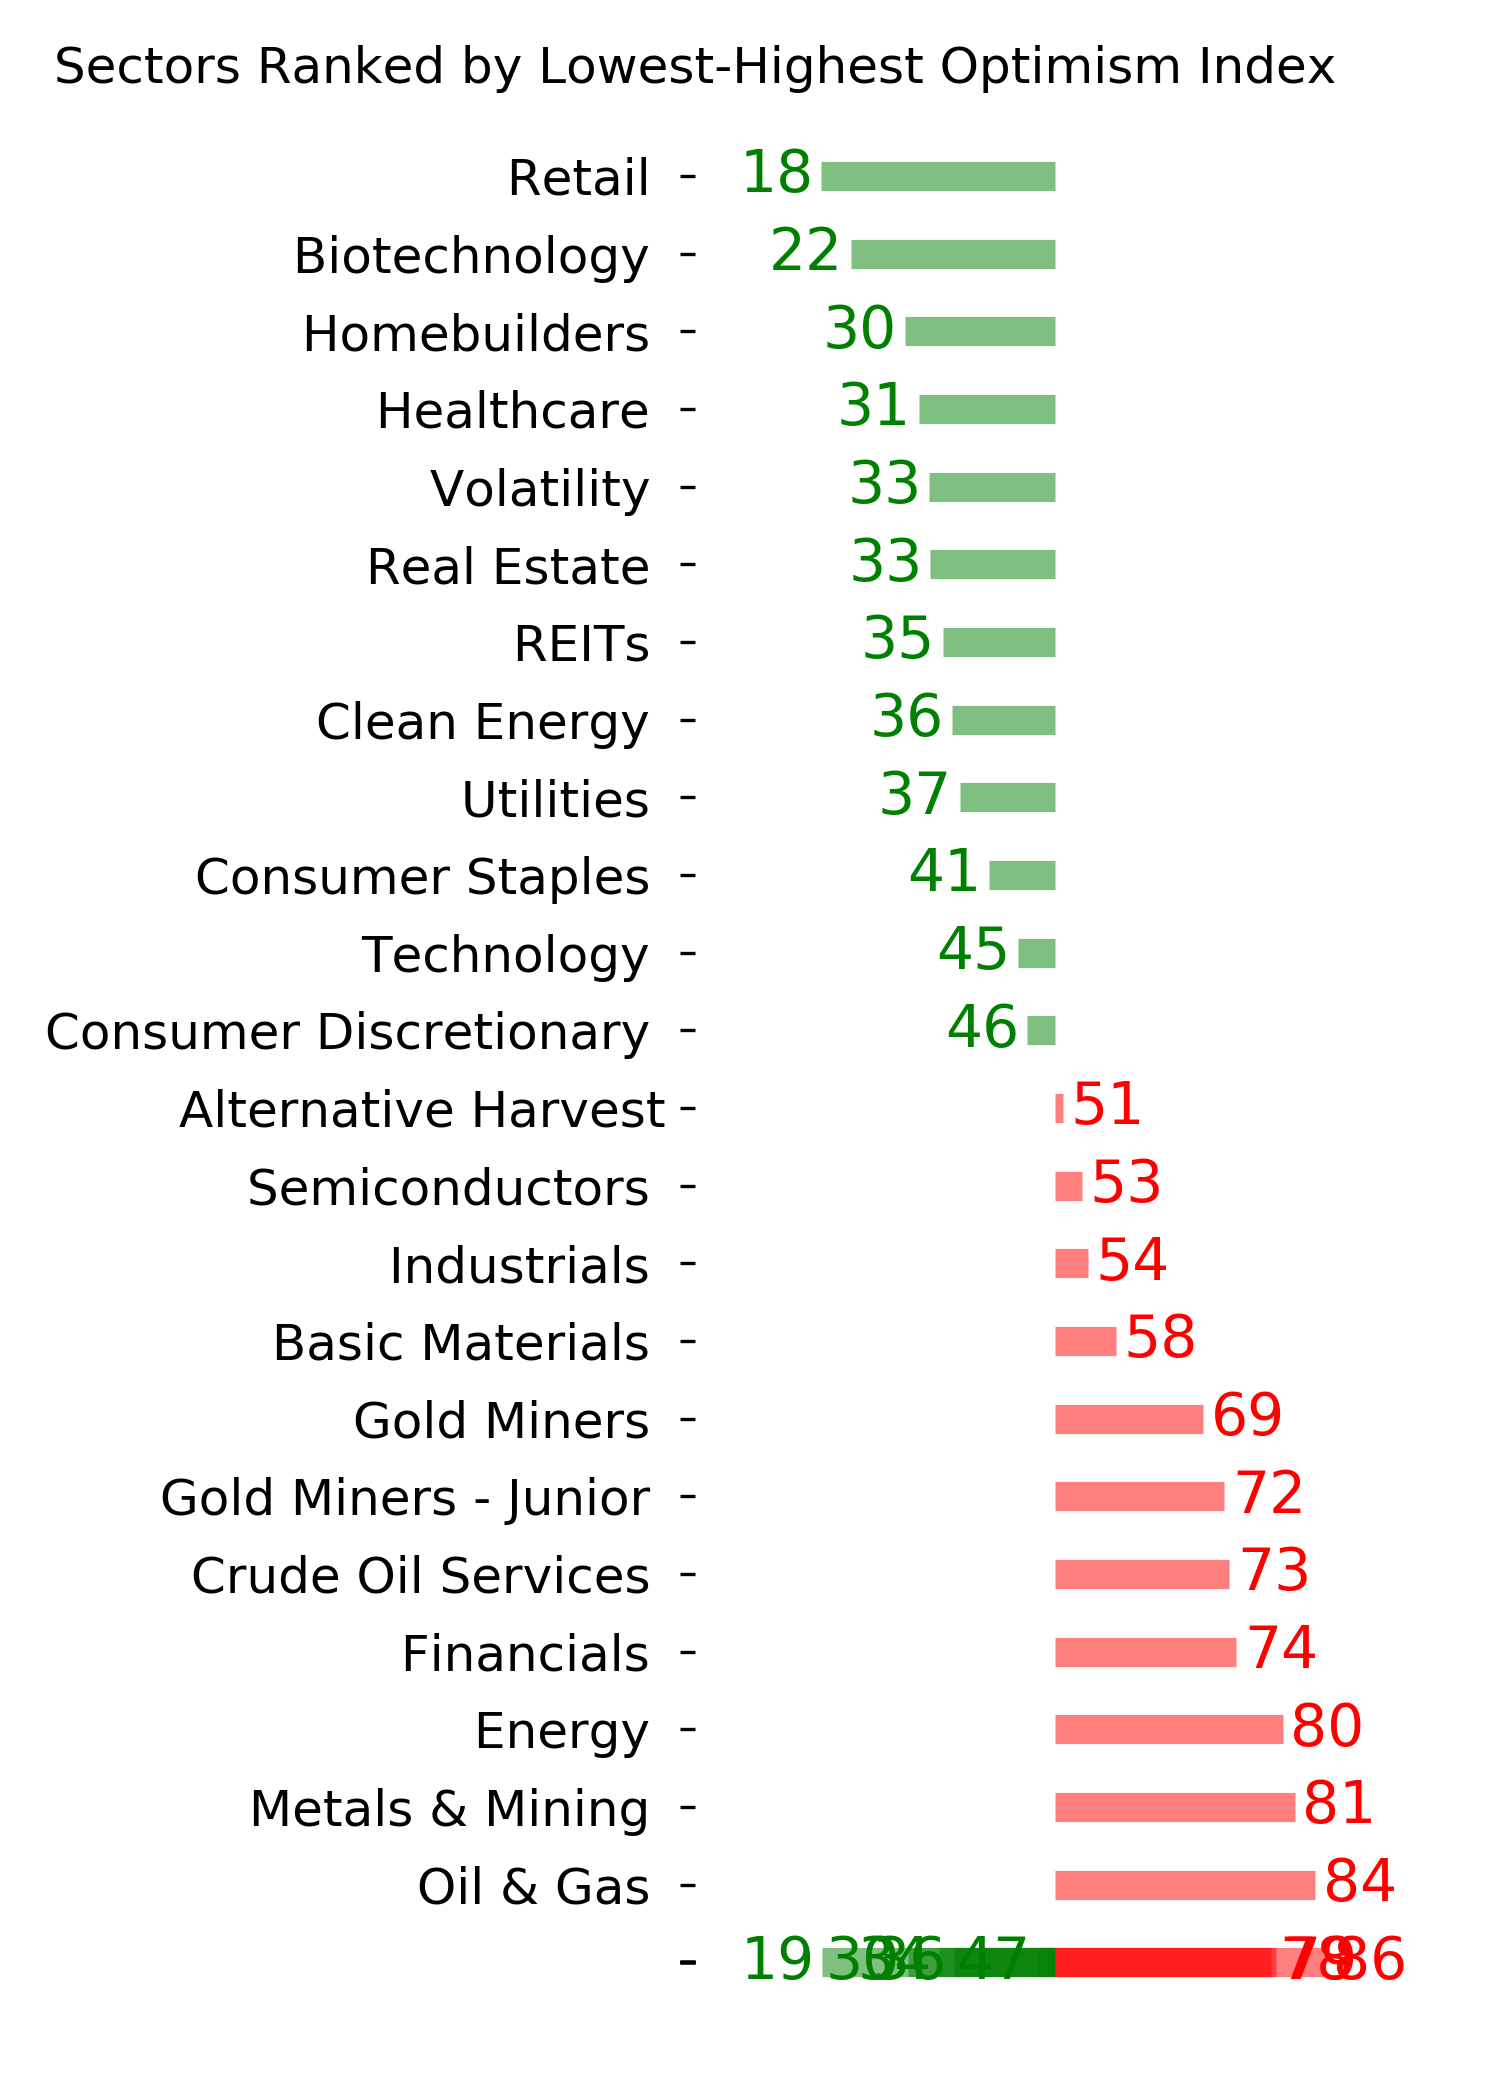
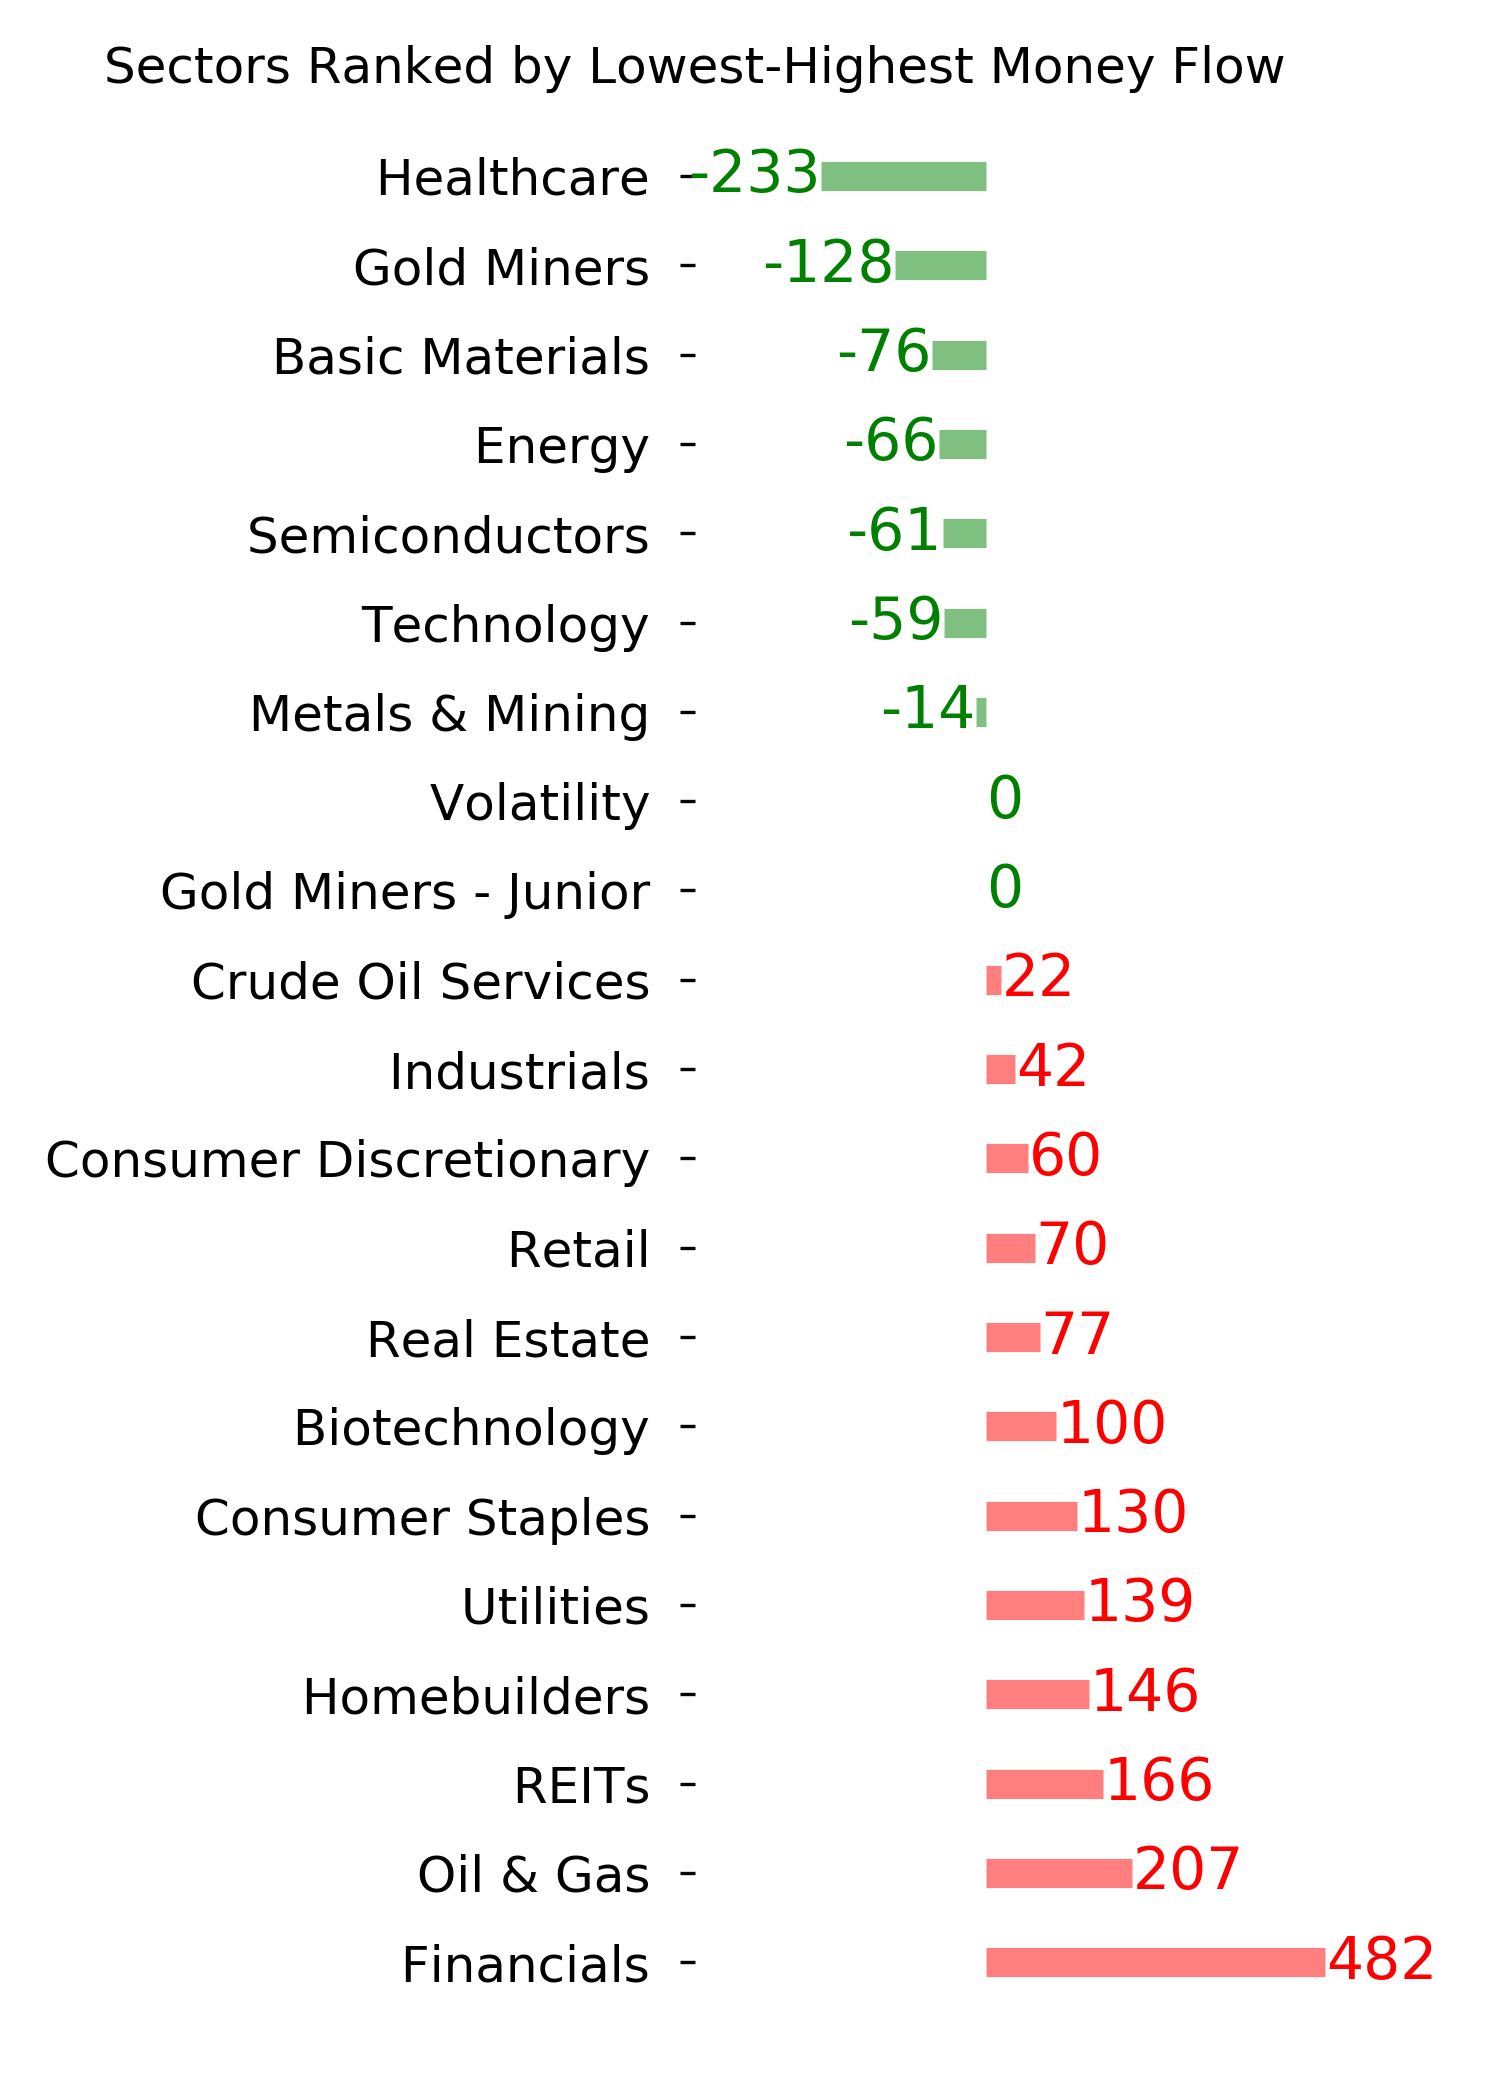
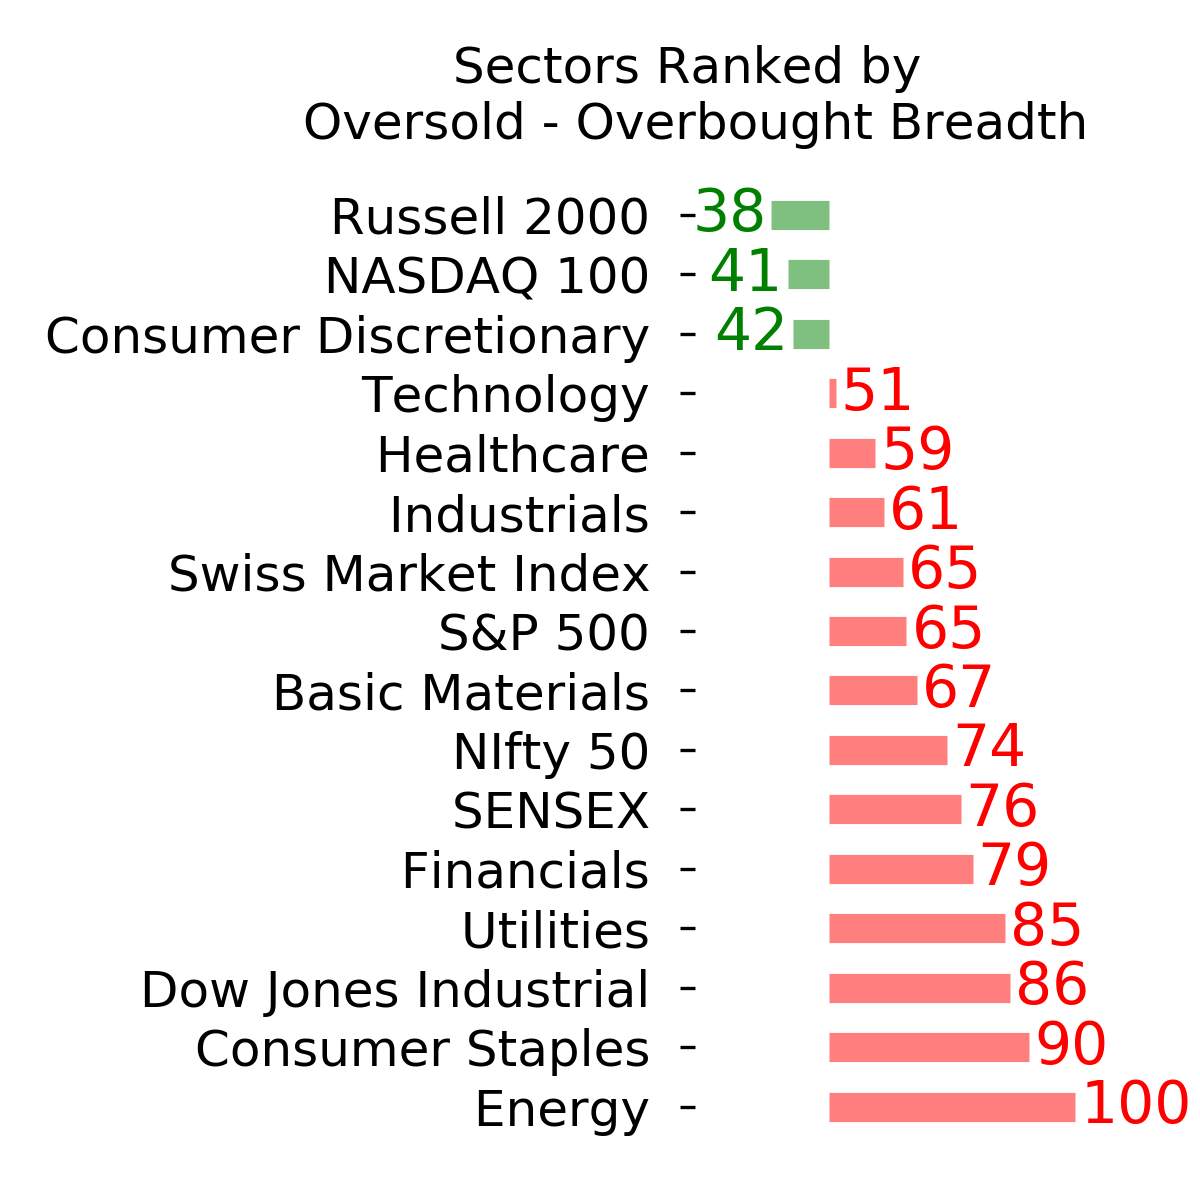
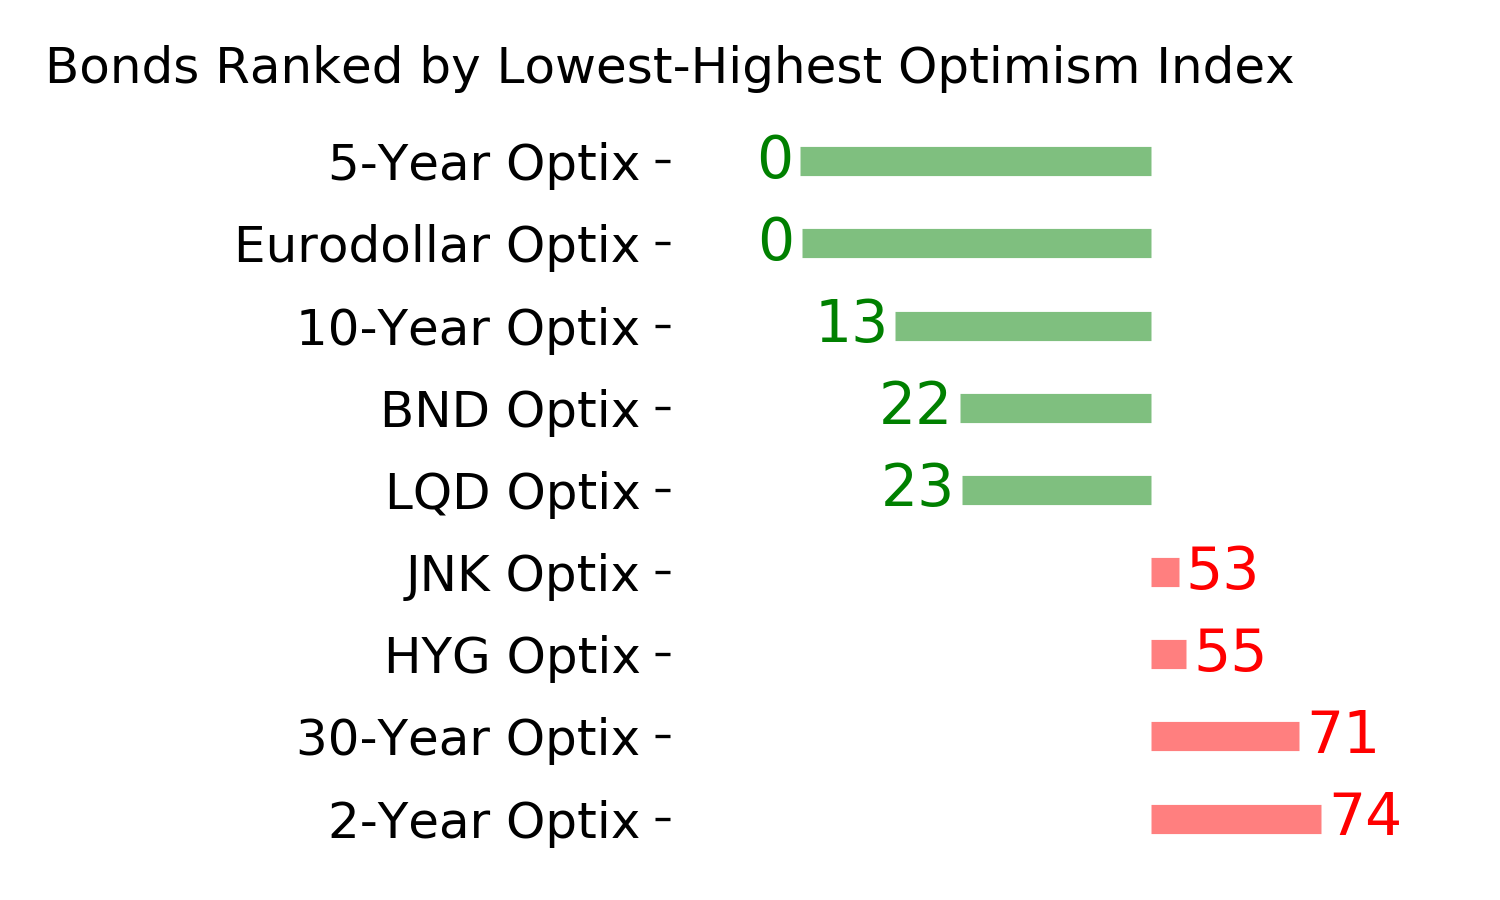
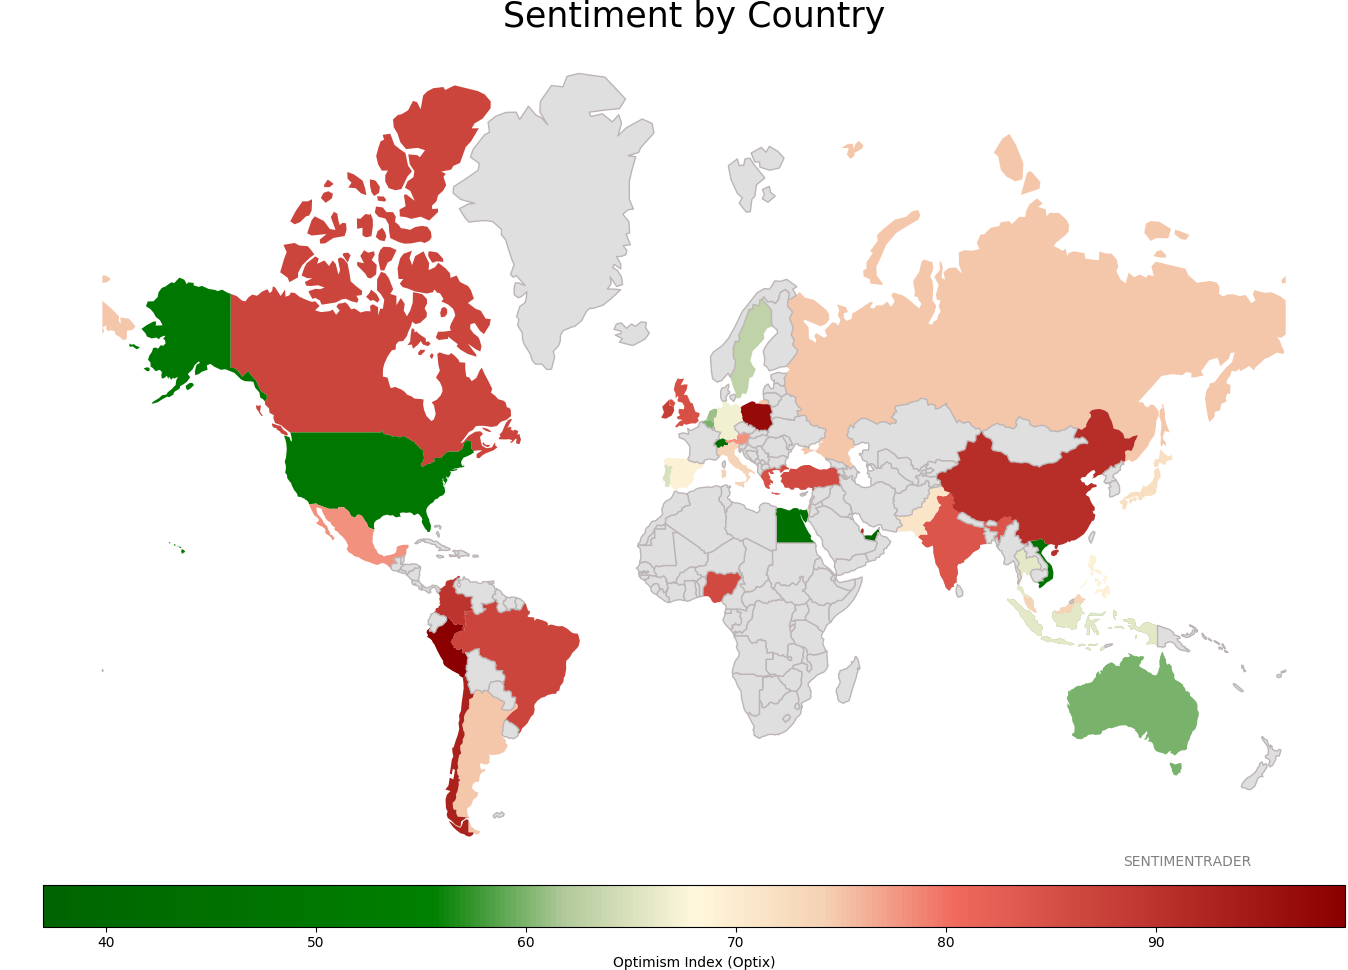
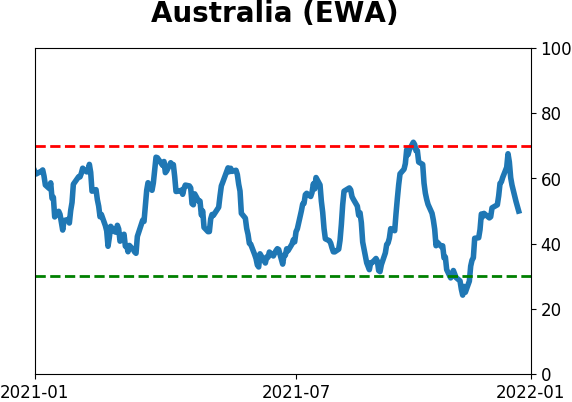
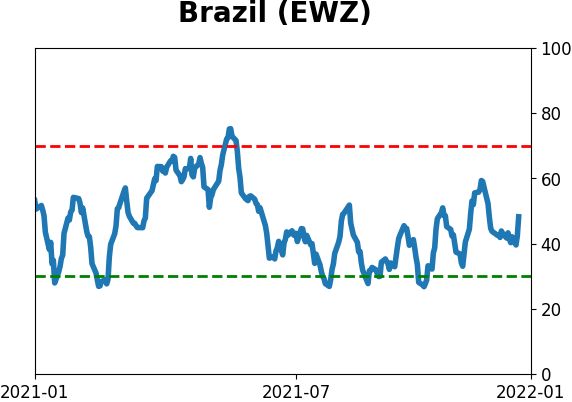
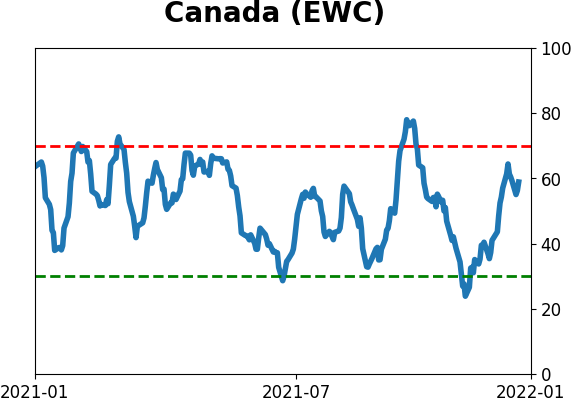
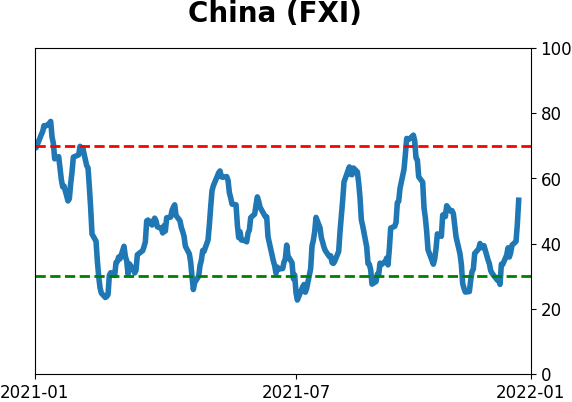
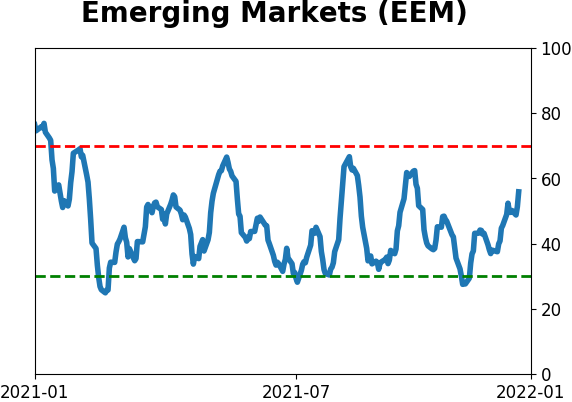
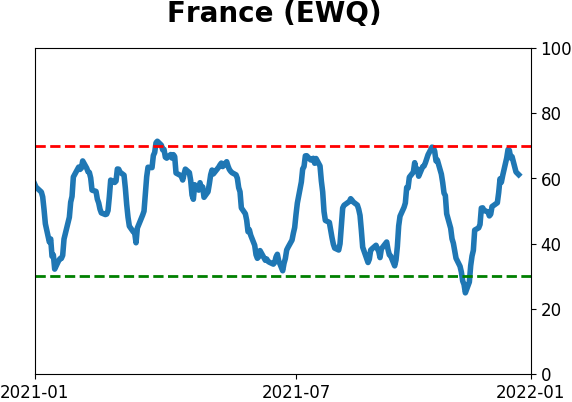
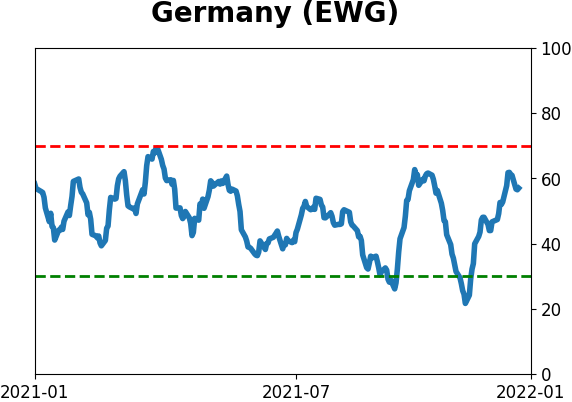
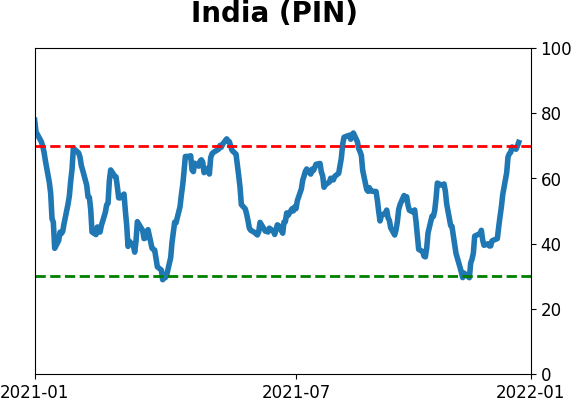
Sentiment Around The World
Optimism Index Thumbnails
|
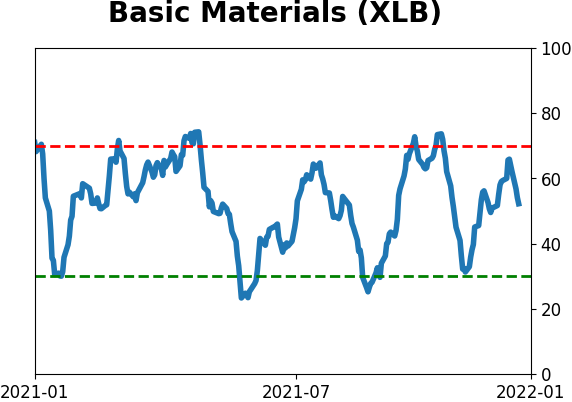
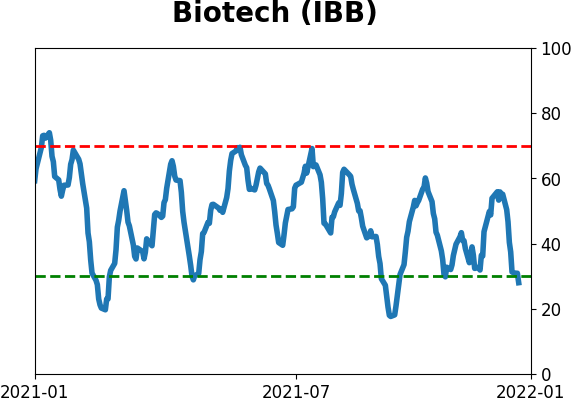
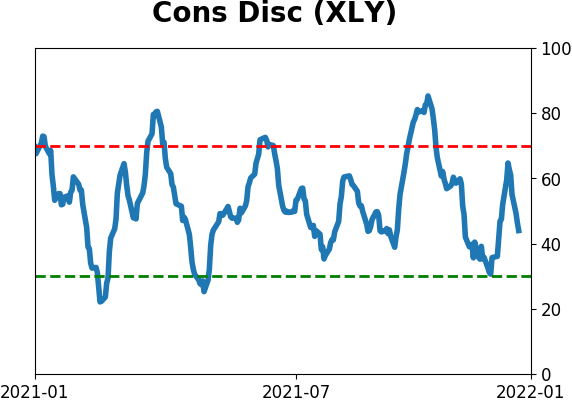
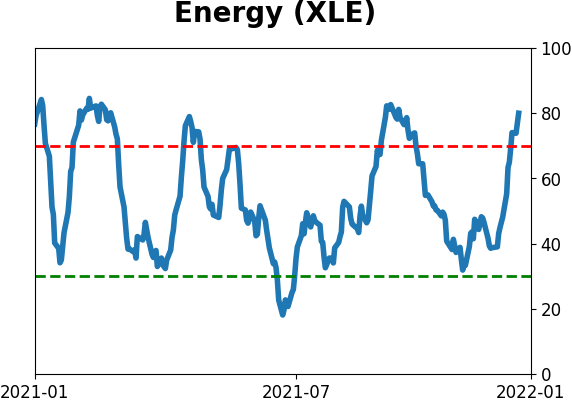
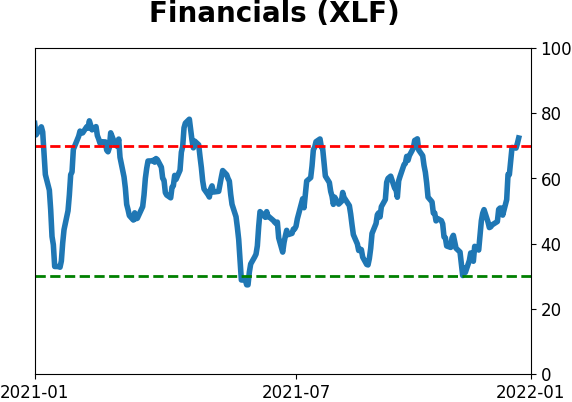
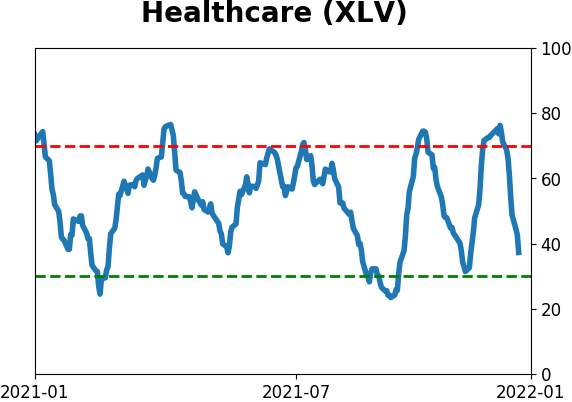
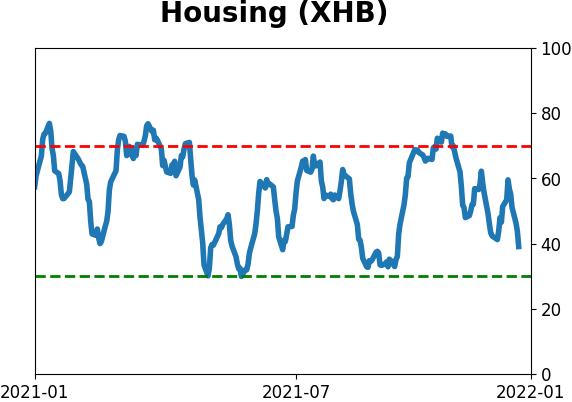
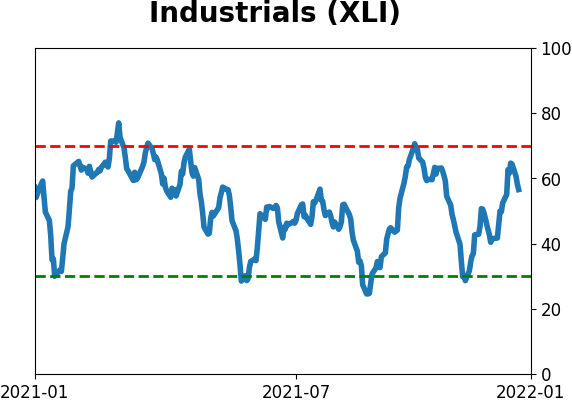
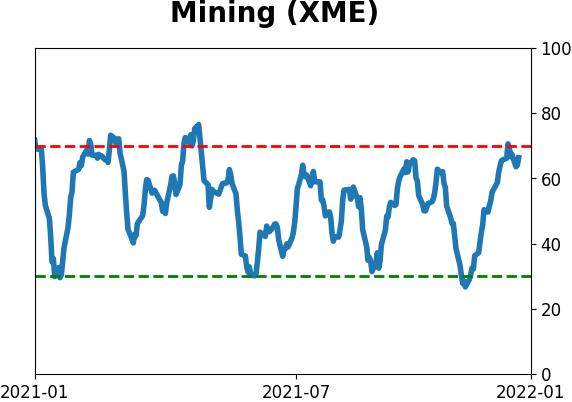
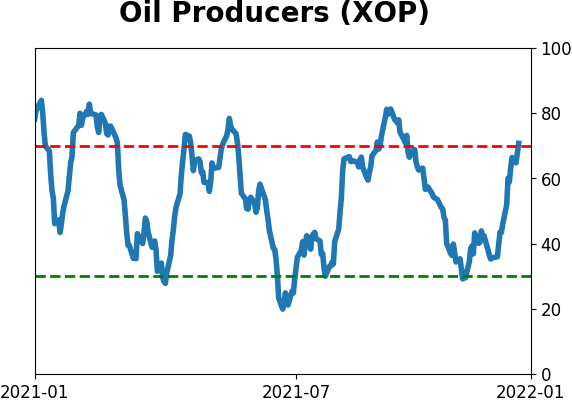
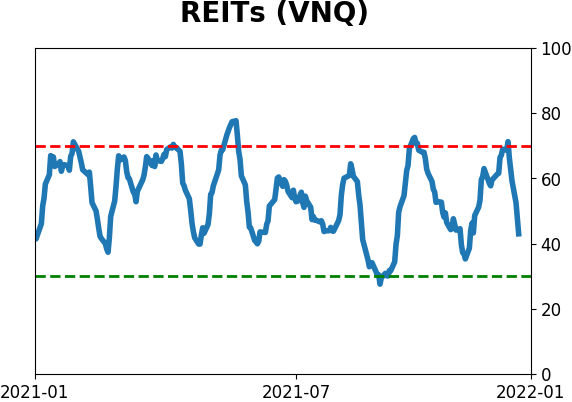
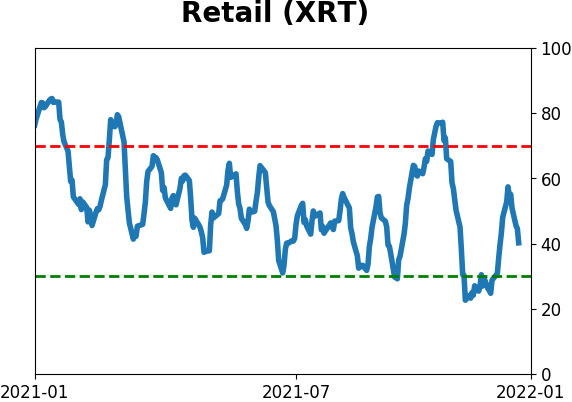
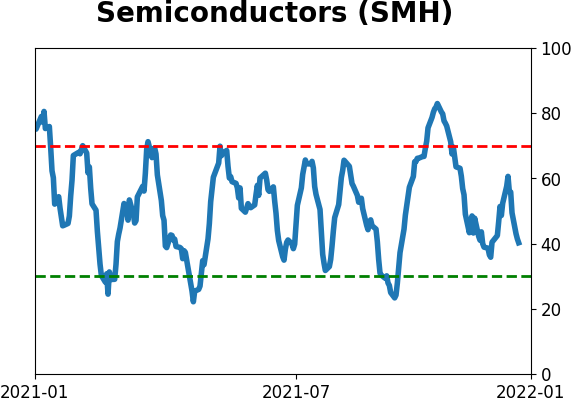
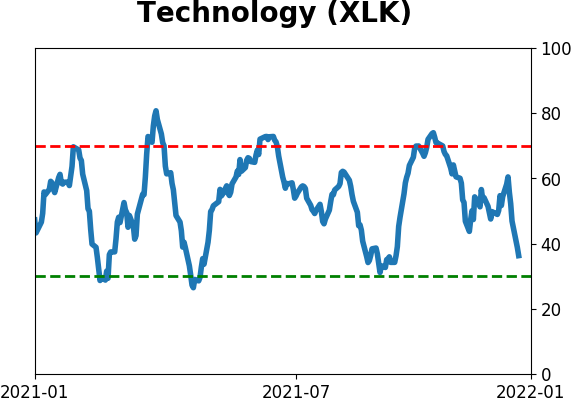
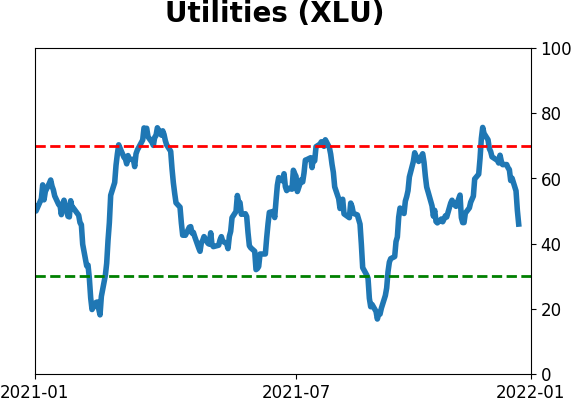
Sector ETF's - 10-Day Moving Average
|
|
|
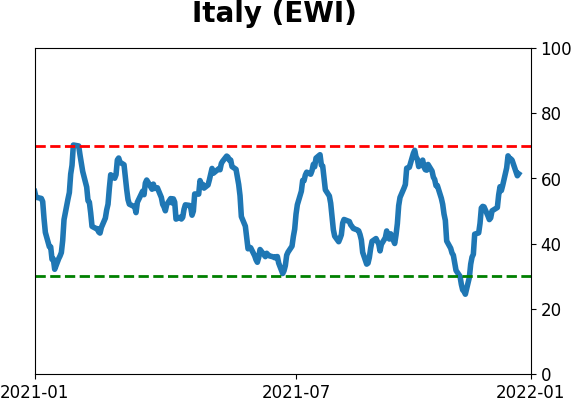
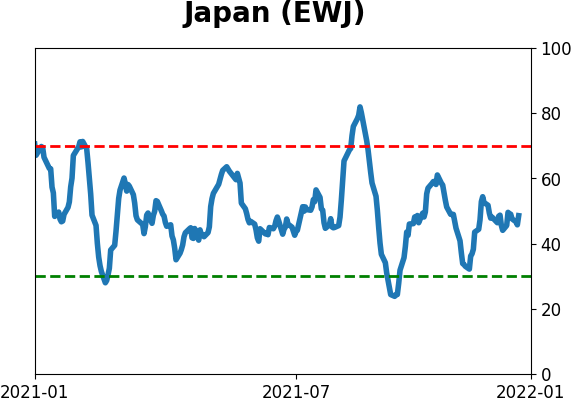
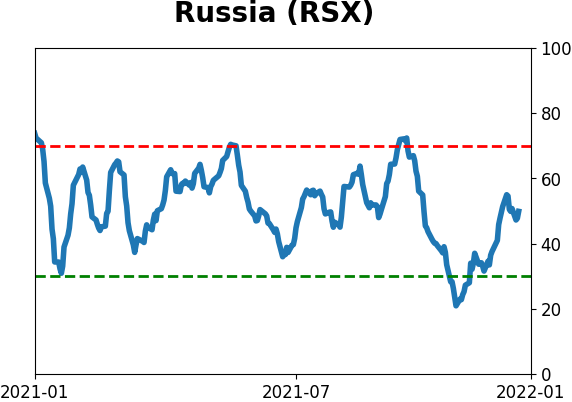
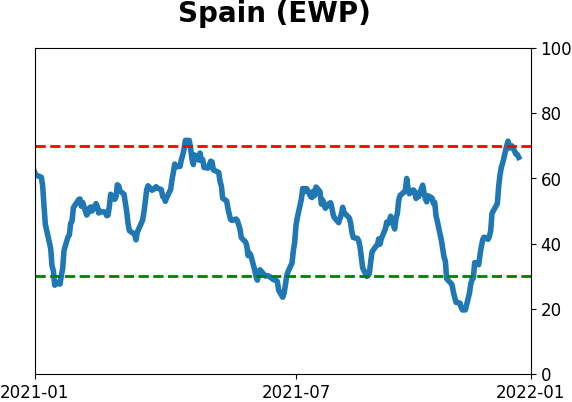
Country ETF's - 10-Day Moving Average
|
|
|
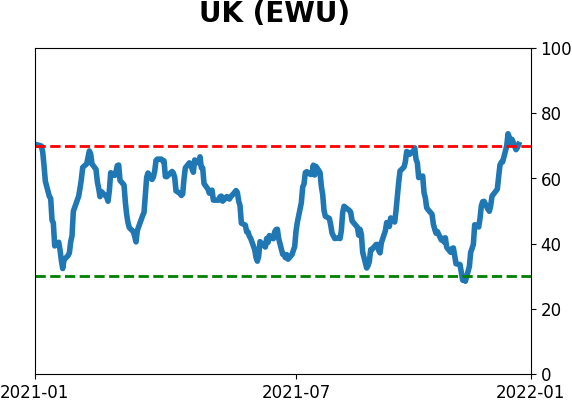
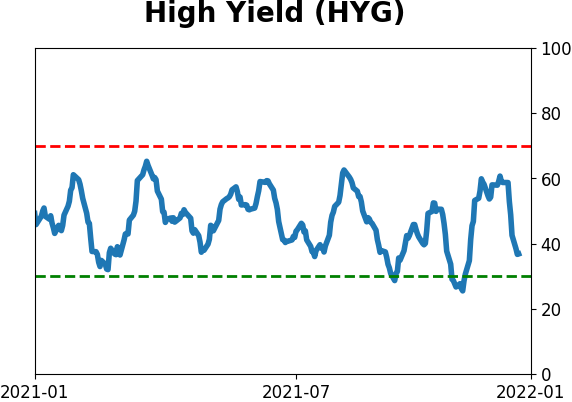
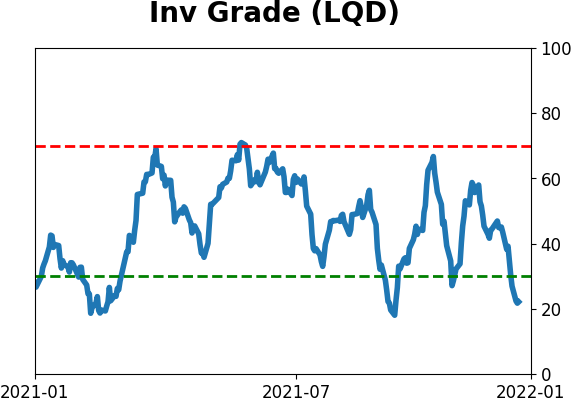
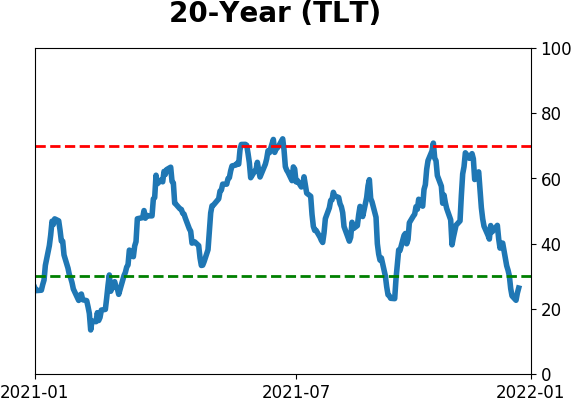
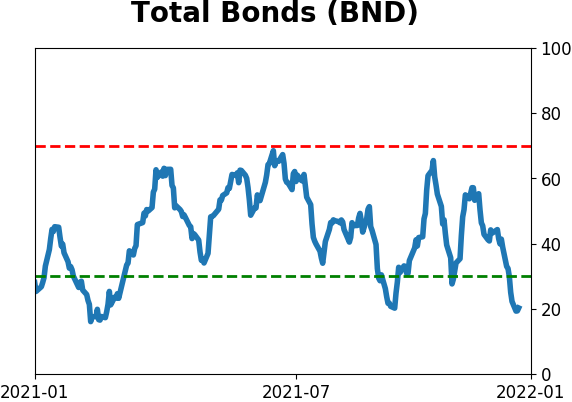
Bond ETF's - 10-Day Moving Average
|
|
|
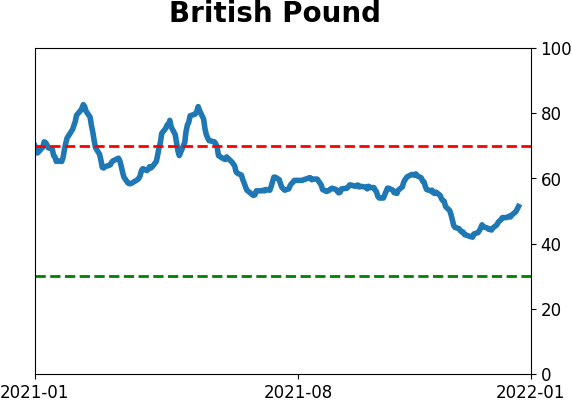
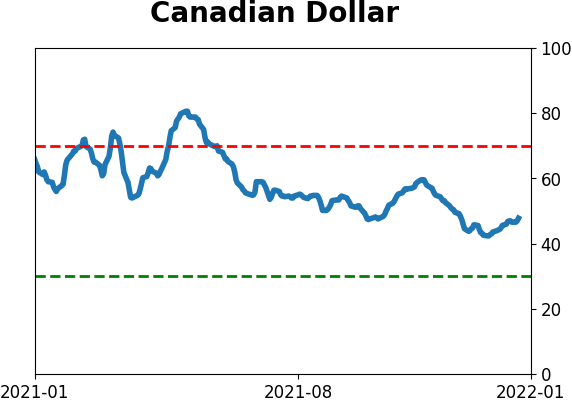
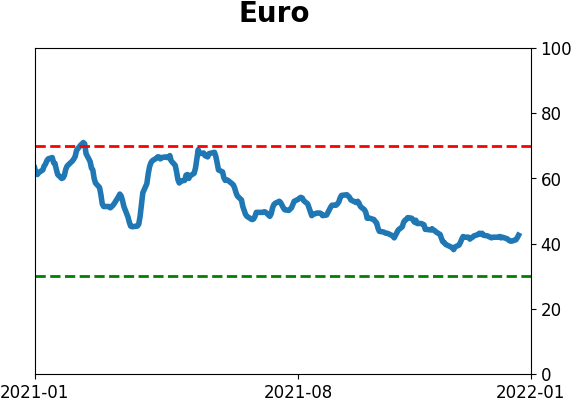
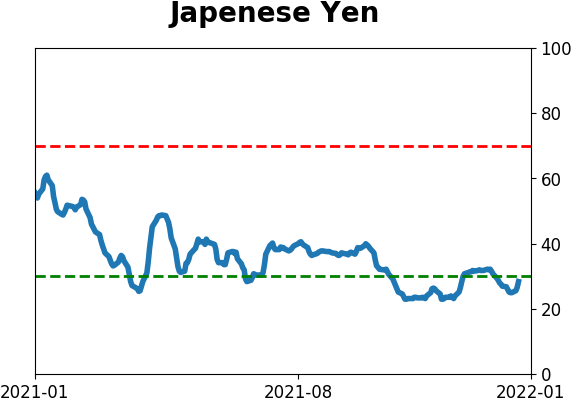
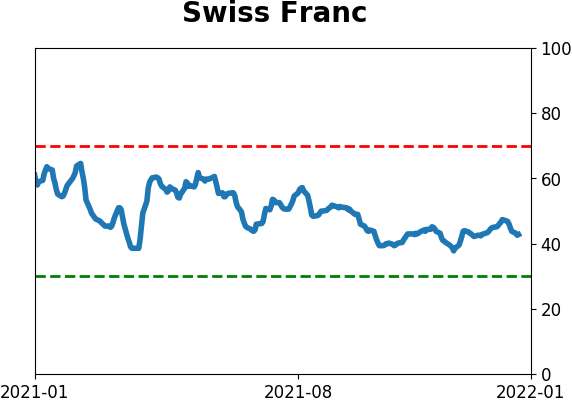
Currency ETF's - 5-Day Moving Average
|
|
|
Commodity ETF's - 5-Day Moving Average
|
|