Headlines
|
|
More signs of recovery in Asian stocks:
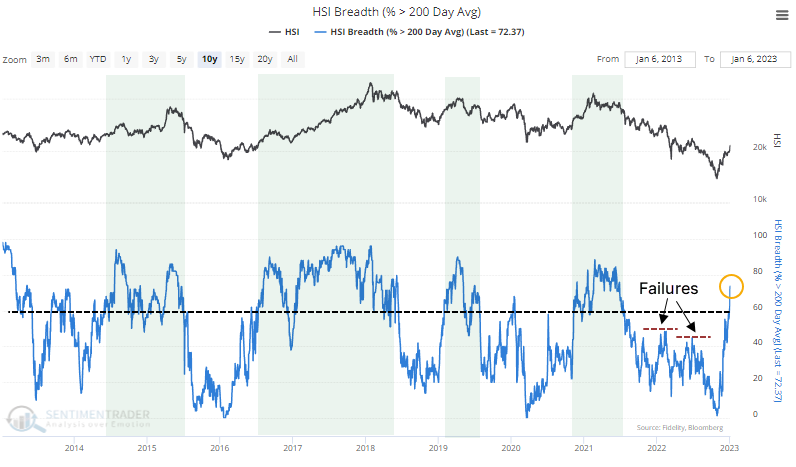
More than 70% of stocks in the Hang Seng index are now trading above their long-term 200-day moving averages, well above the threshold of failed bear market rallies. Short- and long-term thrusts have had a good record at preceding further gains in the index.
|
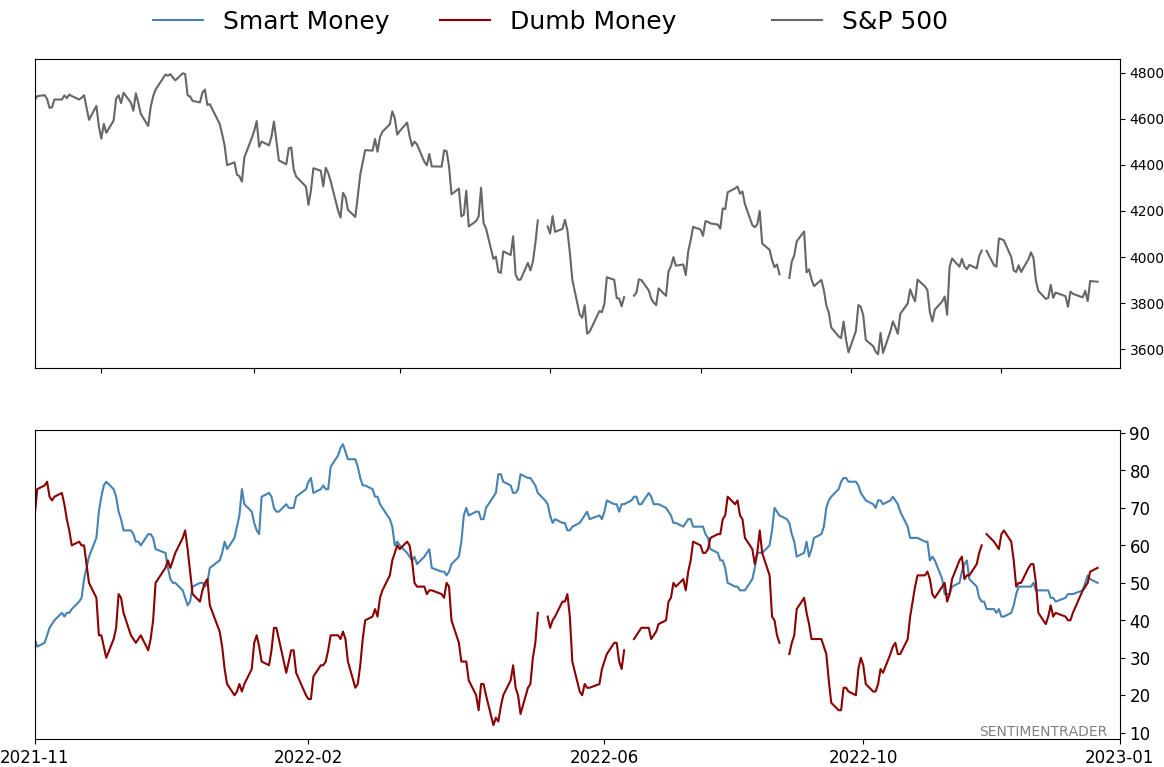
Smart / Dumb Money Confidence
|
Smart Money Confidence: 50%
Dumb Money Confidence: 54%
|
|
Risk Levels
Stocks Short-Term
|
Stocks Medium-Term
|
|
Bonds
|
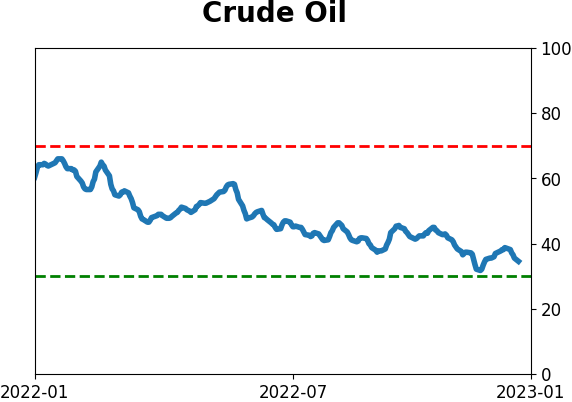
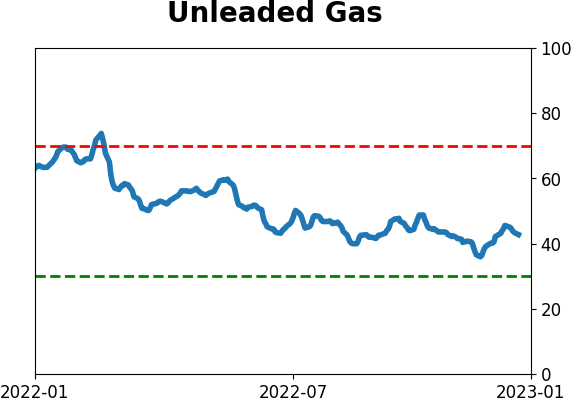
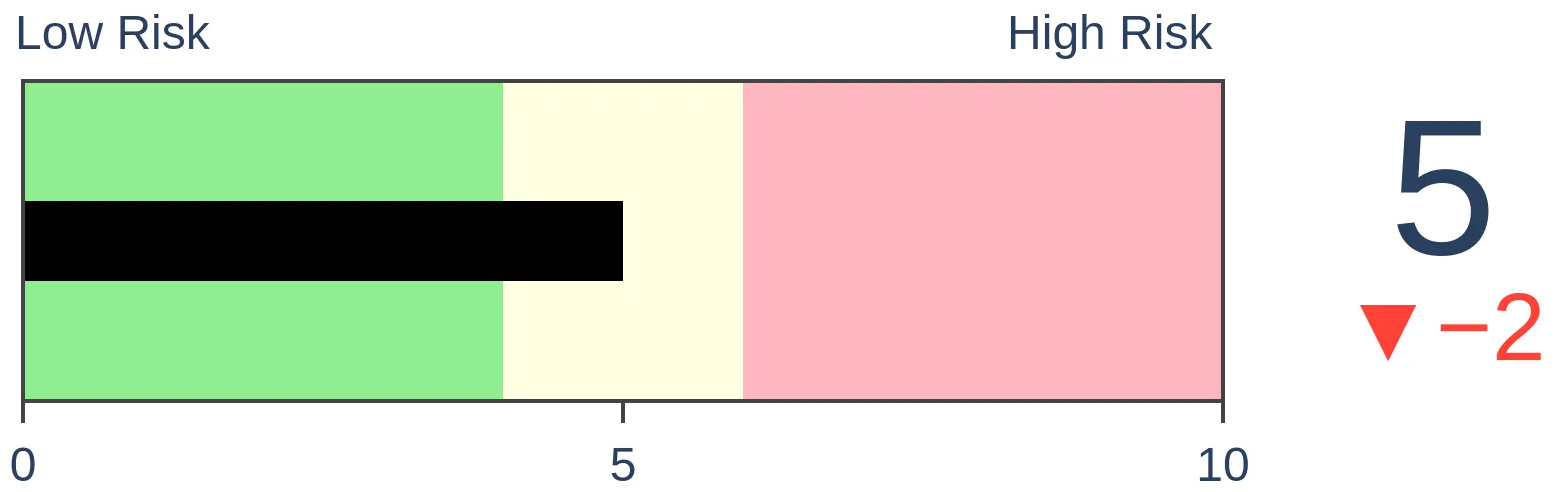
Crude Oil
|
|
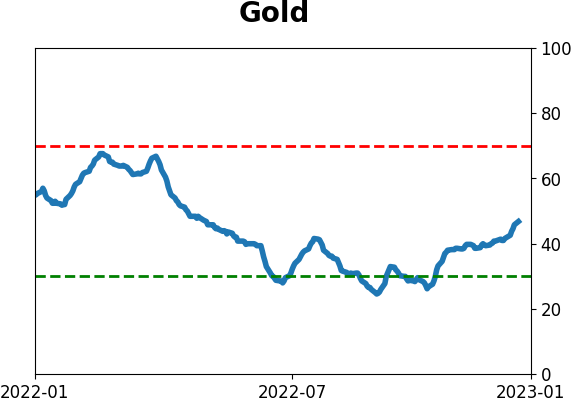
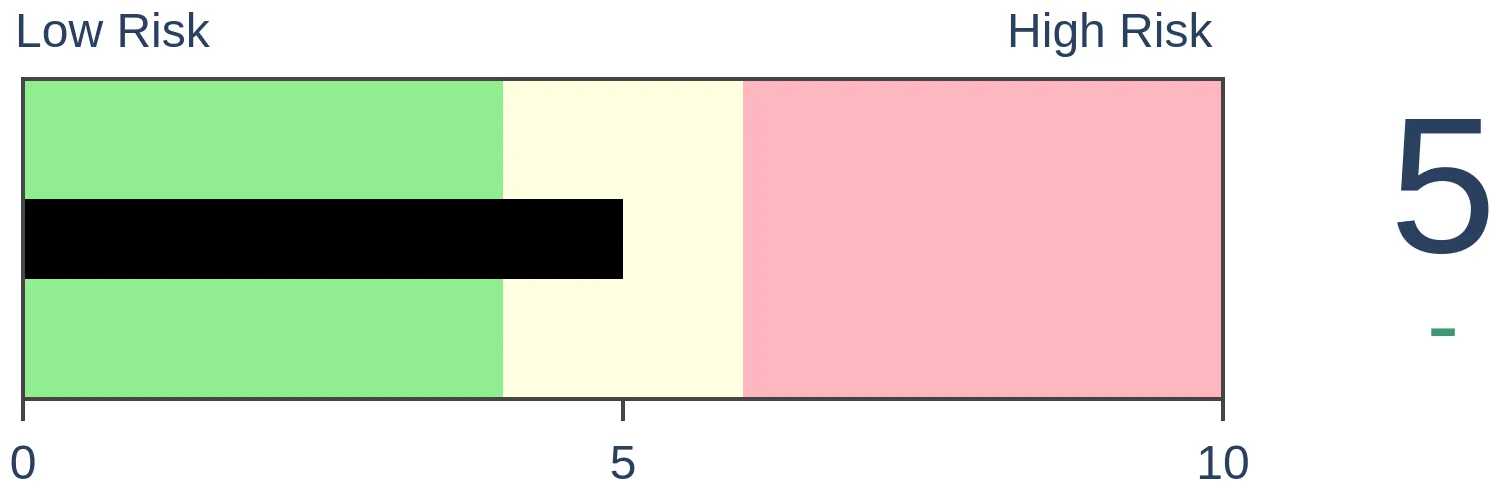
Gold

|
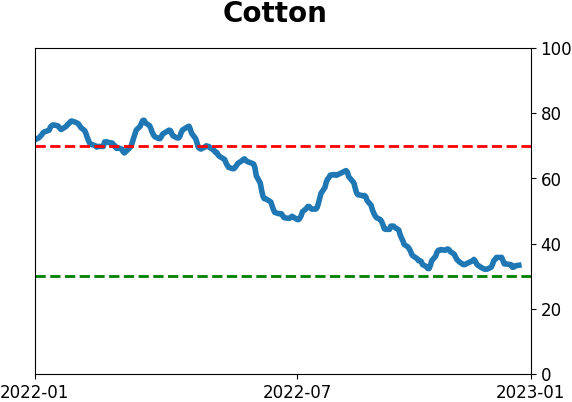
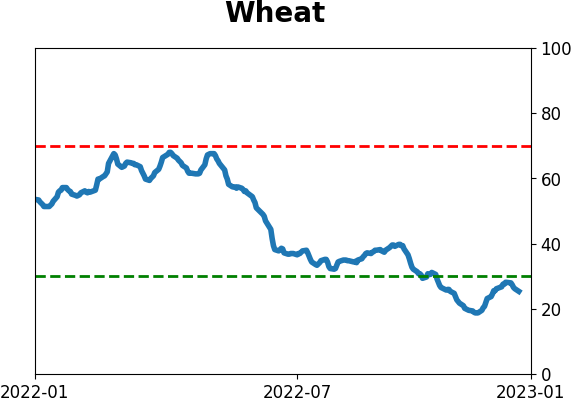
Agriculture
|
|
Research
By Jason Goepfert
BOTTOM LINE
More than 70% of stocks in the Hang Seng index are now trading above their long-term 200-day moving averages, well above the threshold of failed bear market rallies. Short- and long-term thrusts have had a good record at preceding further gains in the index.
FORECAST / TIMEFRAME
None
|
Key points:
- Stocks in the Hang Seng index have surged above their 200-day moving averages
- Short- and long-term thrusts are on a scale that have rarely occurred during ongoing bear markets
- It is further evidence that the character of the market has changed for the positive
Asian stocks have broken a bear market pattern
Two months ago, we looked at the nascent recovery in the Hang Seng, which appeared positive for longer-term returns in those stocks. The index has rallied almost 30% since then, furthering the case that this time should be different from the other rally attempts over the past year.
The biggest question at this point is more about whether it's too late for an investor as opposed to whether it's just another bear market rally. The recovery has been broad-based, and more than 70% of members in the index are now trading above their 200-day moving average.
A decent heuristic is that healthy markets tend to see more than 60% of their component stocks holding consistently above their 200-day averages. Bear market rallies typically end around this threshold or just above. The previous two bear market rallies in the Hang Seng ended when fewer than half of stocks were above their averages. The current surge is a definite change in character.
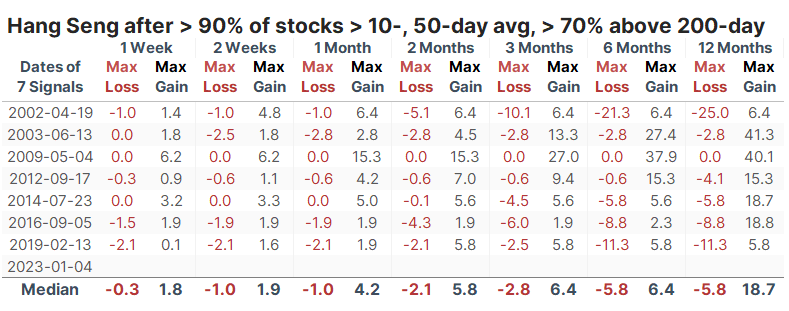
Over the past 22 years, when there was a cycle of fewer than 10% of members holding above their long-term averages to more than 70% of members, the Hang Seng tended to hold its upside momentum for at least the next couple of weeks, and typically longer.
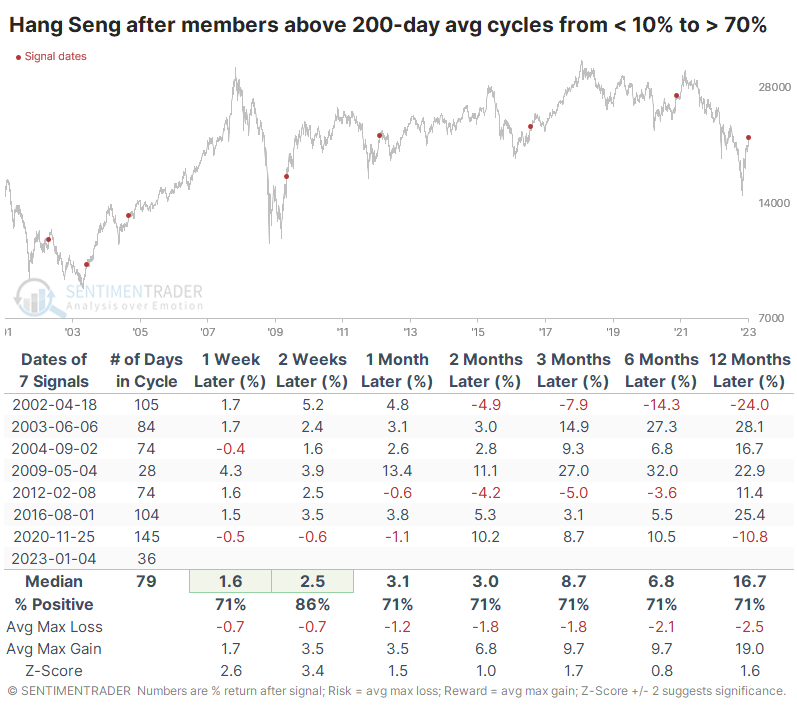
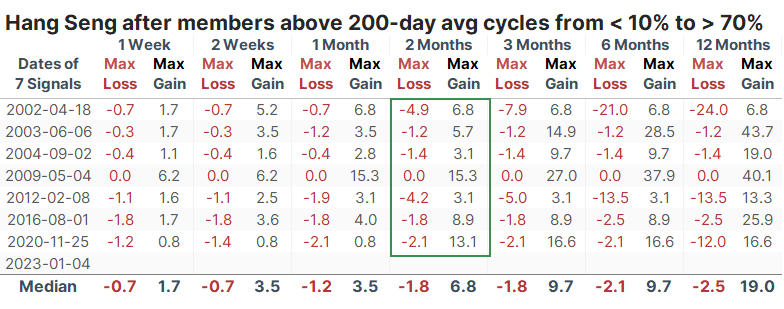
After all but one of the signals, the index enjoyed a larger maximum gain than maximum loss over the next two months.
Surges have triggered across time frames
The push above long-term averages means surges in shorter time frames, almost by definition. Indeed, more than 90% of Hang Seng members traded above their 10-day and 50-day moving averages last week.
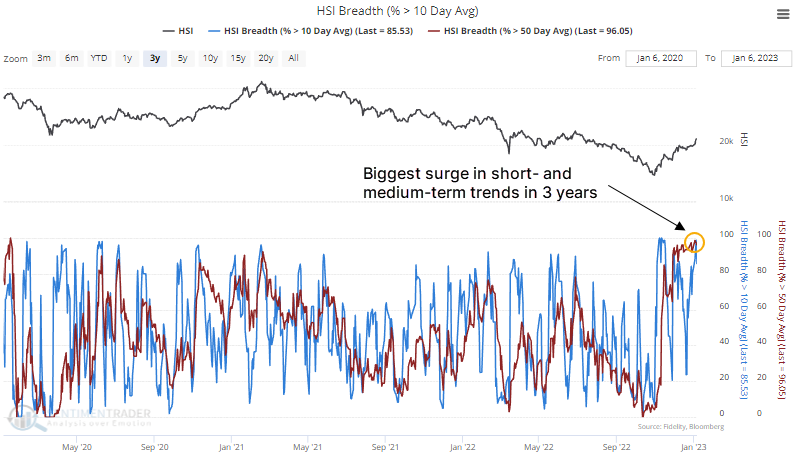
That is not something that usually happens during protracted bear markets.
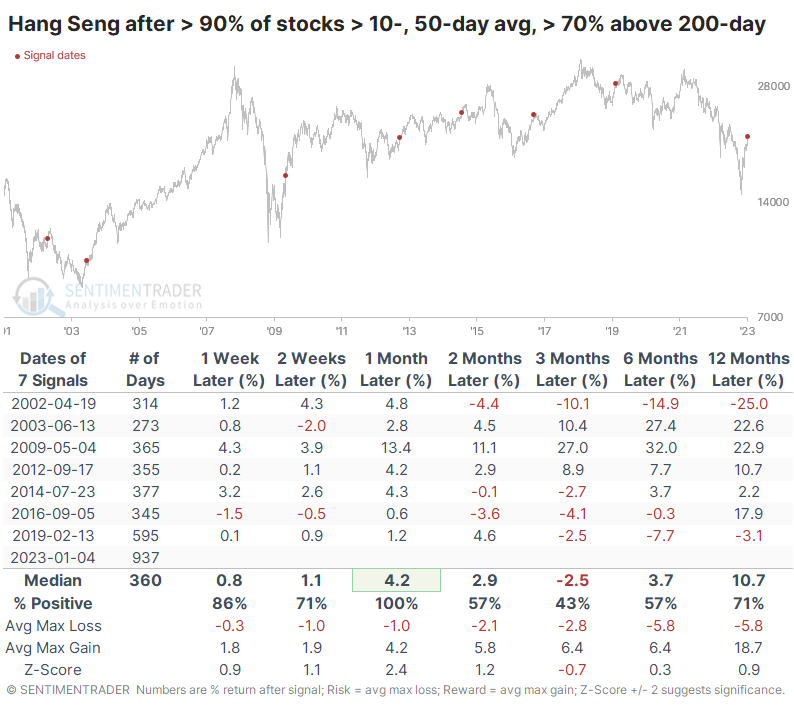
Again, after signals like this, the risk/reward had a strong tendency to favor the "reward" side, at least over the next month.
What the research tells us...
Investors suffered a couple of vicious head-fakes in Asian stocks last year. It culminated in one of the biggest panics we've ever seen in any market in October. The recovery since then in many (most) of the stocks has been just as vicious, and sentiment has only recently begun to shift. There is a lot of room for that to continue, and the surge over the past couple of weeks is a good long-term sign that seldom happens during ongoing bear markets.
Indicators at Extremes
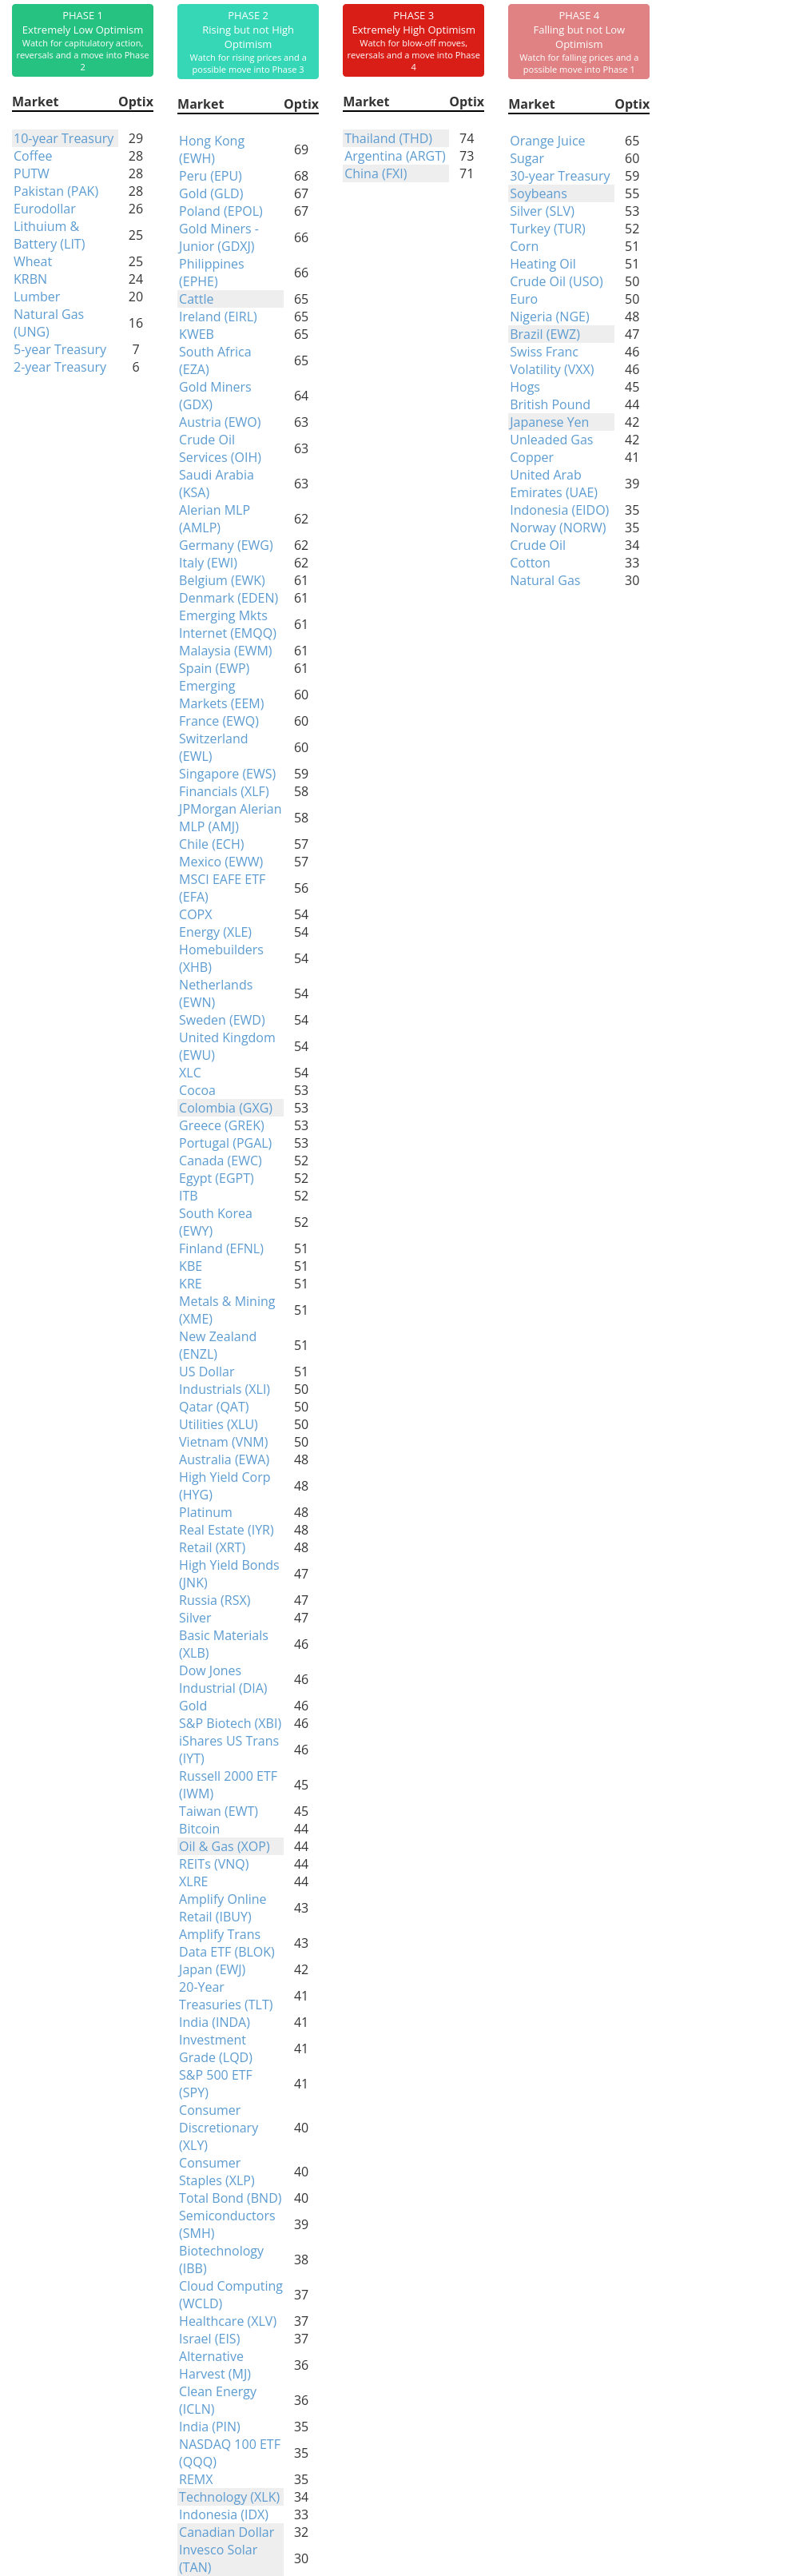
Phase Table
Ranks
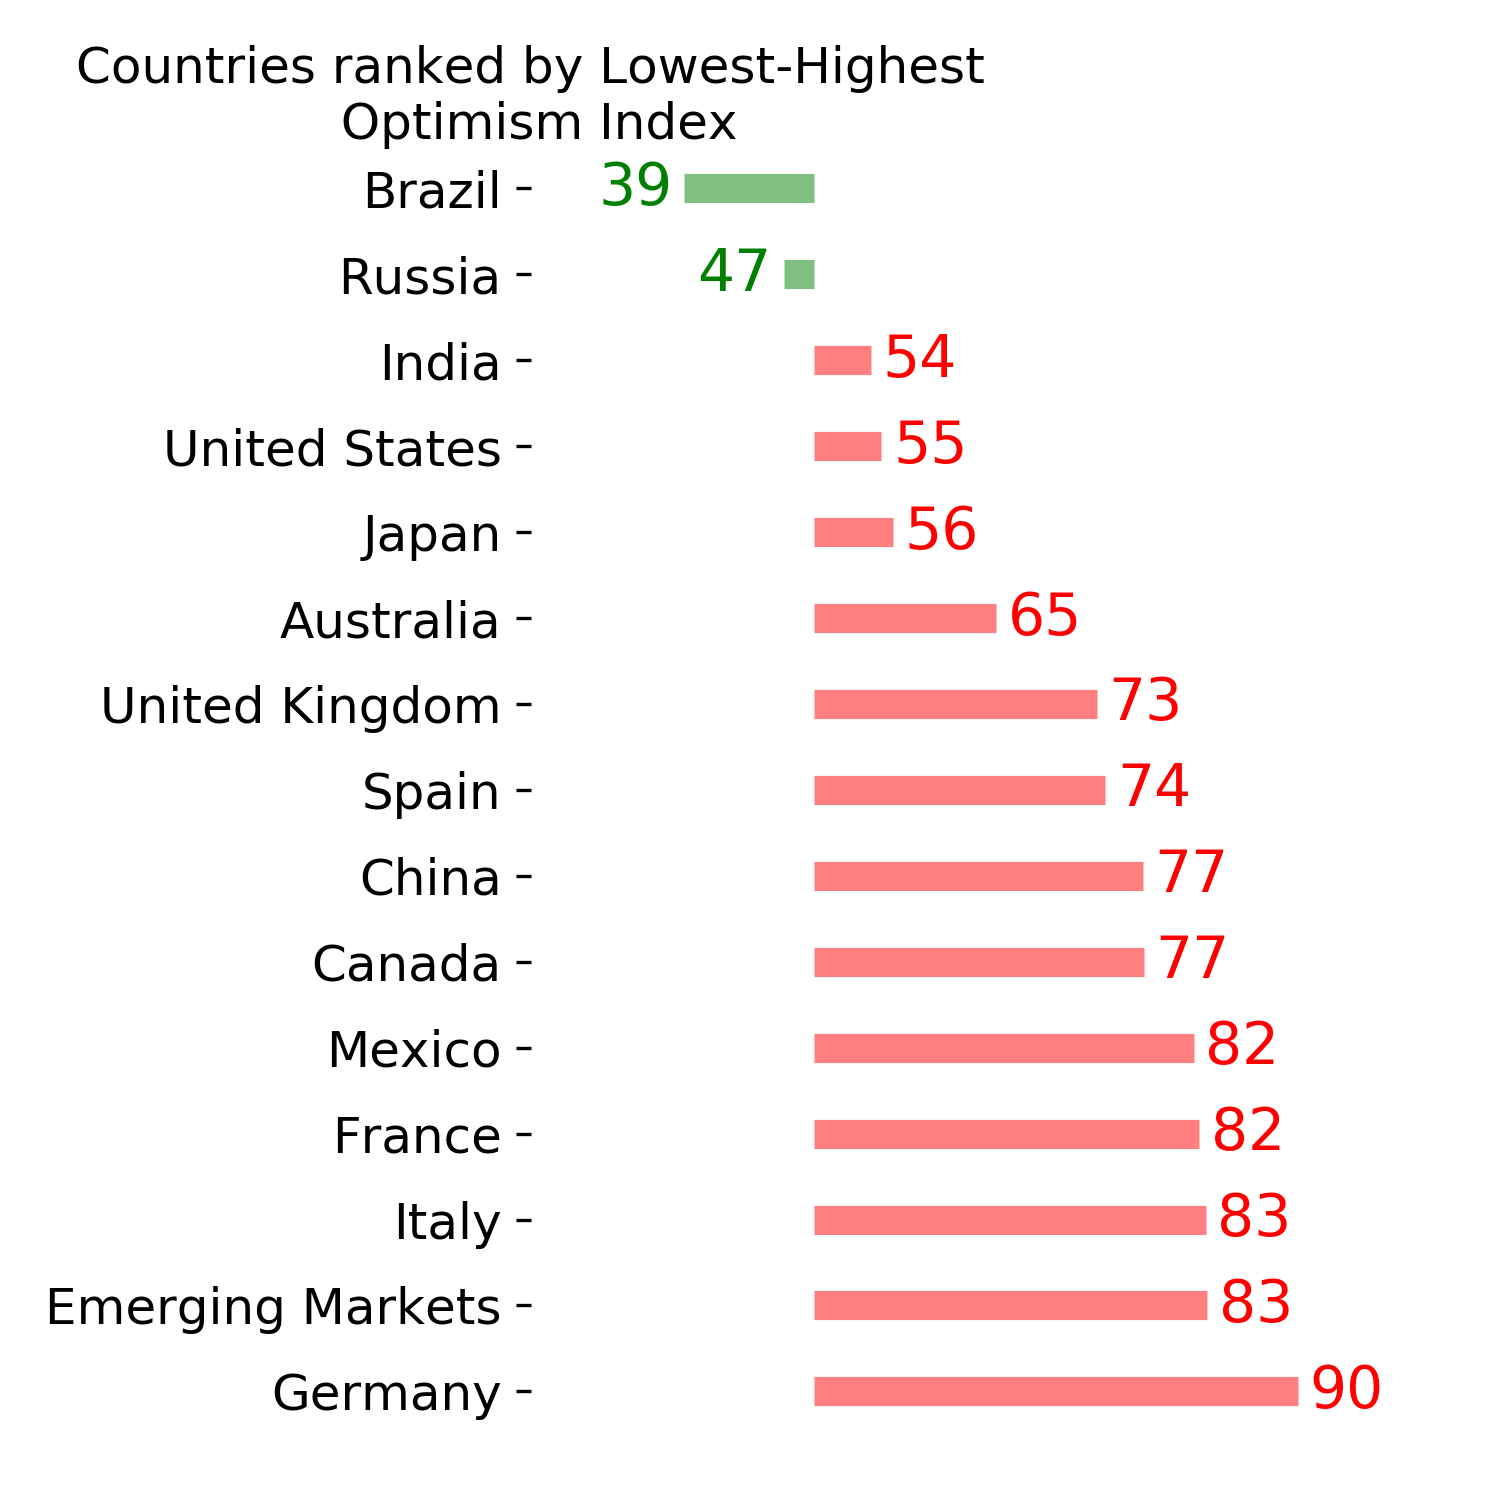
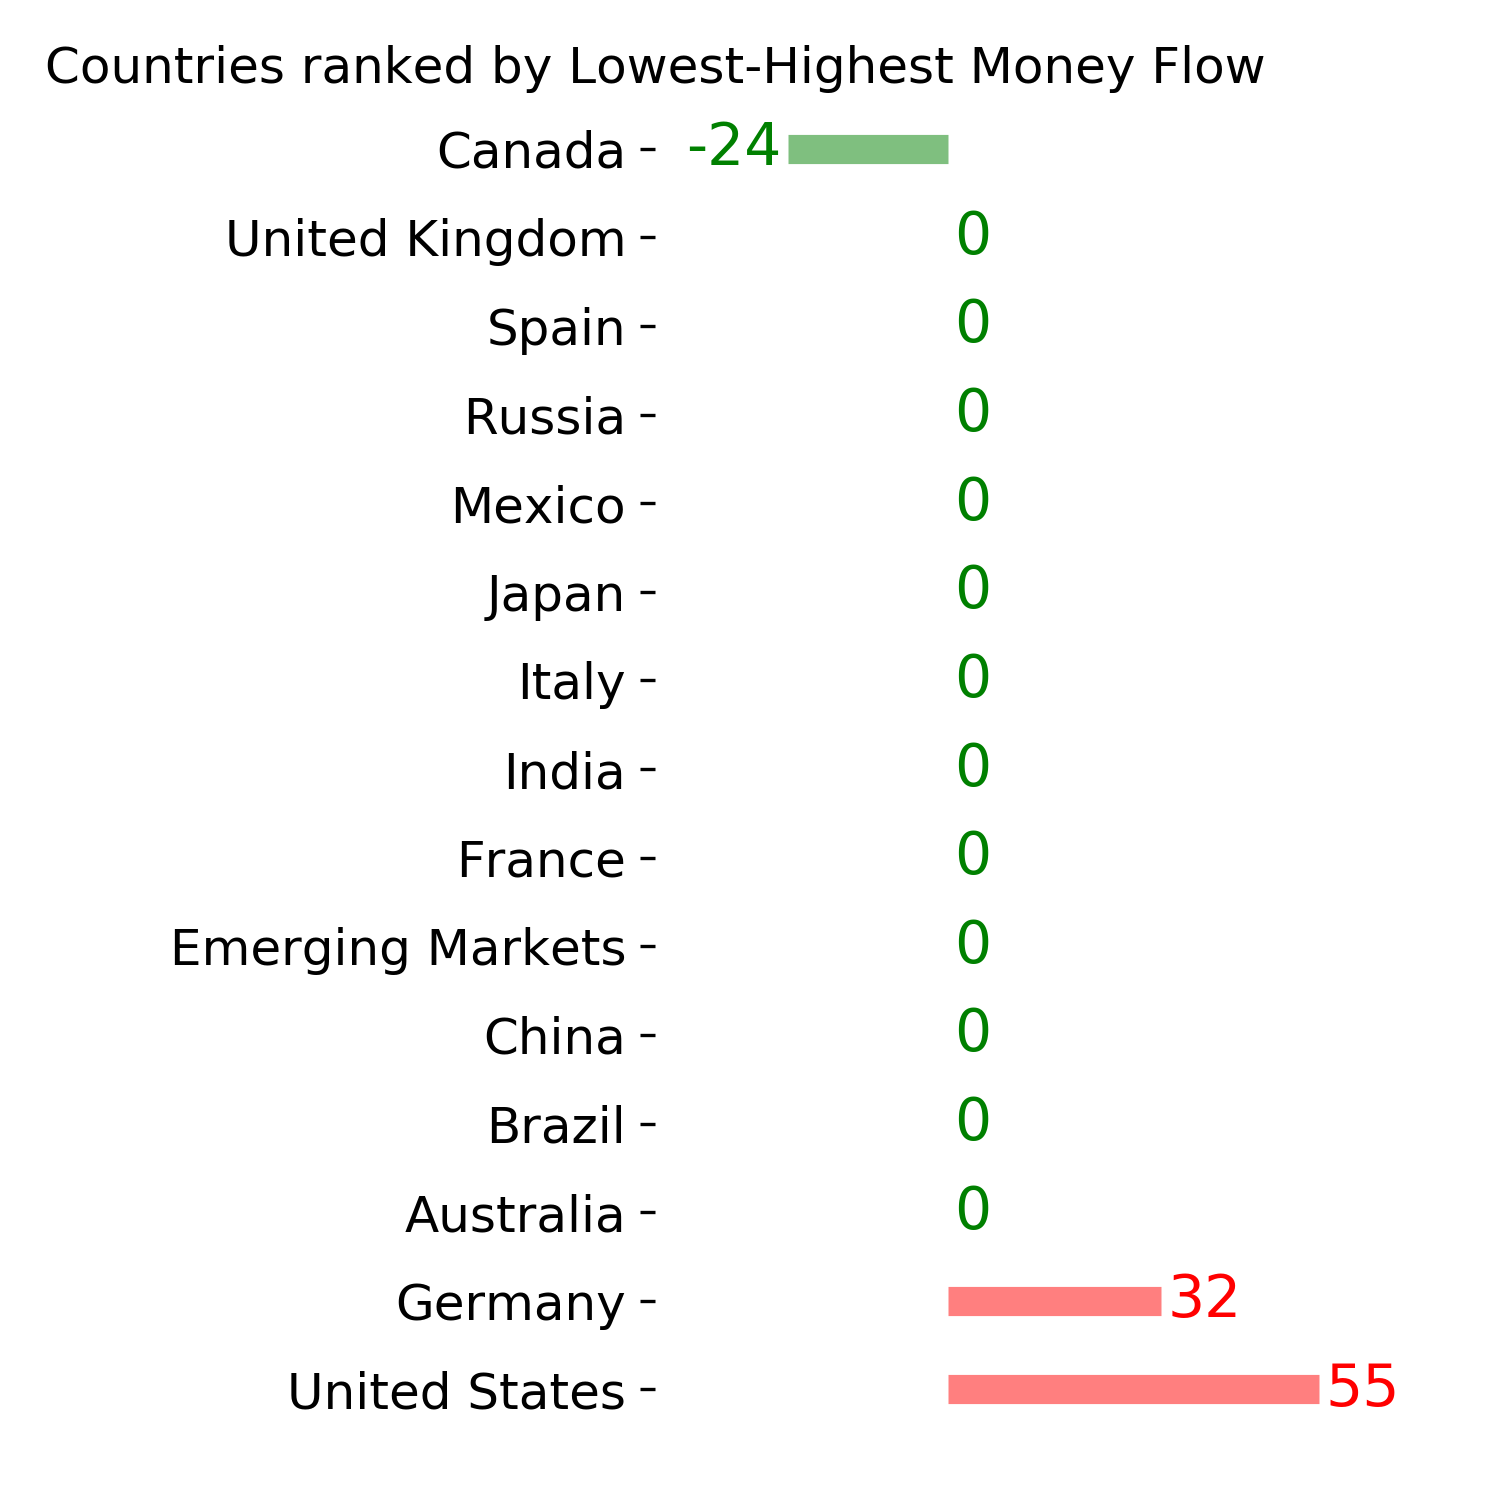
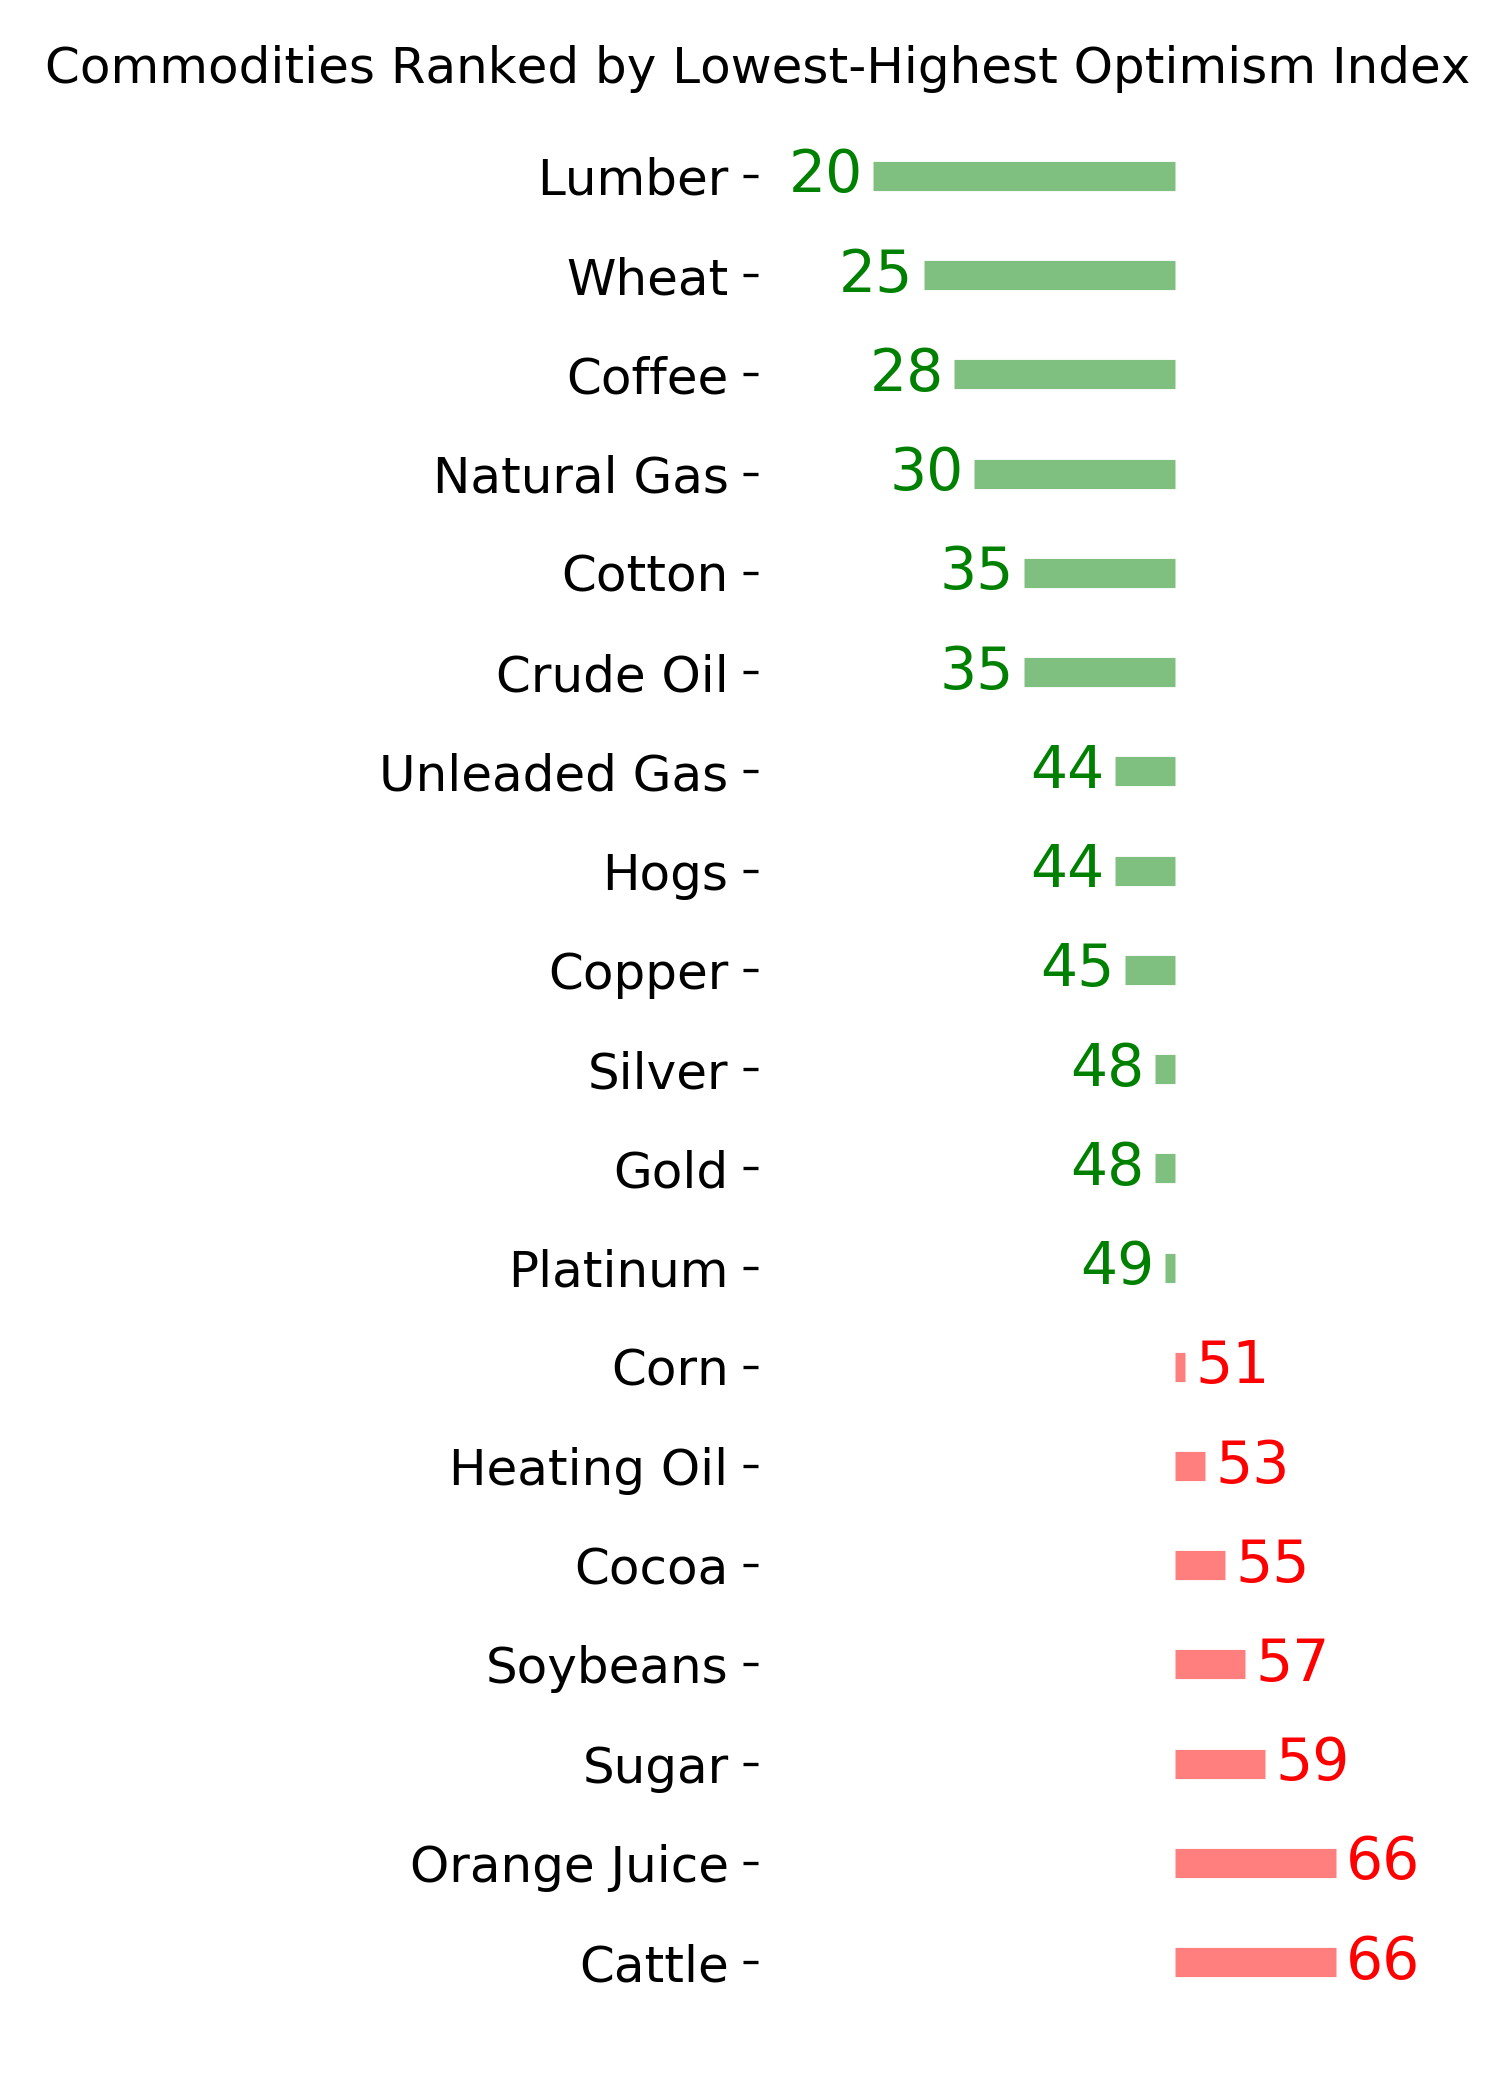
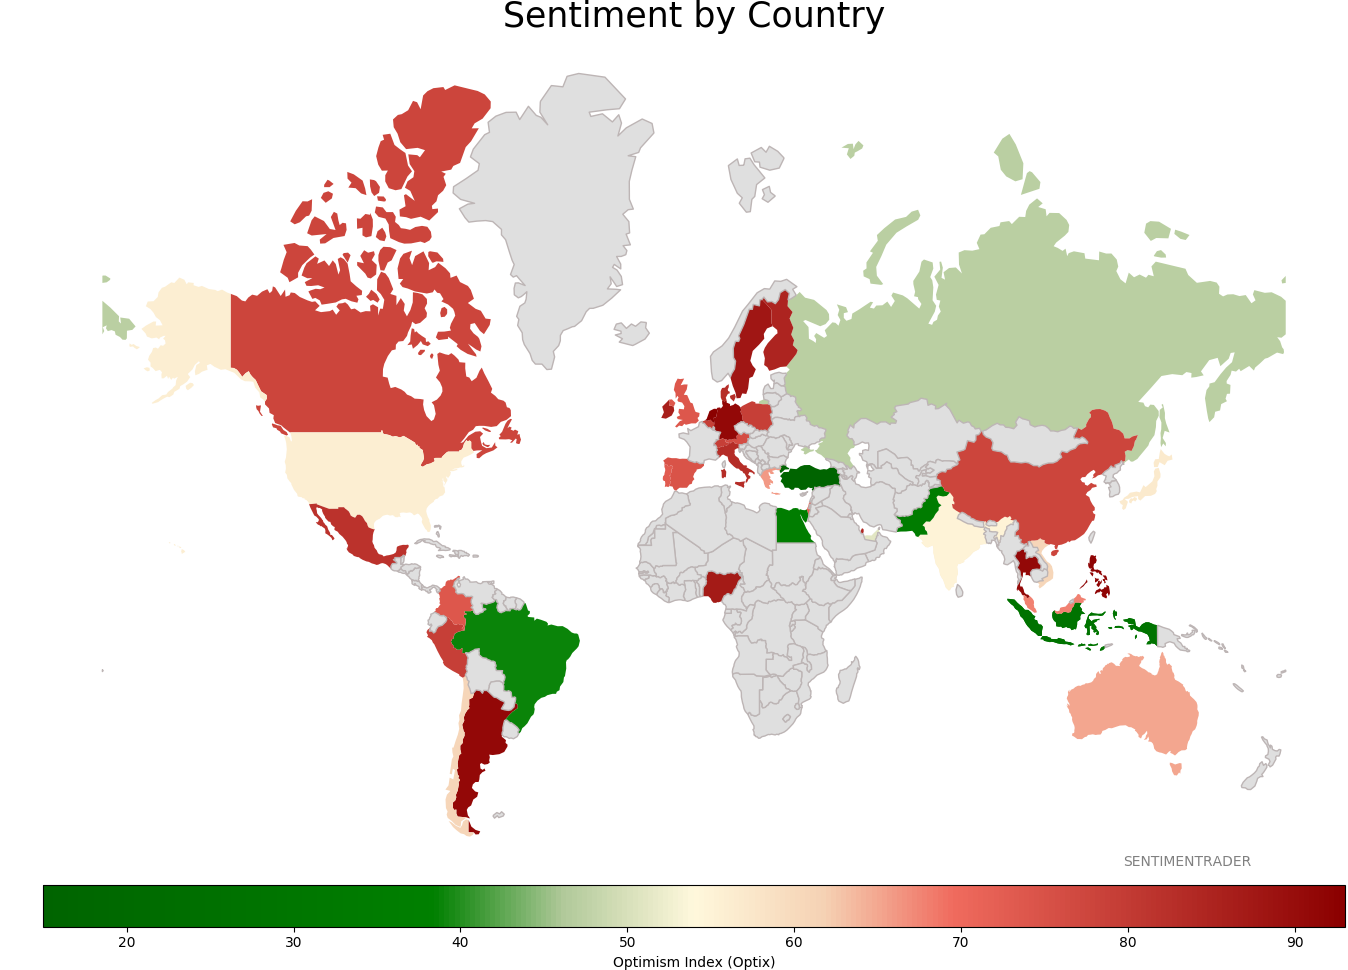
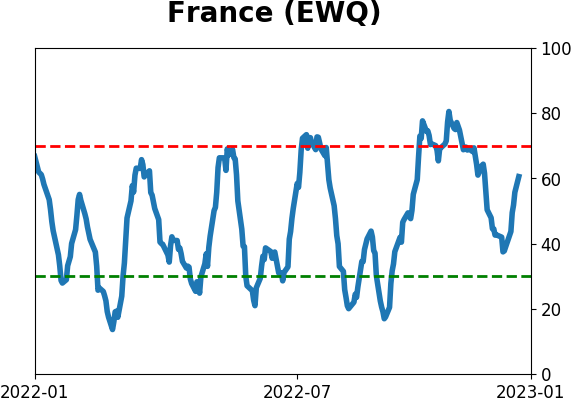
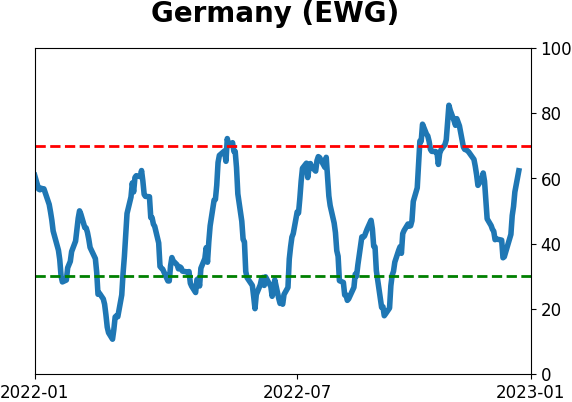
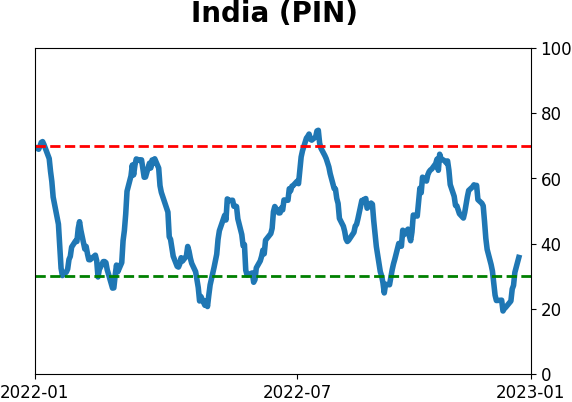
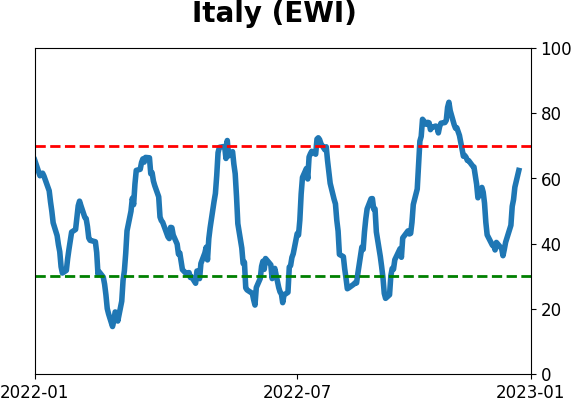
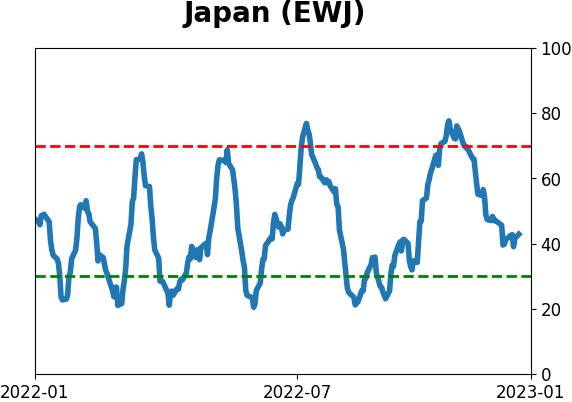
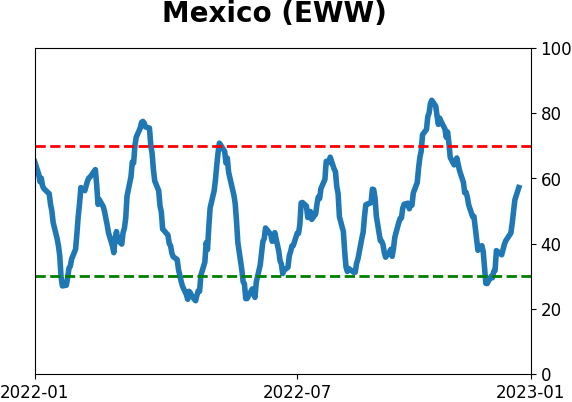
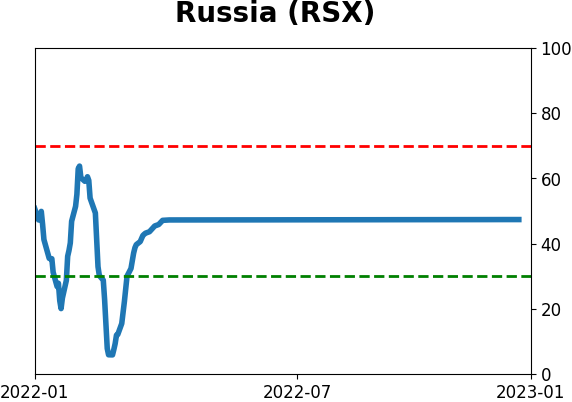
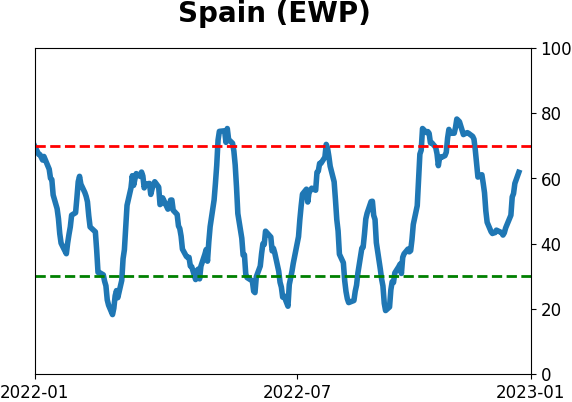
Sentiment Around The World
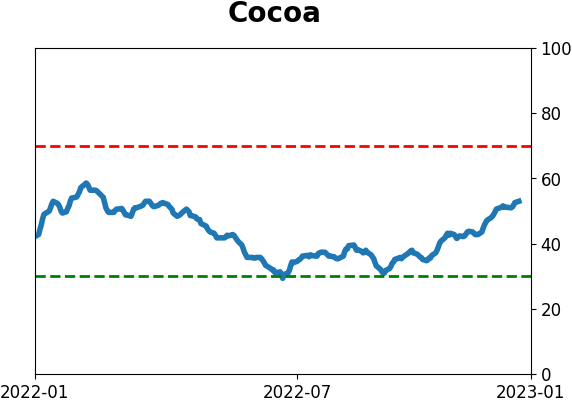
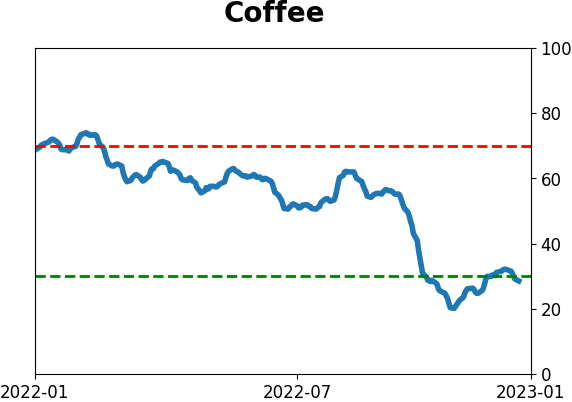
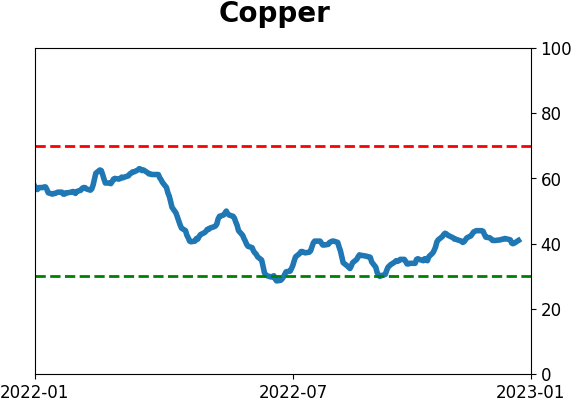
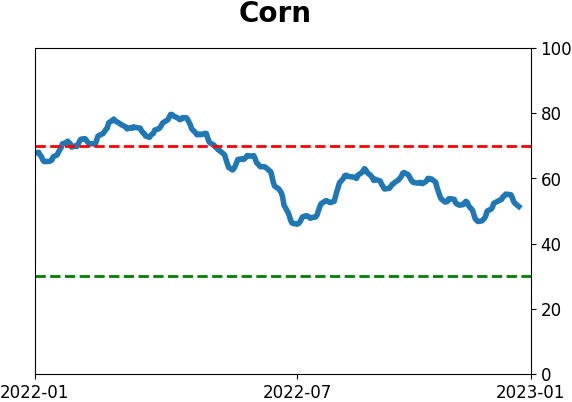
Optimism Index Thumbnails
|
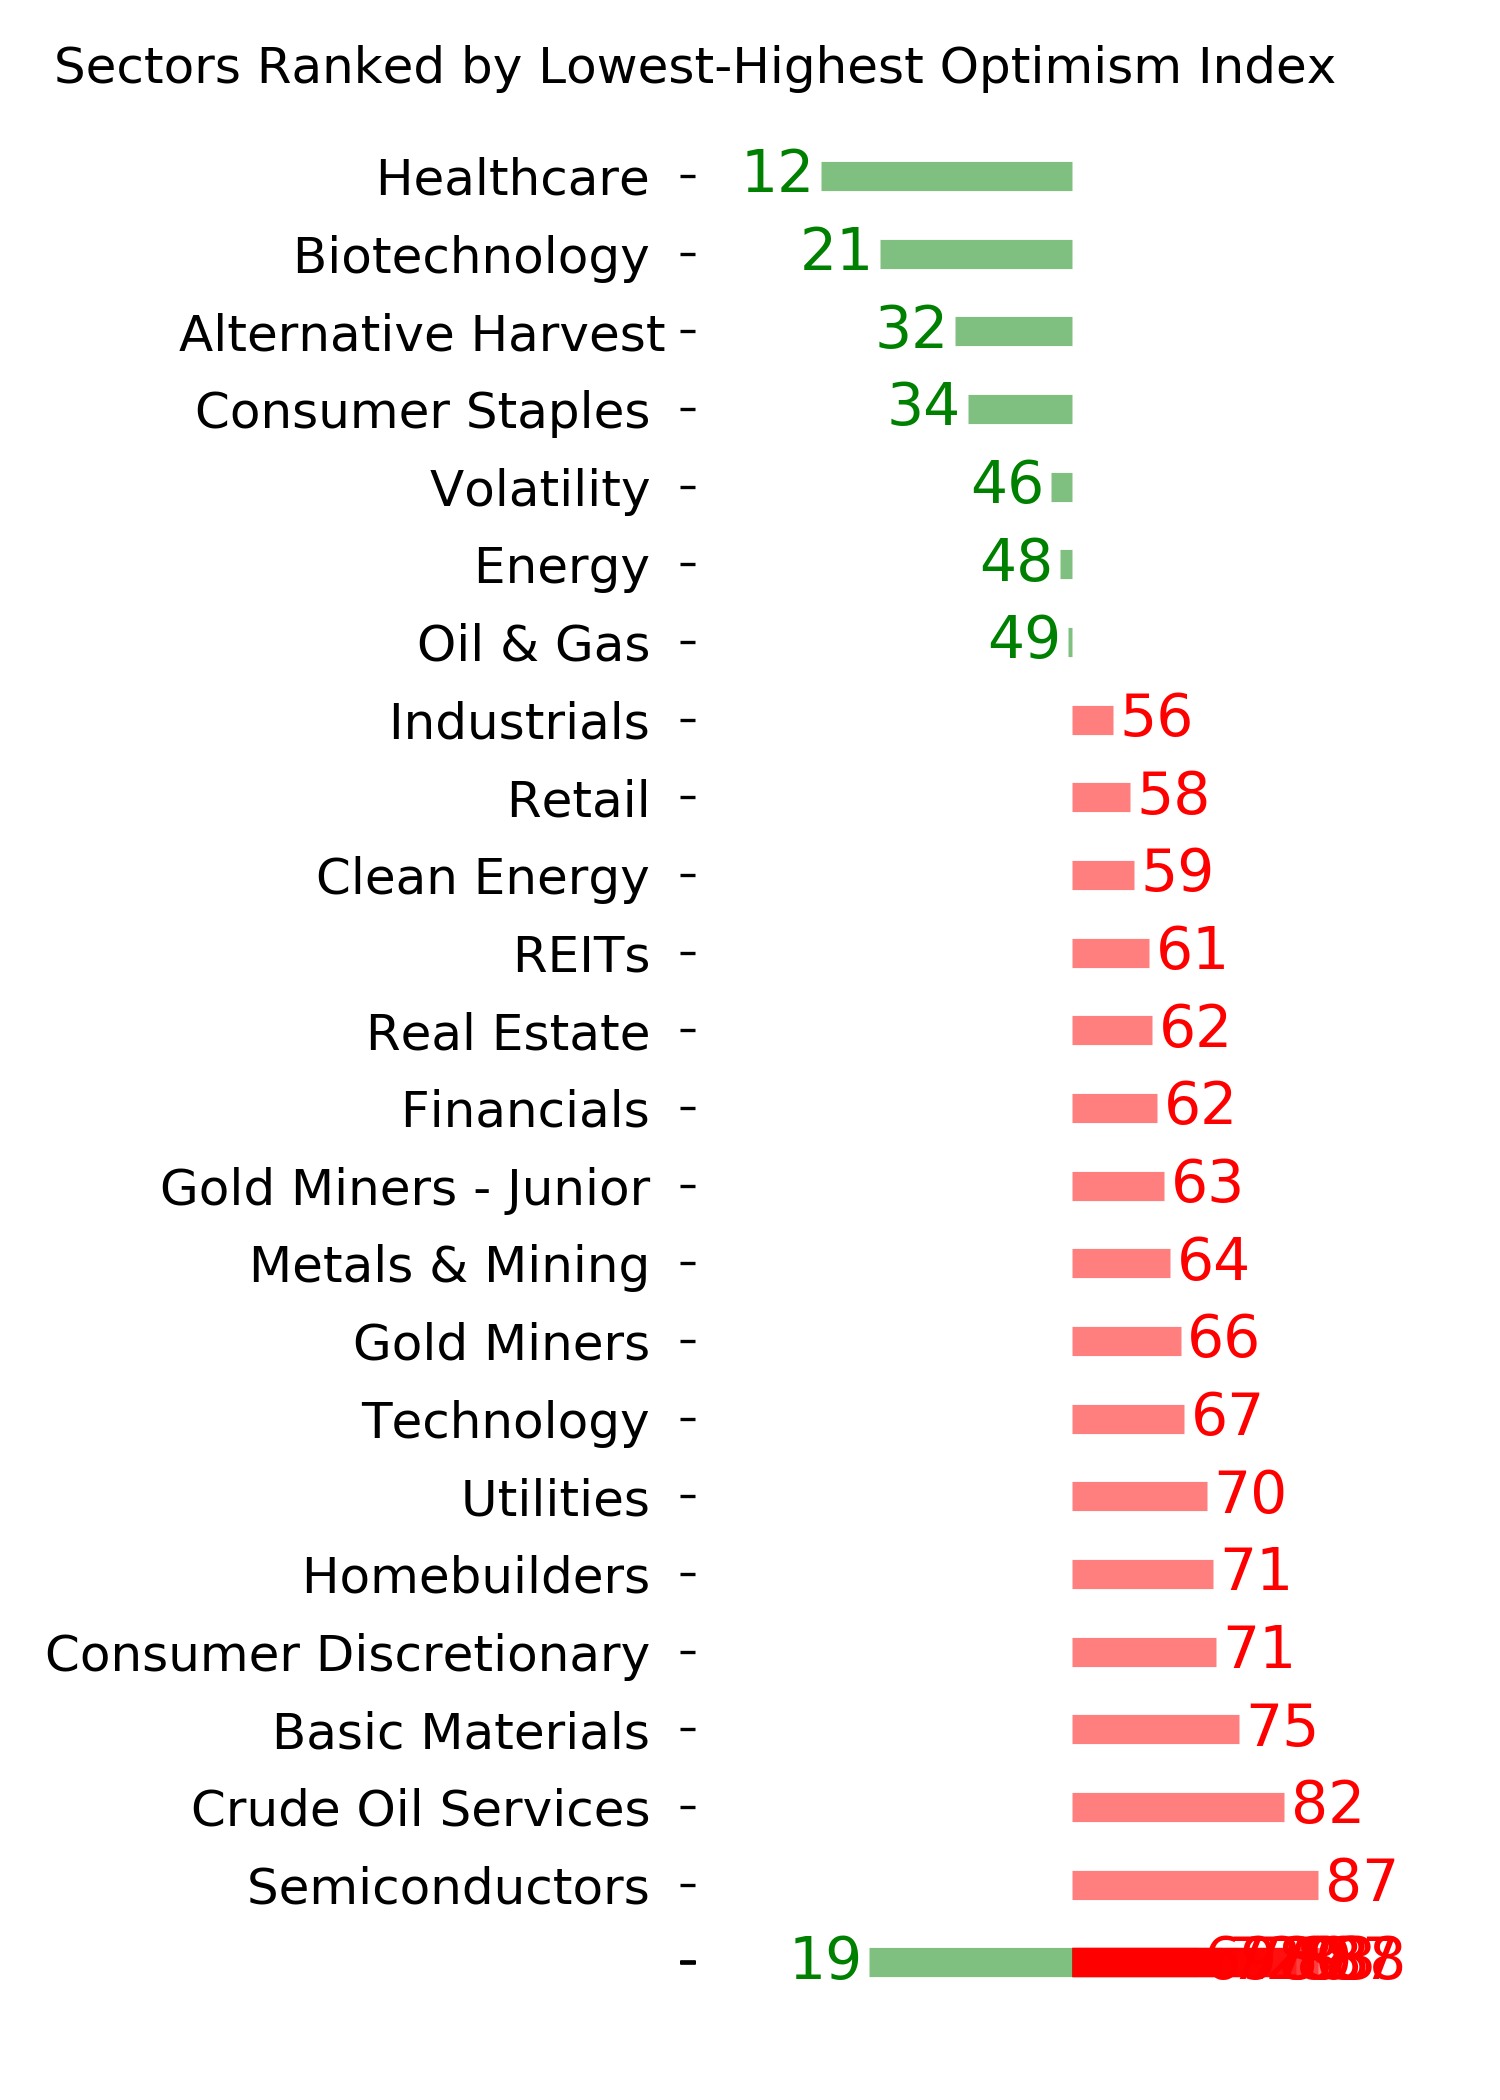
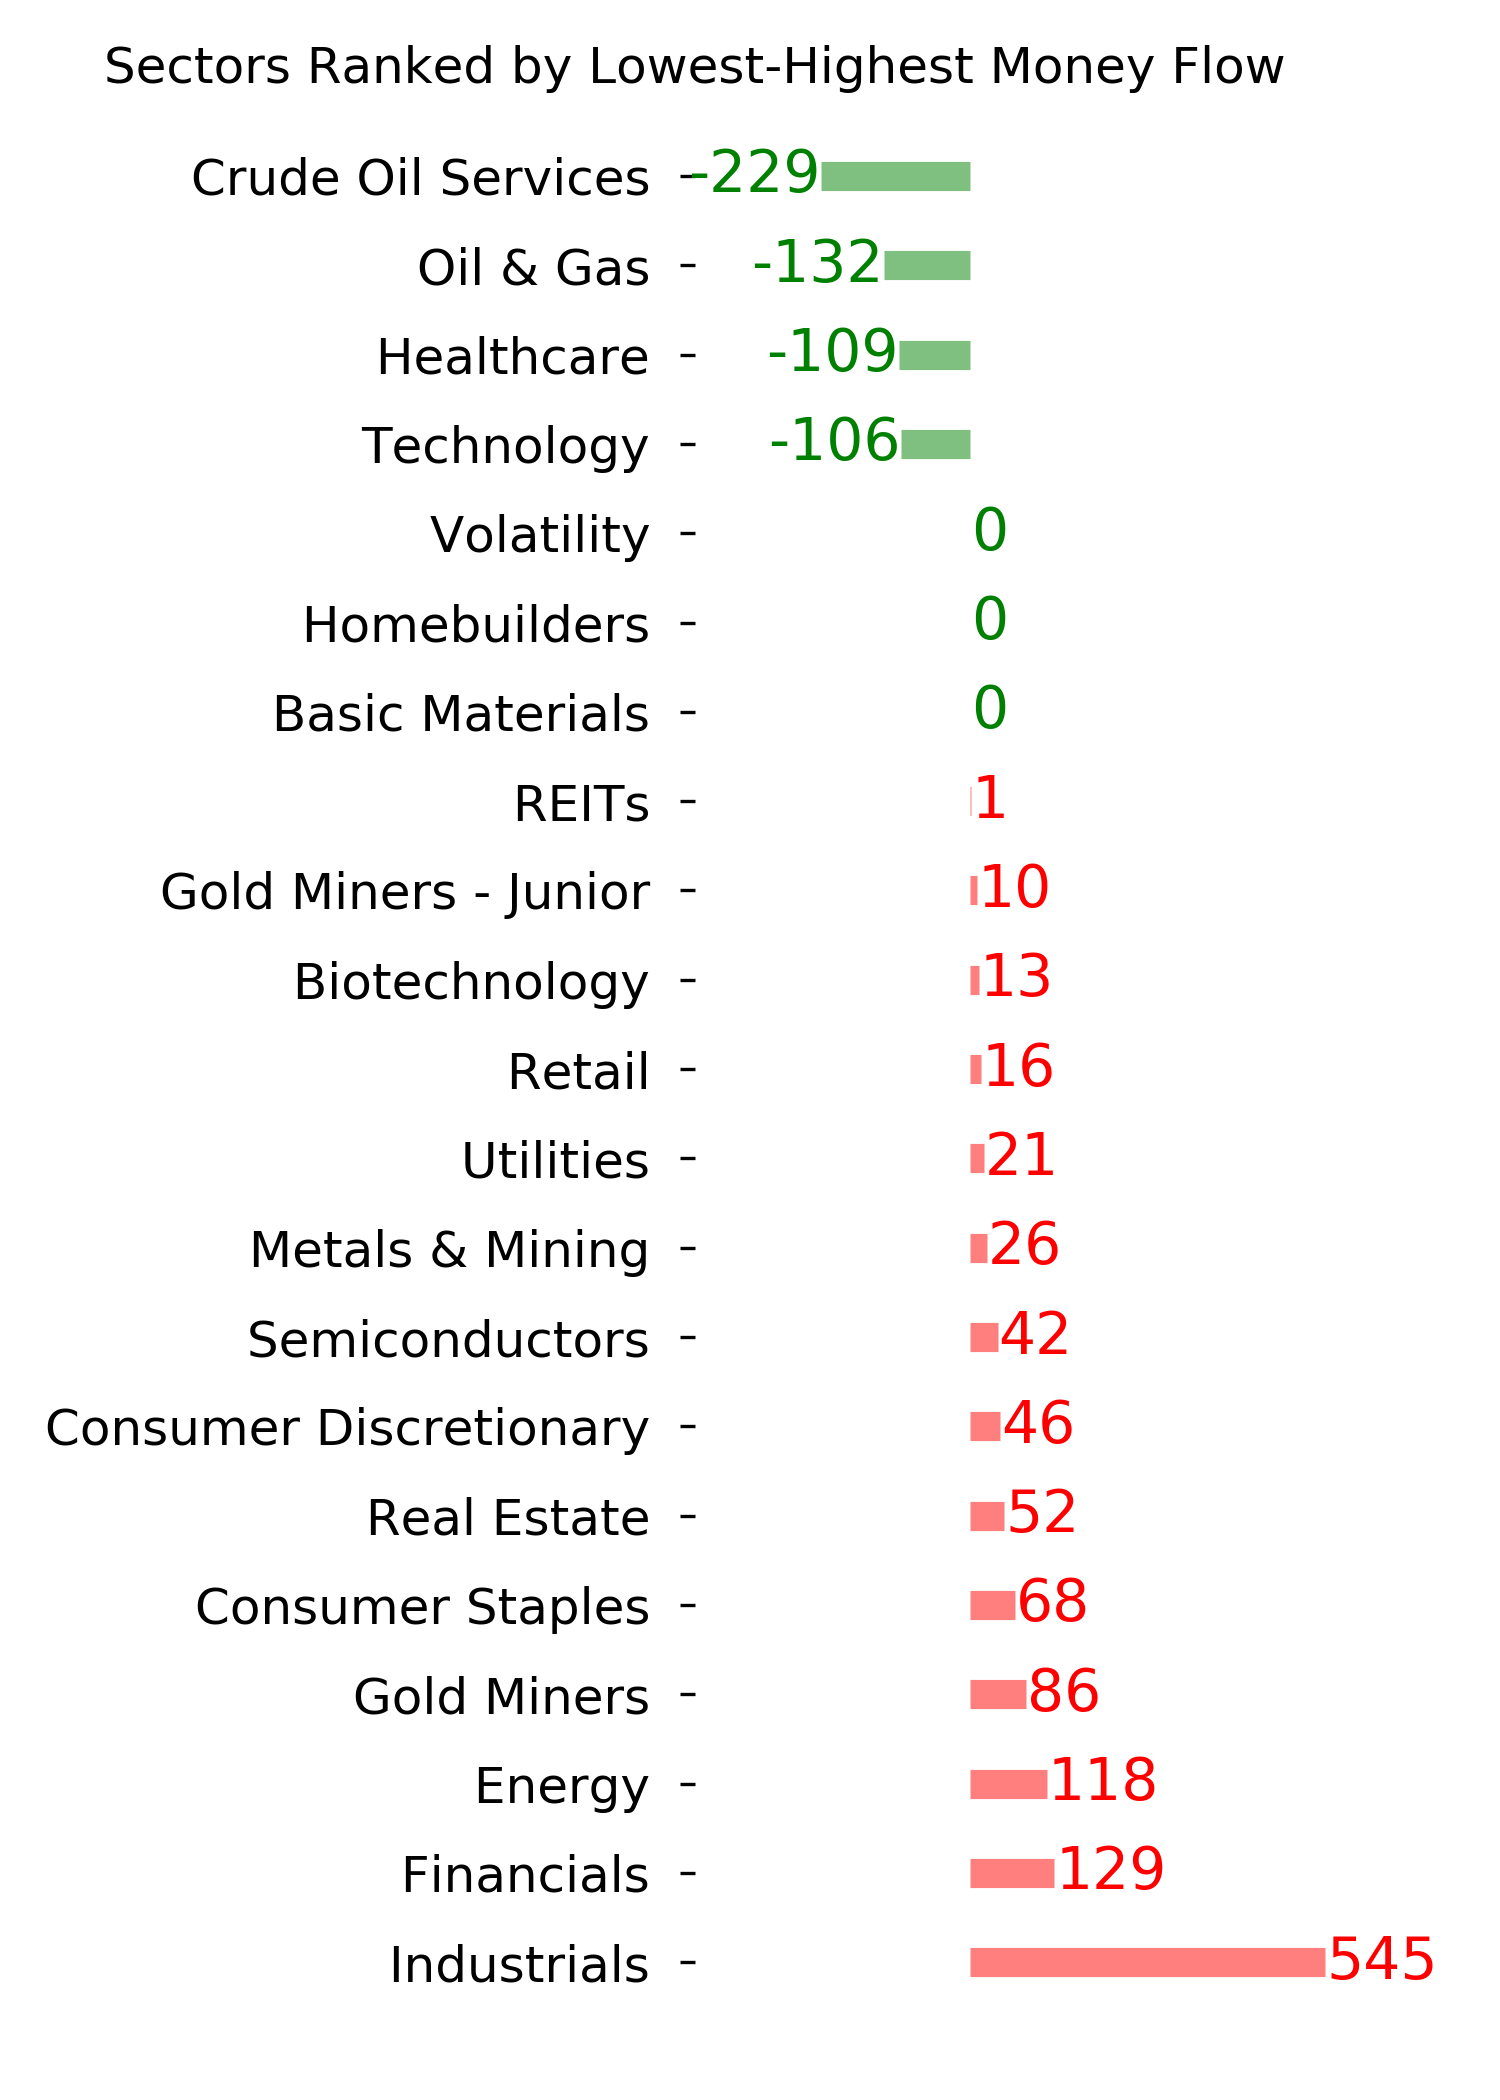
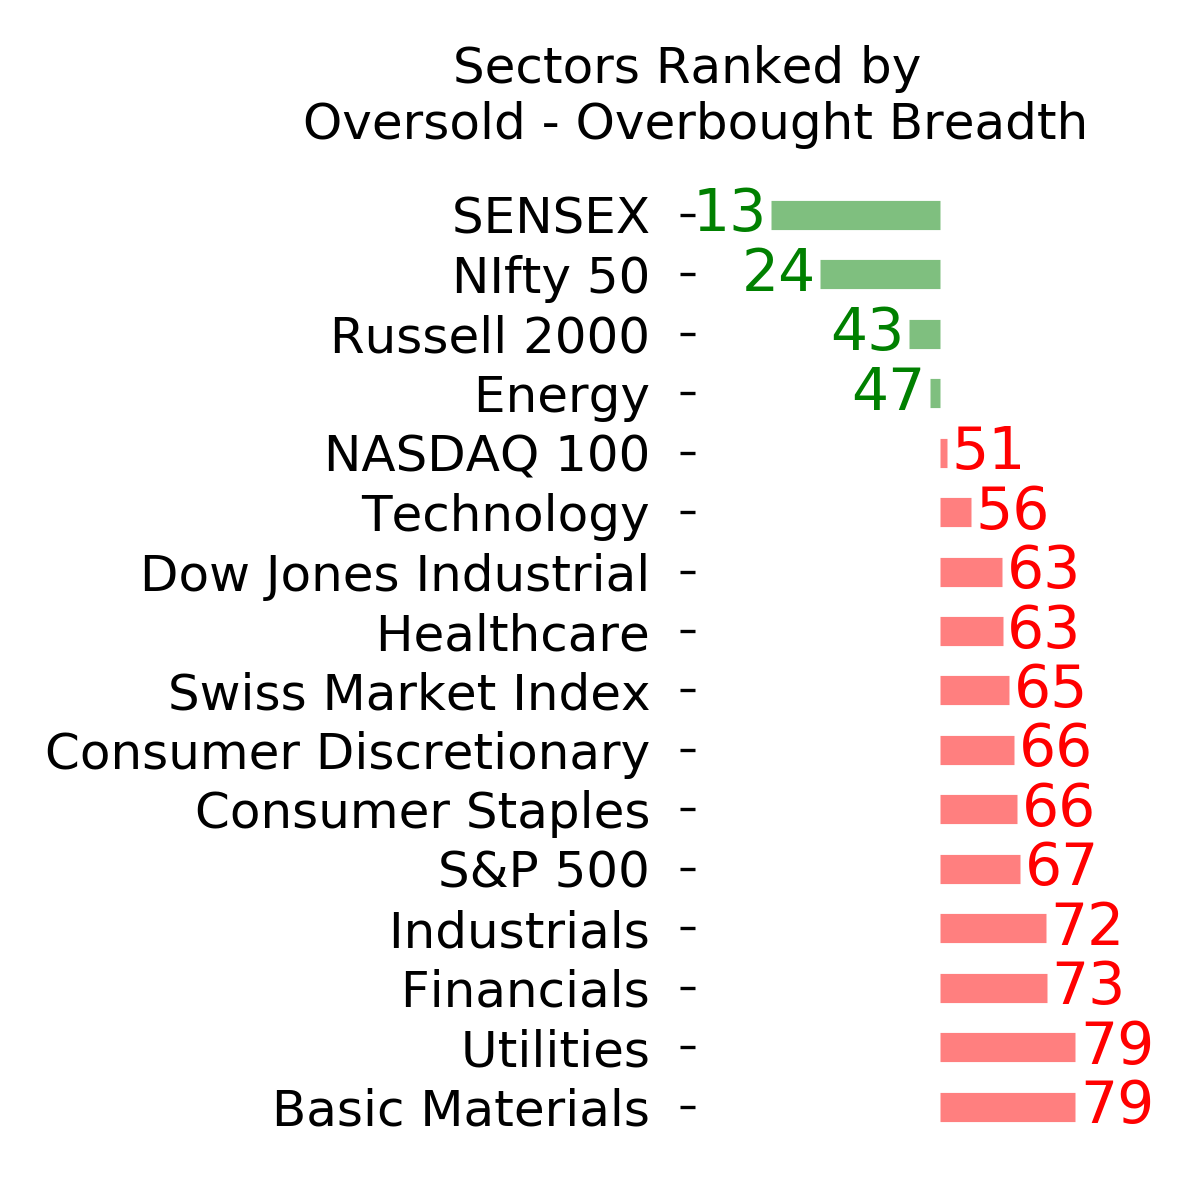
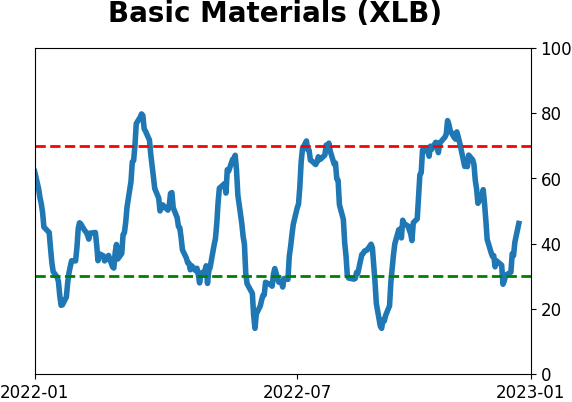
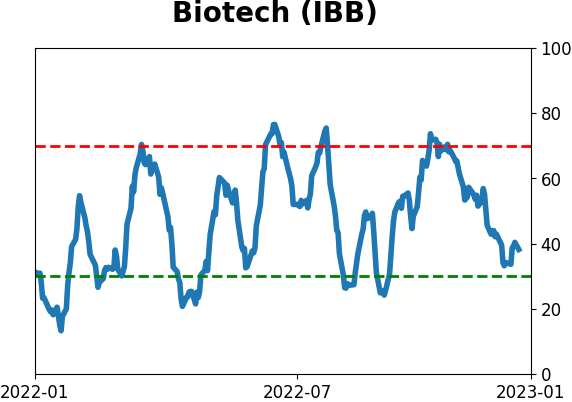
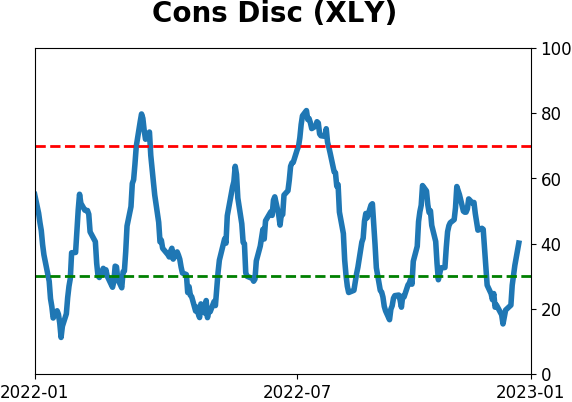
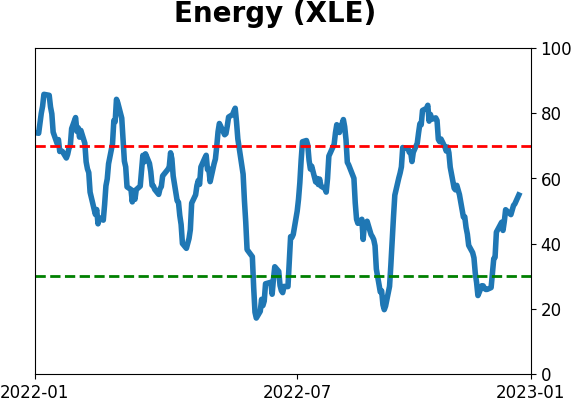
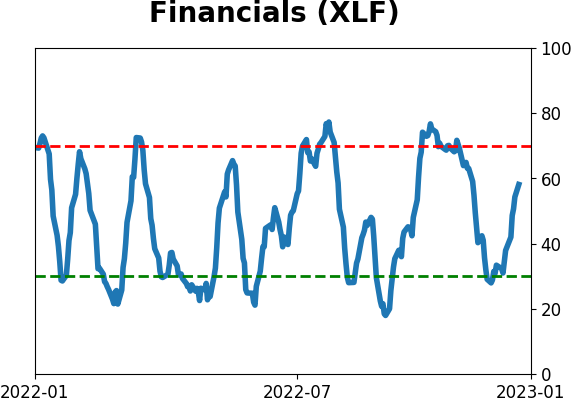
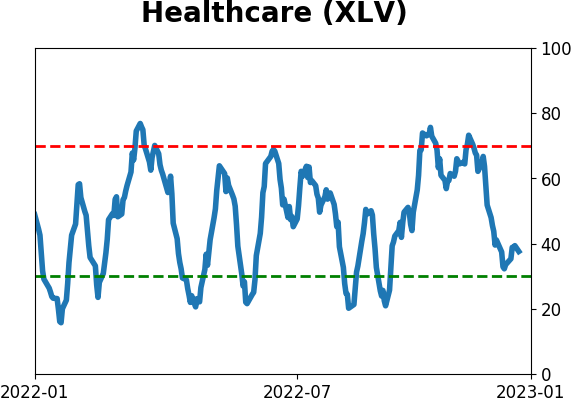
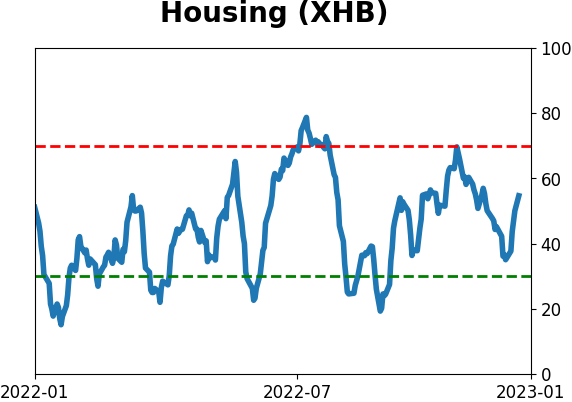
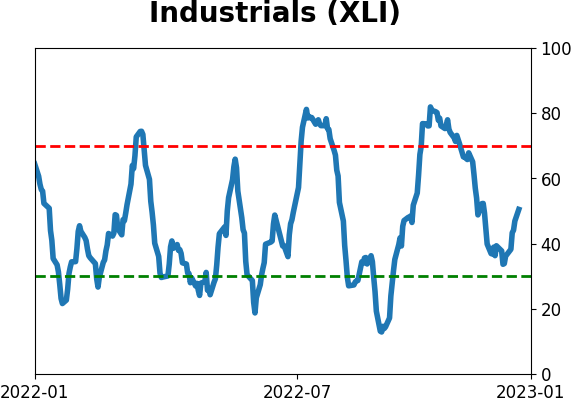
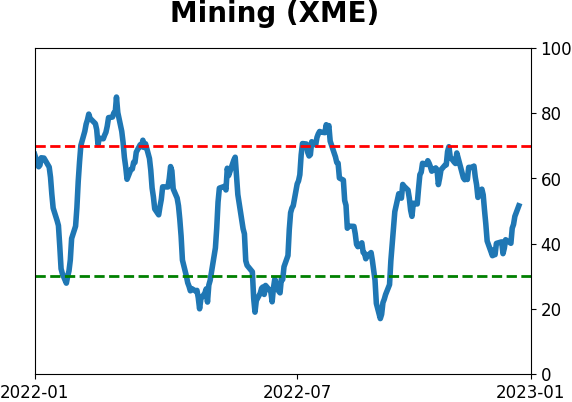
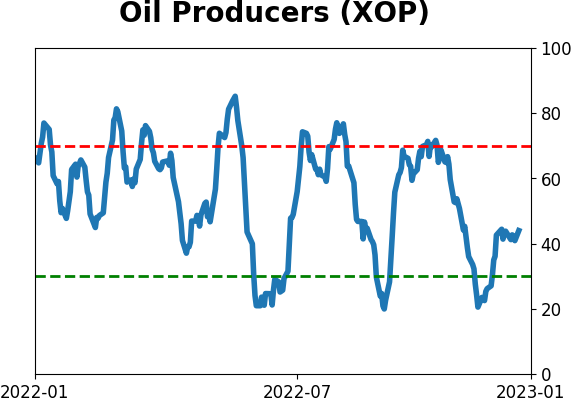
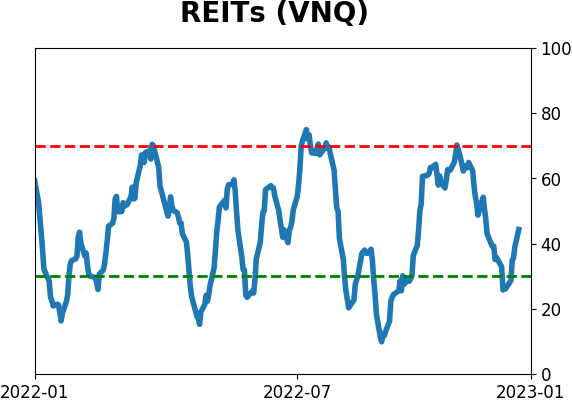
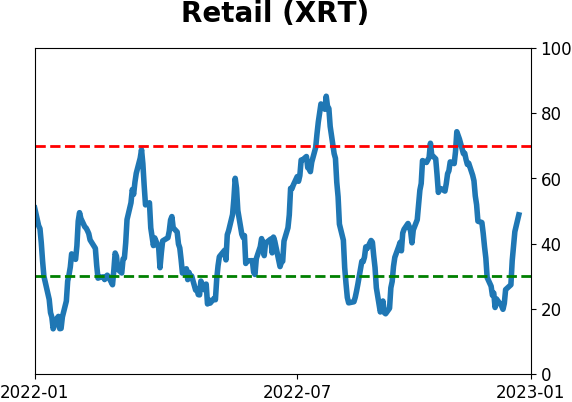
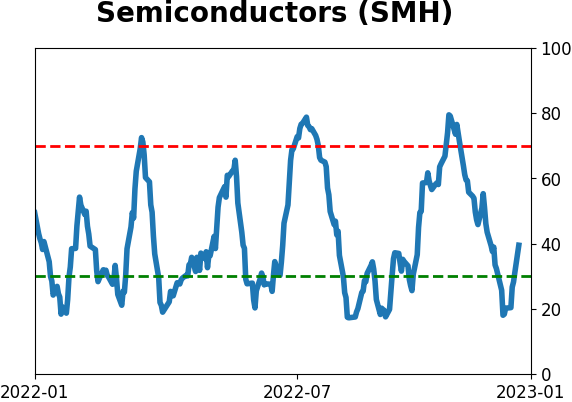
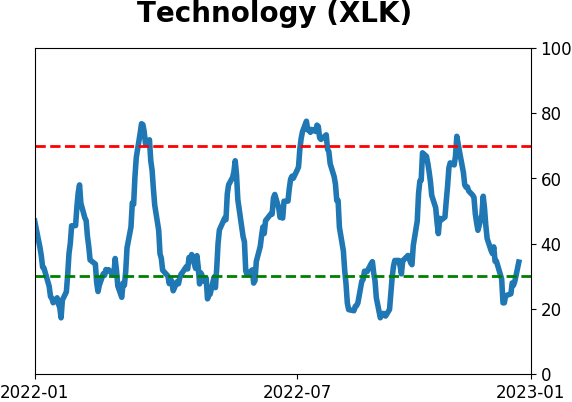
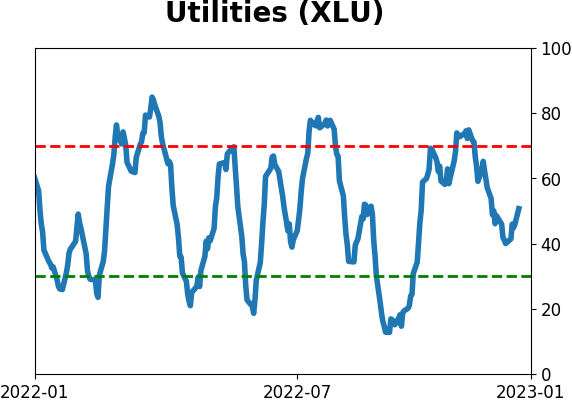
Sector ETF's - 10-Day Moving Average
|
|
|
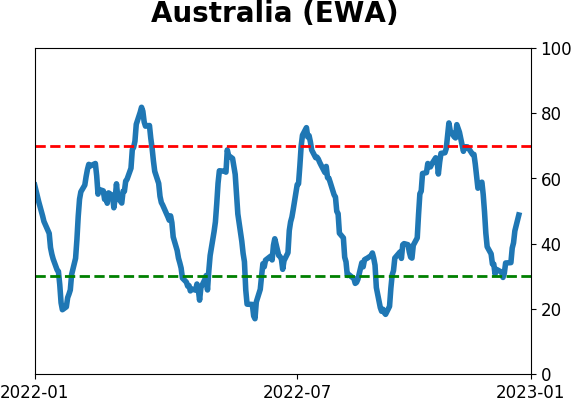
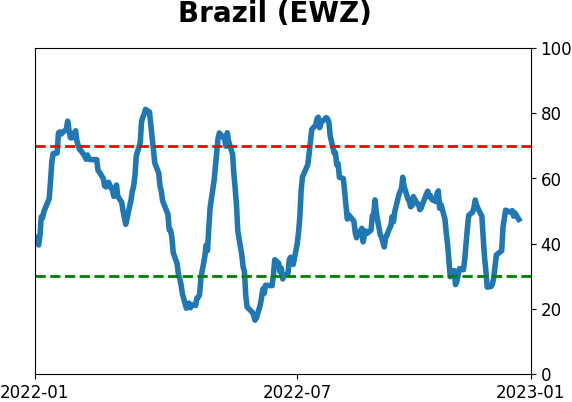
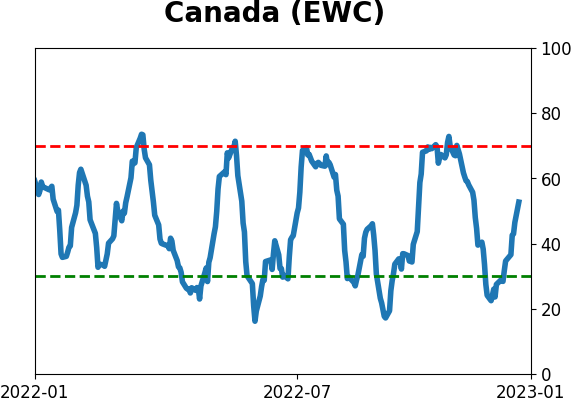
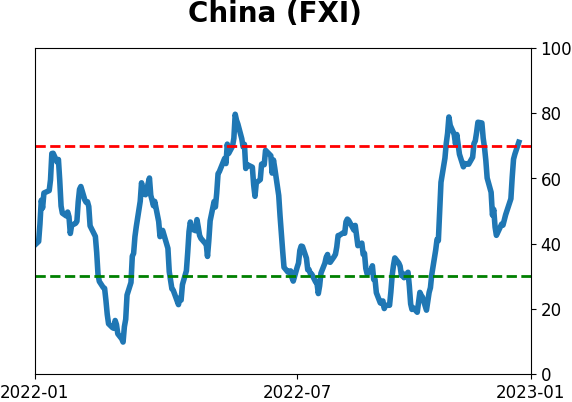
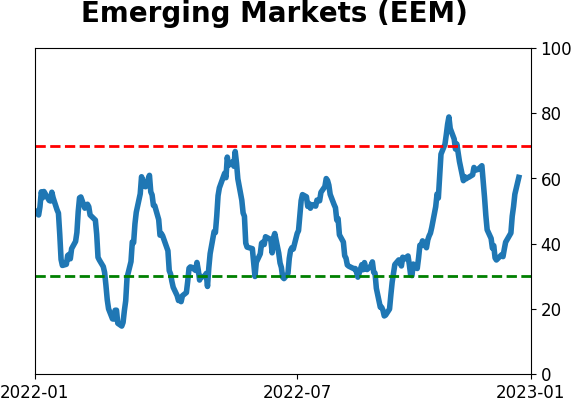
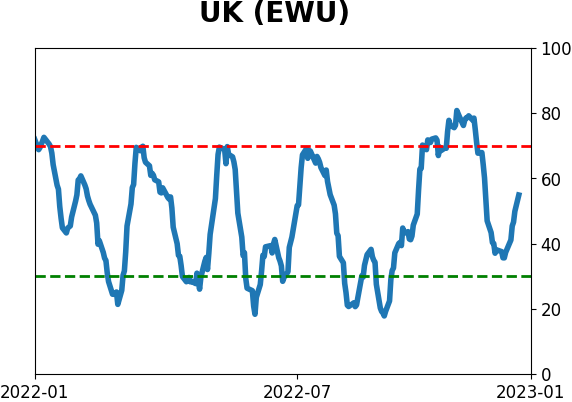
Country ETF's - 10-Day Moving Average
|
|
|
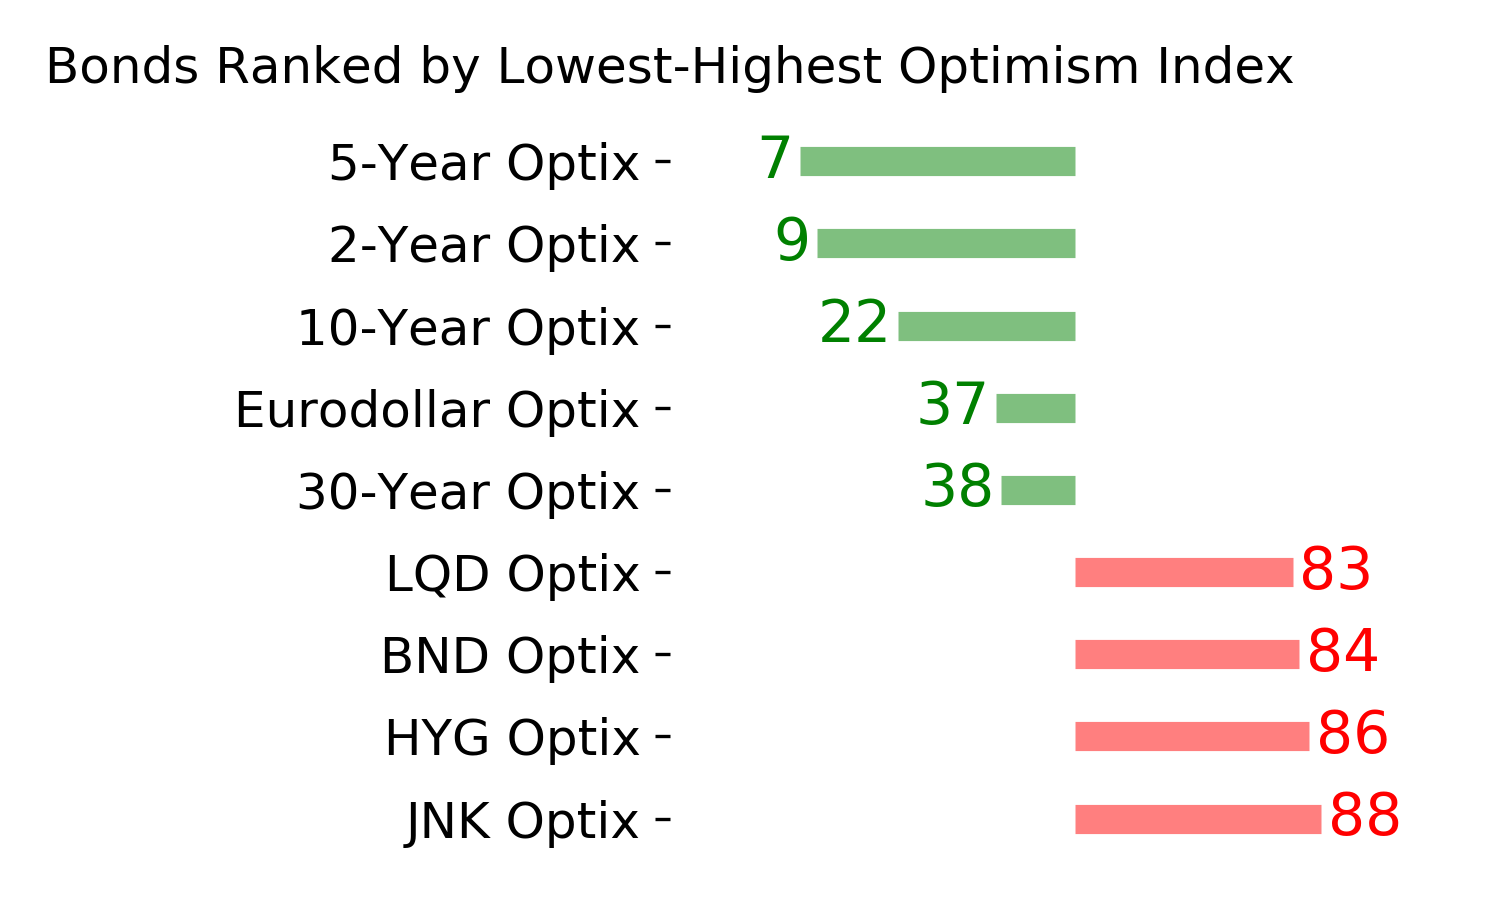
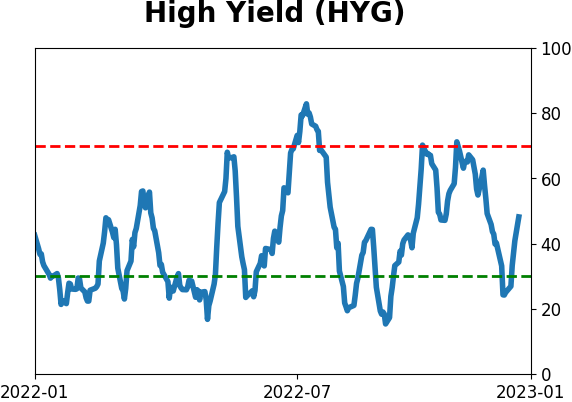
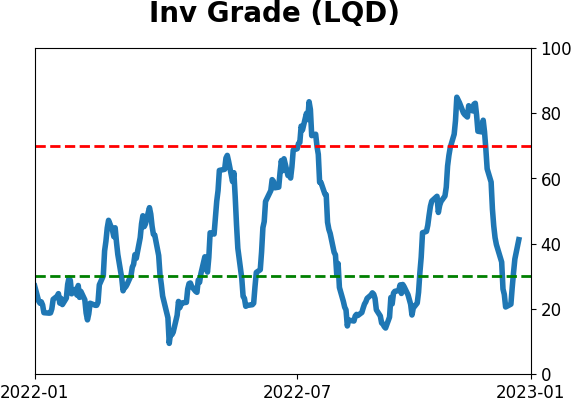
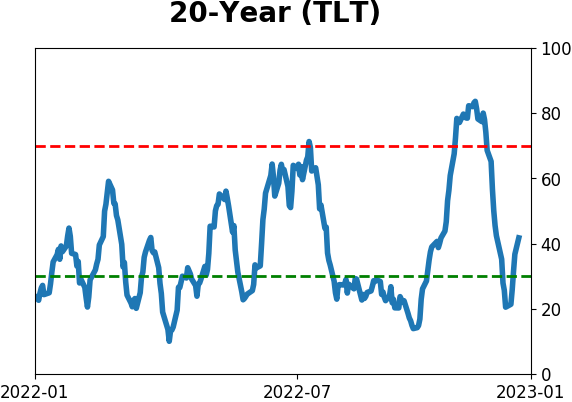
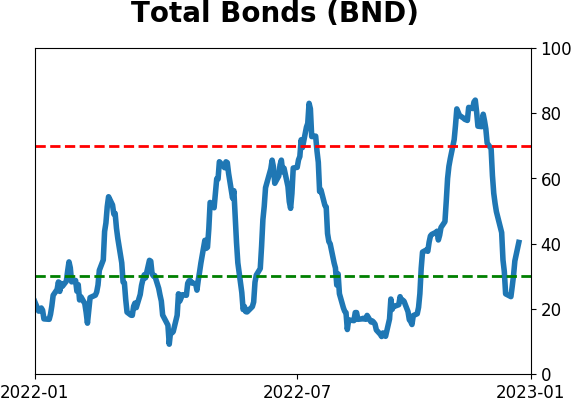
Bond ETF's - 10-Day Moving Average
|
|
|
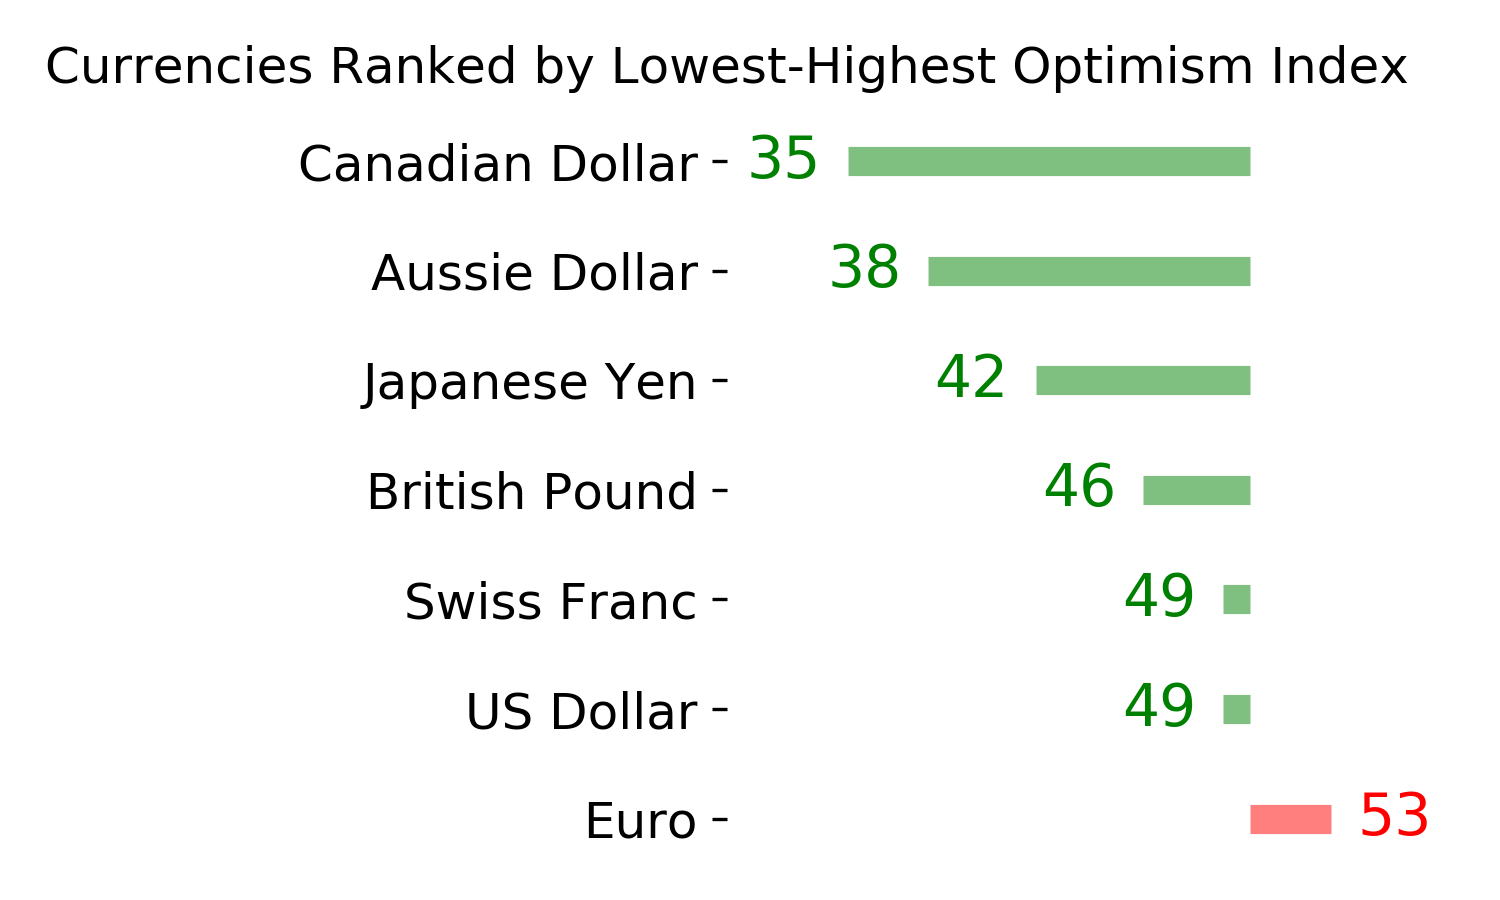
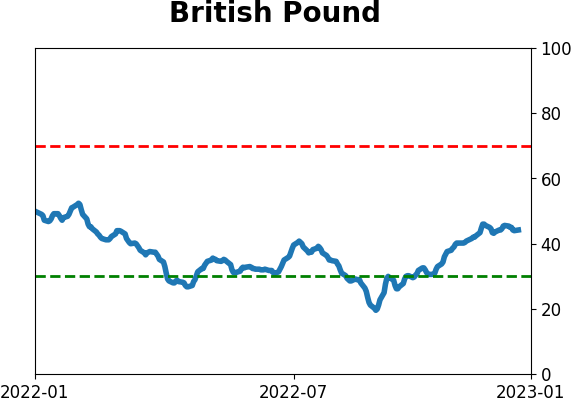
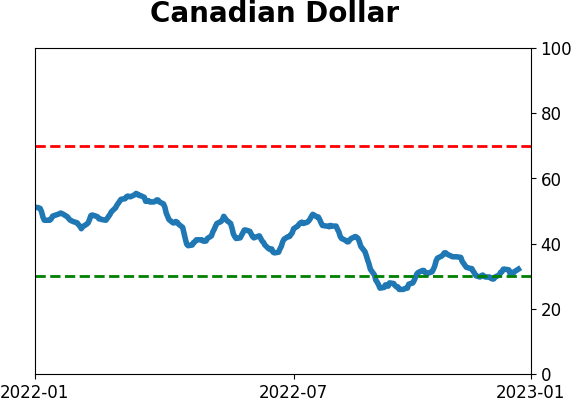
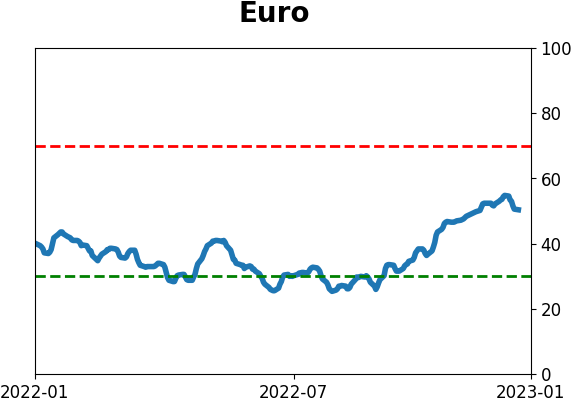
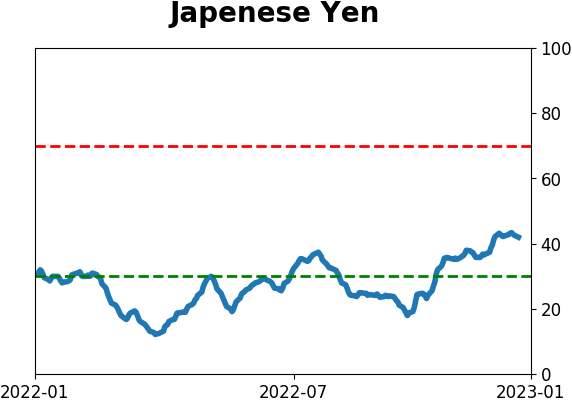
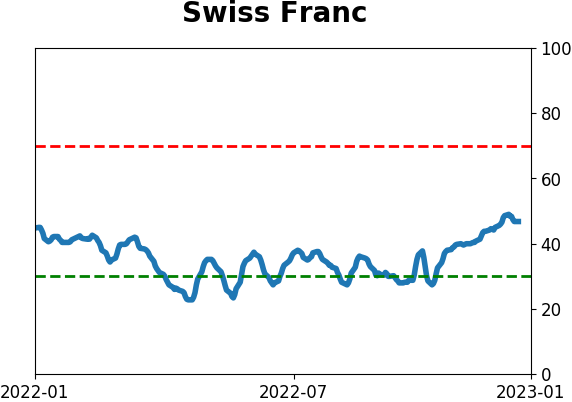
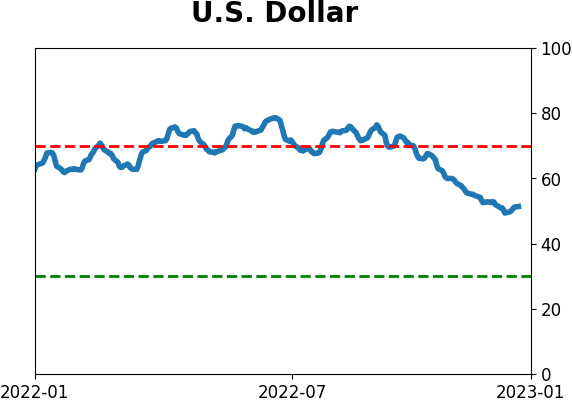
Currency ETF's - 5-Day Moving Average
|
|
|
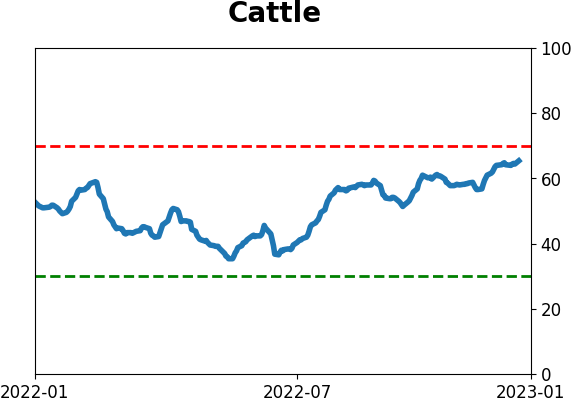
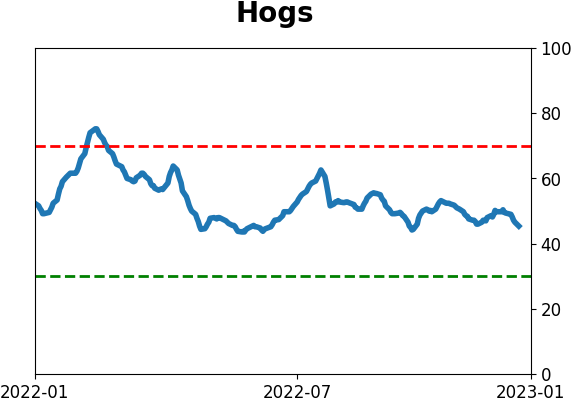
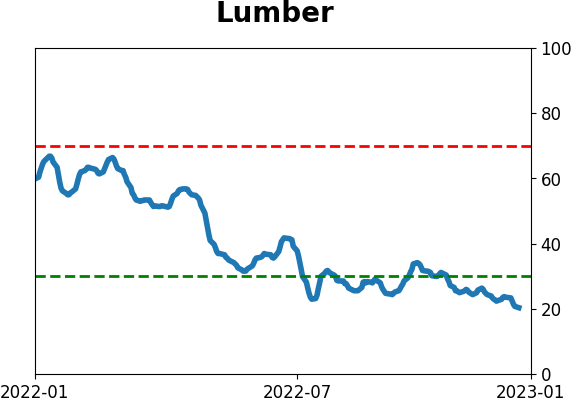
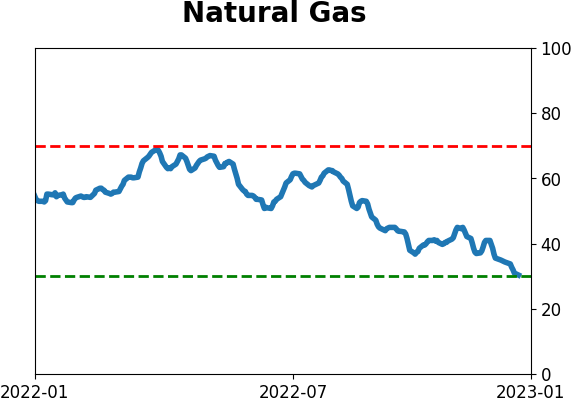
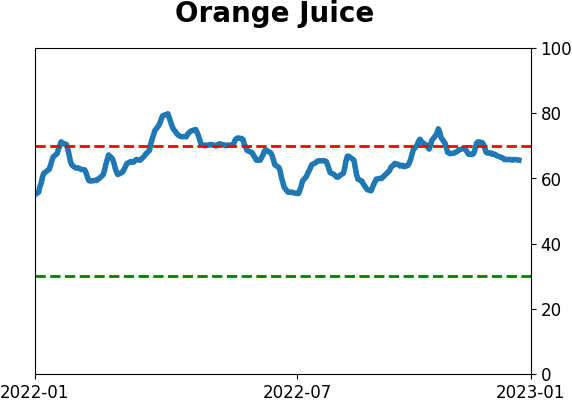
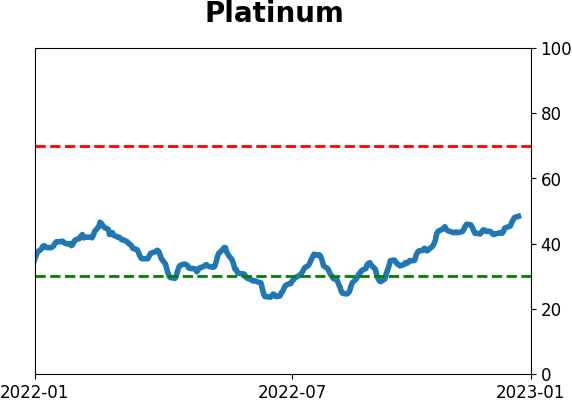
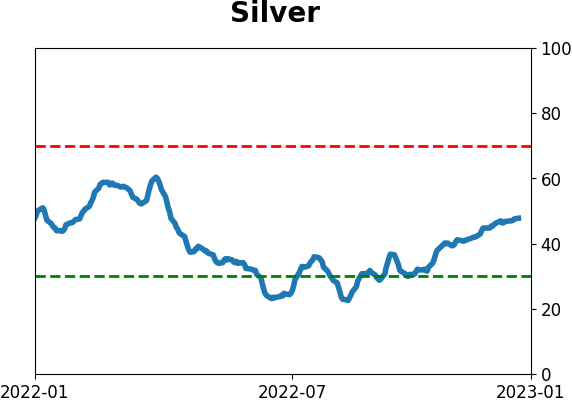
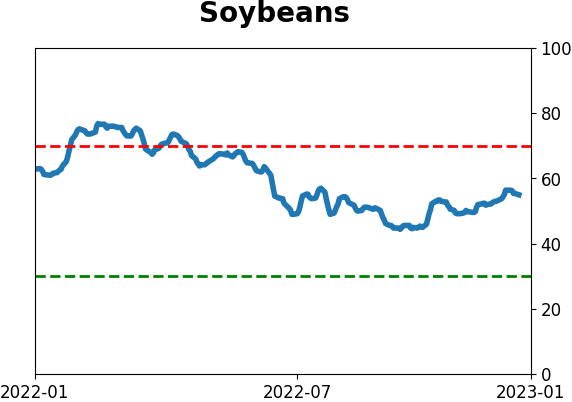
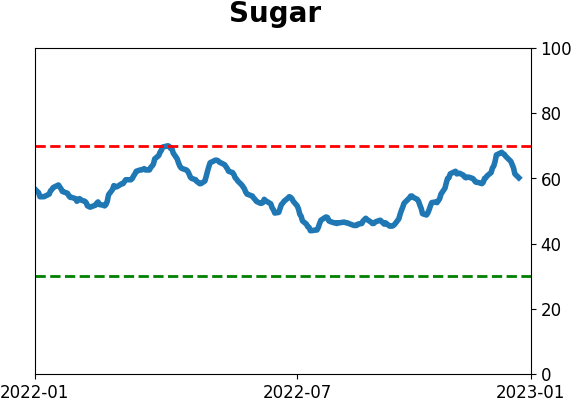
Commodity ETF's - 5-Day Moving Average
|
|