Headlines
|
|
Weekly Wrap for Jan 7 - Breadth thrusts, sentiment reversal, Nasdaq suffering, energy rally:
This week, stocks relaxed following what had been a historic breadth thrust amid impressive short-term participation among S&P 500 stocks. We saw positive reversal signals in equity volatility and sentiment, even though nearly 40% of Nasdaq stocks have been cut in half. Sentiment is weak on the yen, as investors clamor to buy energy stocks.
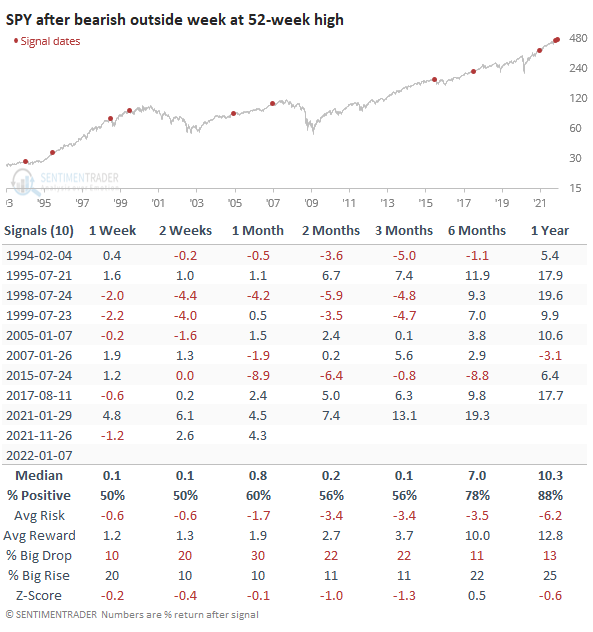
A very "bearish" week: The most important ETF in the world suffered one of its ugliest weeks imaginable. It opened higher than last week, carved out a 52-week high, then closed below last week's low. We've looked at these so-called key reversals many times, across markets and time frames, usually with the conclusion that it's pointless to count on single-bar patterns to predict anything. Same goes for this one - the S&P's forward returns were decent, with no major losses to speak of.
The latest Commitments of Traders report was released, covering positions through Tuesday: The 3-Year Min/Max Screen shows that "smart money" commercial hedgers established only one new multi-year extreme this week, adding to a significant net long position in 5-year Treasury notes. Their only larger position in the 5-year was during mid-2018 before a big rally in the note. It's not a precise timing mechanism, though. The Backtest Engine shows that over the past 20 years, the 5-year note rallied only 36% of the time in the few months following any week when hedgers held more than 17.5% of open interest net long. Hedgers have started to increase their position in the VIX. When coming from a relatively low exposure level, that has tended to precede a lower VIX (lower volatility) in the weeks and months ahead. They continue to hold near-record long positions in the "p" metals, platinum and palladium. That's generally a good sign for their prospects in the months ahead.
|
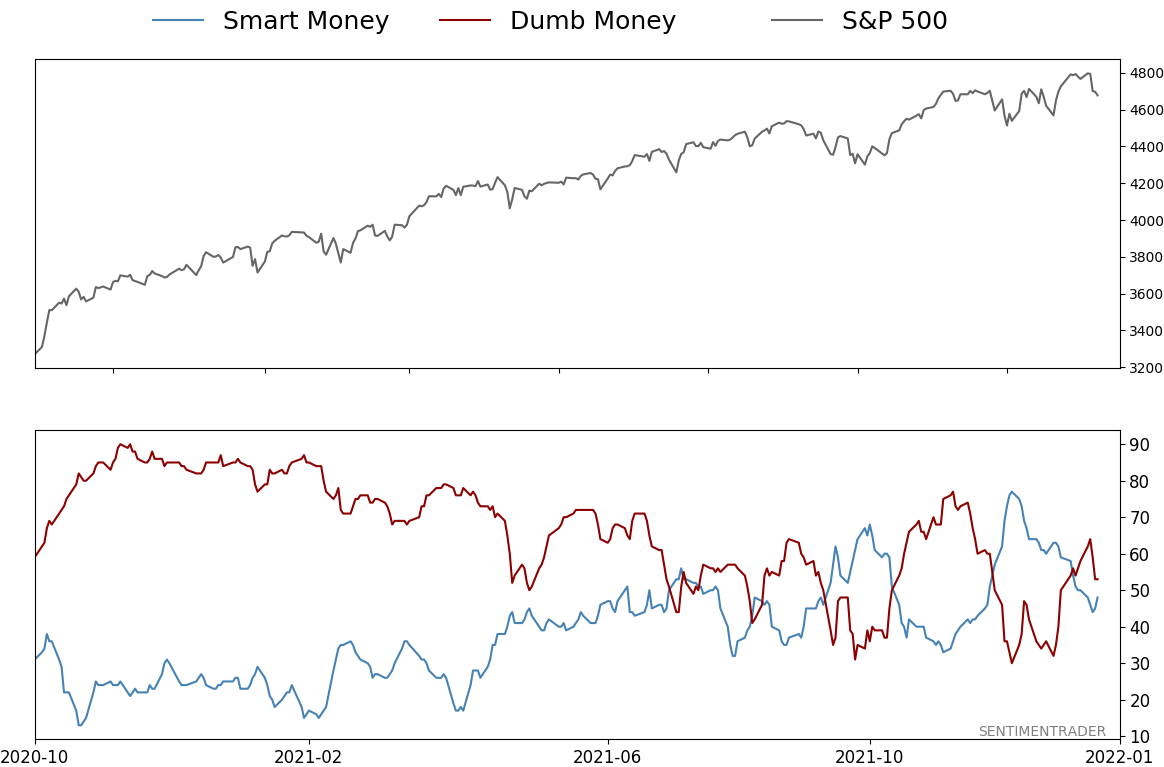
Smart / Dumb Money Confidence
|
Smart Money Confidence: 48%
Dumb Money Confidence: 53%
|
|
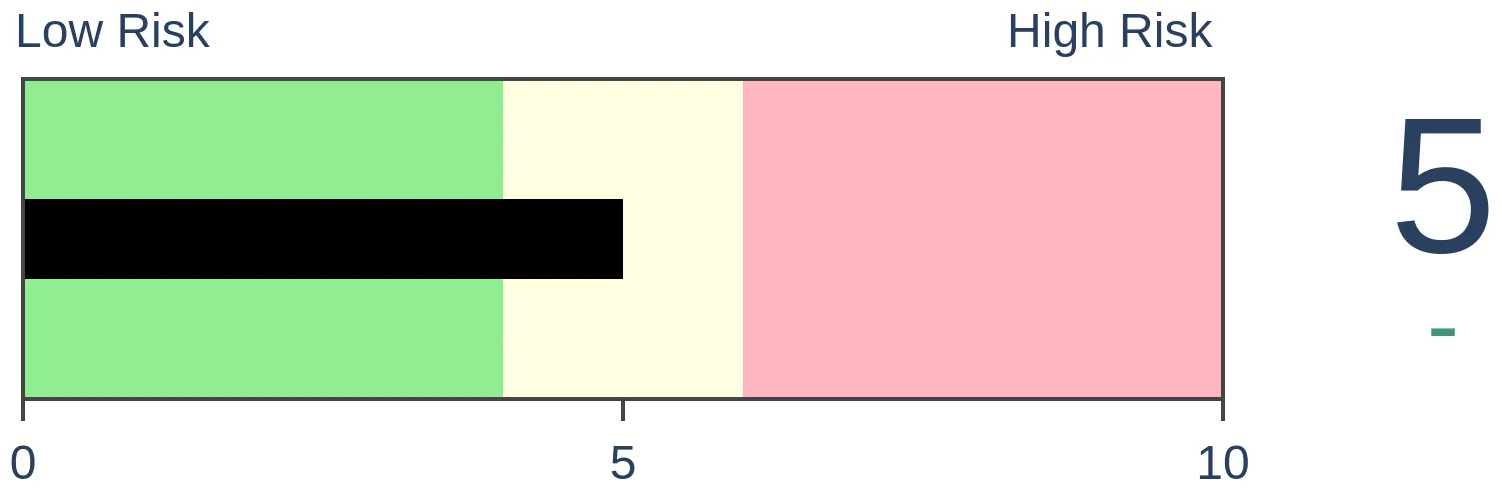
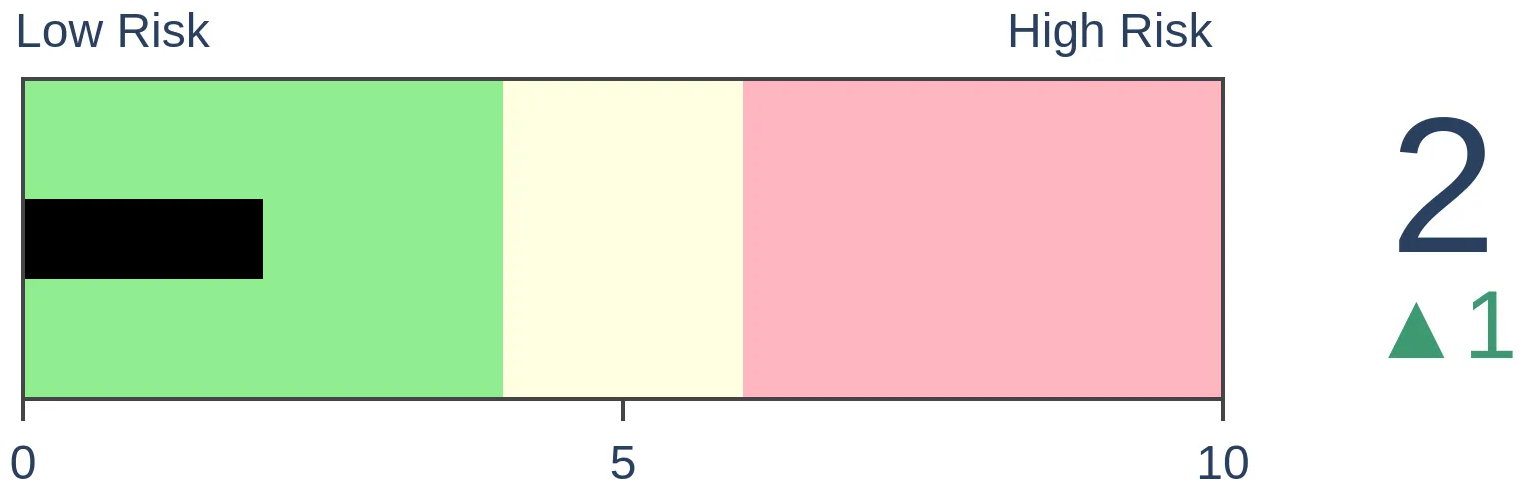
Risk Levels
Stocks Short-Term
|
Stocks Medium-Term
|
|
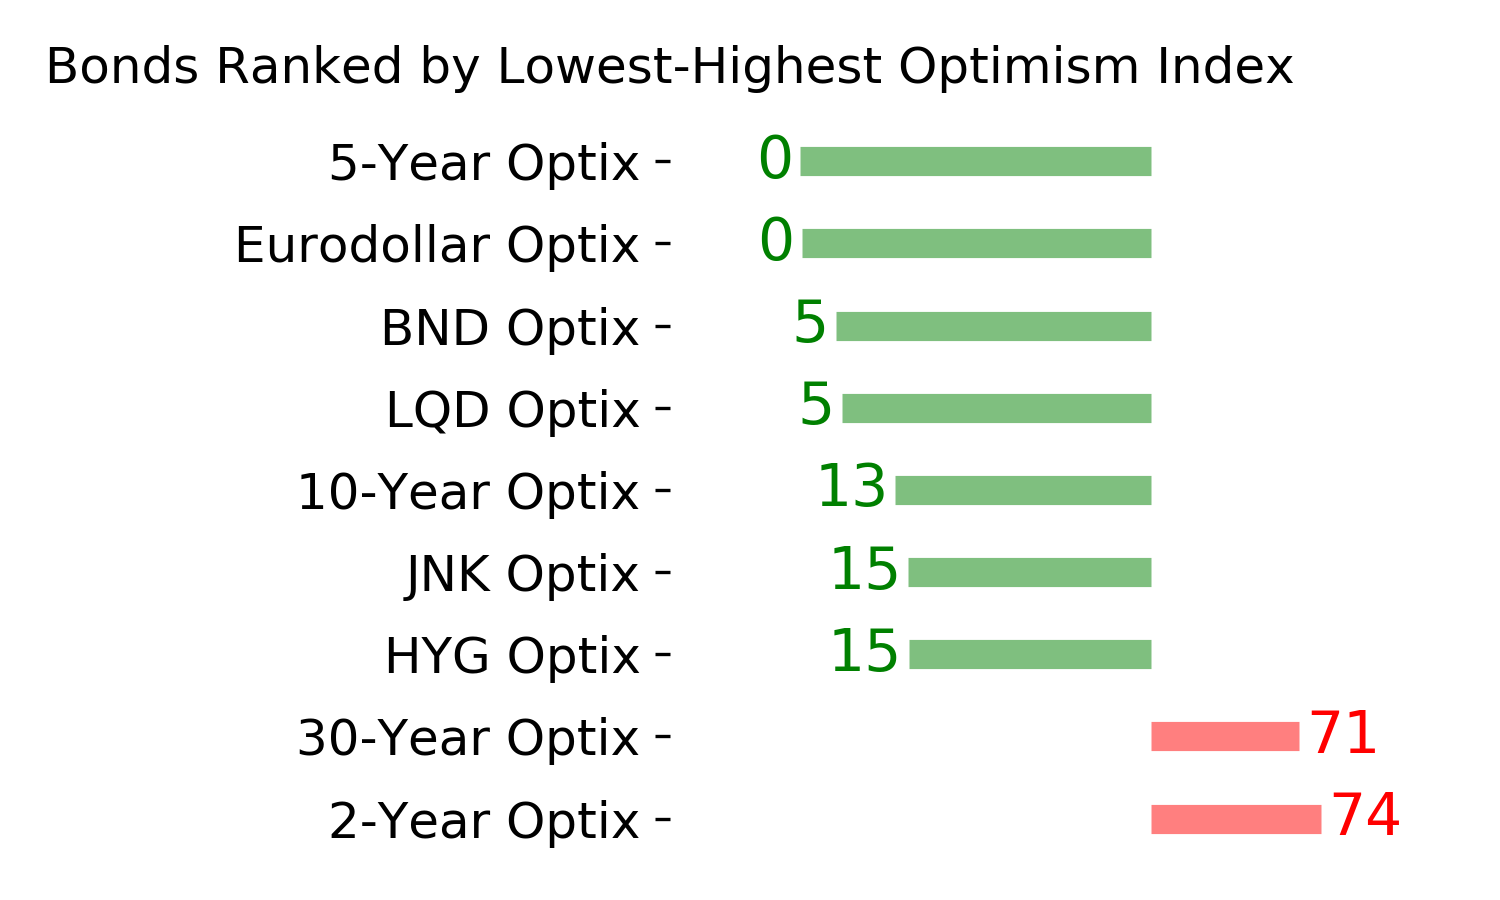
Bonds
|
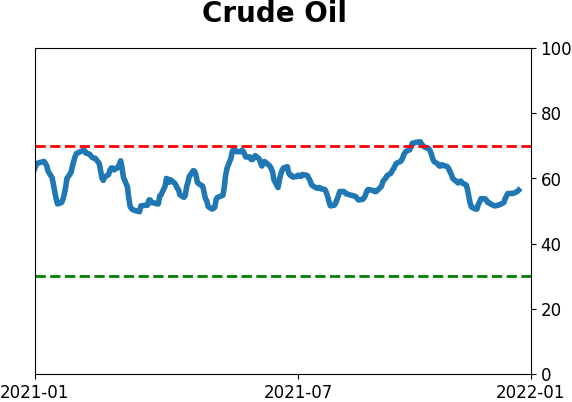
Crude Oil

|
|
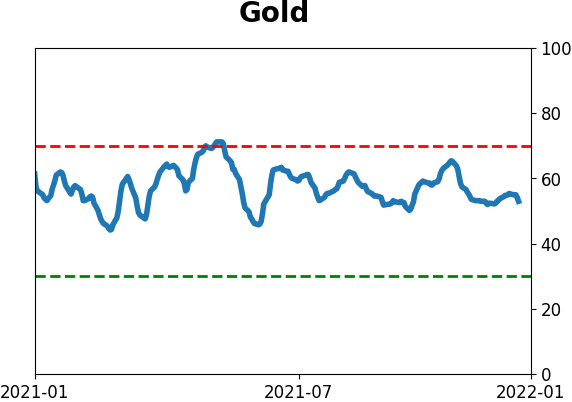
Gold

|
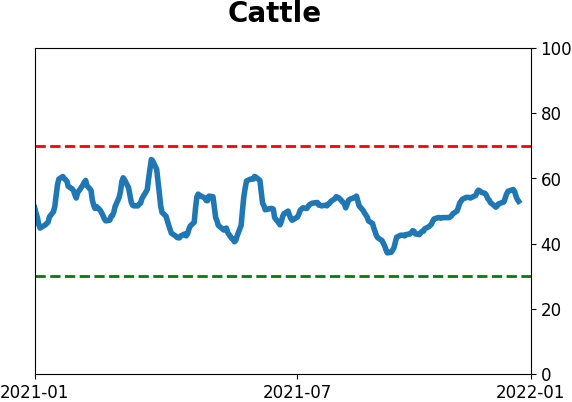
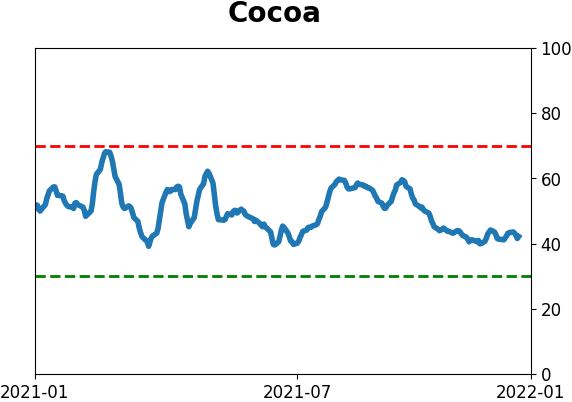
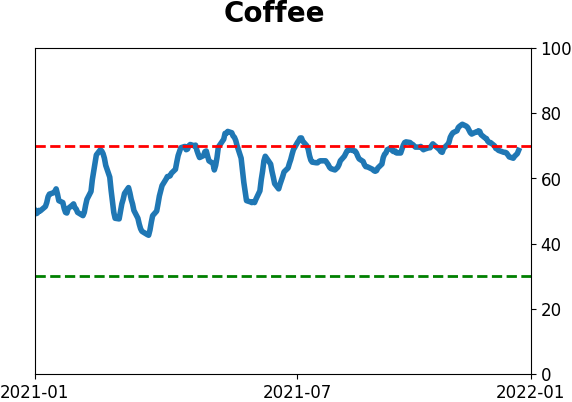
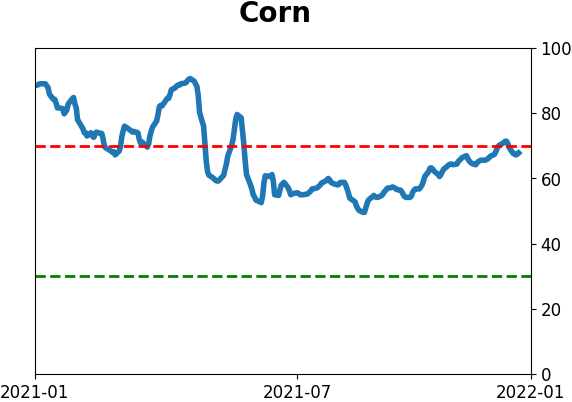
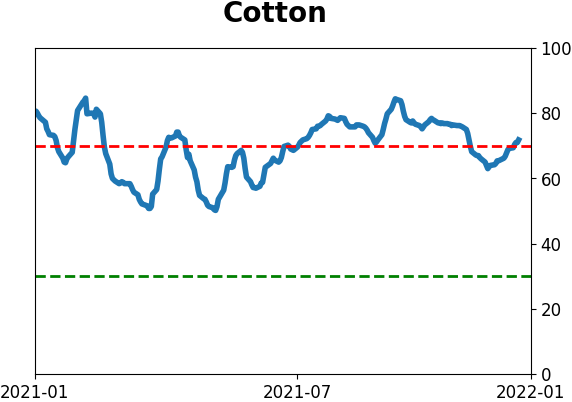
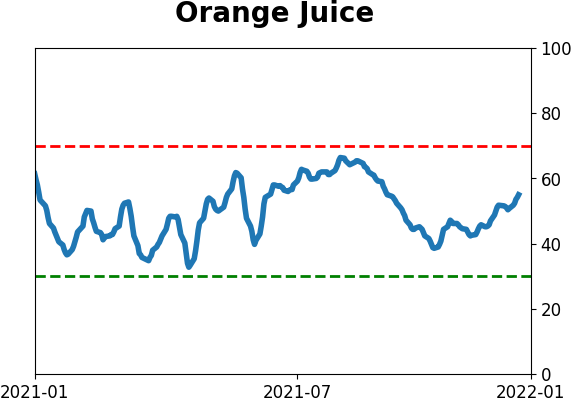
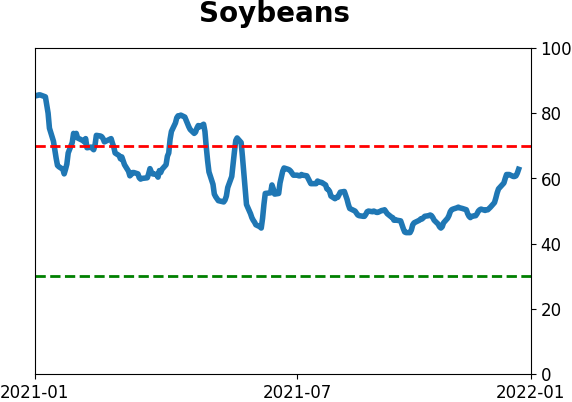
Agriculture

|
|
Research
By Jason Goepfert
BOTTOM LINE
This week, stocks relaxed following what had been a historic breadth thrust amid impressive short-term participation among S&P 500 stocks. We saw positive reversal signals in equity volatility and sentiment, even though nearly 40% of Nasdaq stocks have been cut in half. Sentiment is weak on the yen, as investors clamor to buy energy stocks.
FORECAST / TIMEFRAME
None
|
Key points:
- In recent weeks, there was a historic thrust in short-term participation among S&P 500 stocks
- That coincided with an impressive breadth thrust
- Volatility subsided, allowing sentiment to trigger a positive reversal
- Sentiment improved even though nearly 40% of Nasdaq stocks have been cut in half
- The yen is suffering from deep pessimism, but that's not enough reason for a rebound
- Energy stocks have enjoyed a historic bounce
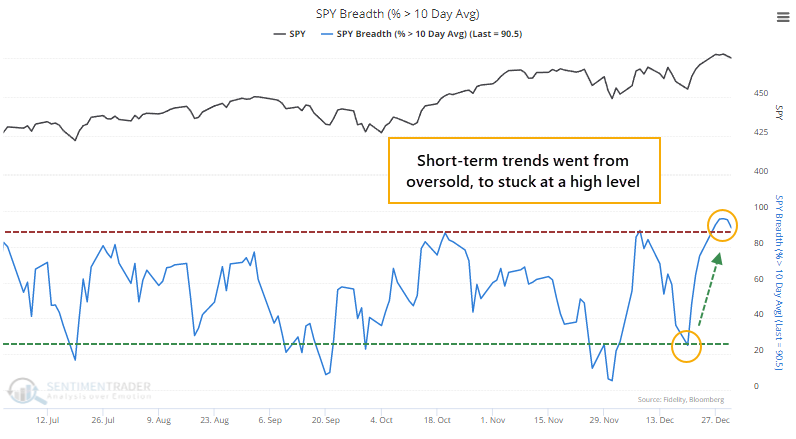
A whole week of broad short-term participation
In early December, buying interest across stocks was broad and urgent. More than 80% of volume on the NYSE flowed into advancing securities, triggering a rare breadth thrust.
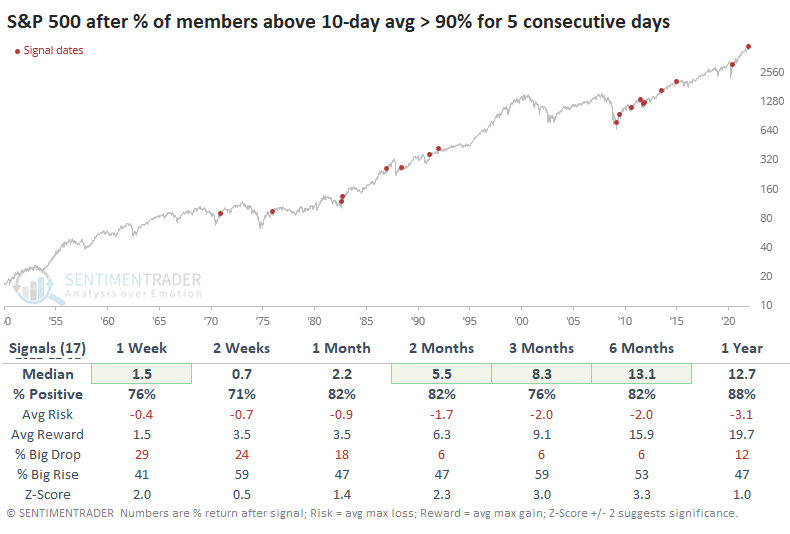
Within the most benchmarked index in the world, buying interest has been just as impressive. The percentage of S&P 500 member stocks trading above their 10-day moving averages cycled from only 25% on December 20 to more than 90% by last week.
The Backtest Engine shows that since 1998, the S&P 500 performed well after more than 90% of its stocks traded above their 10-day averages, preceding a positive one-year return after 187 out of 193 signals.
When these short-term trends cycled from below 25% (rounded) to above 90% on consecutive days, the S&P never lost ground over the next 6 months.
But it's even more impressive than that. By December 27, more than 90% of stocks were trading above their 10-day averages, and it hasn't dropped below 90% since then. This 5-day streak is tied for the 4th-longest since 1950.
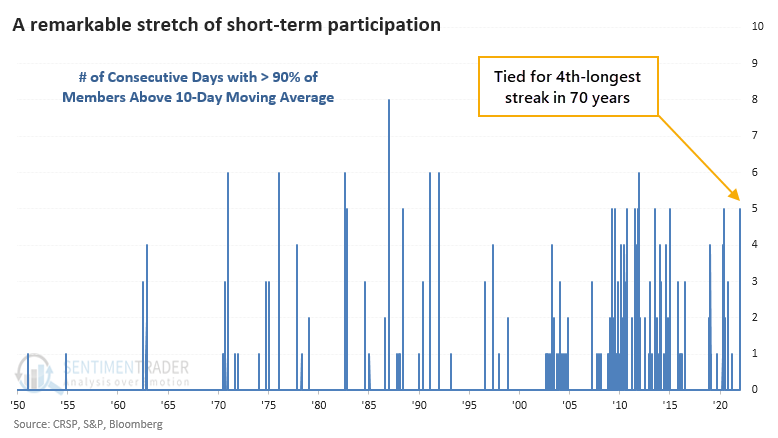
After other times when the S&P went 5 straight days with more than 90% of its members above their 10-day averages, the index continued to gain in the months ahead with few (and temporary) exceptions.
Looking at longer-term breadth metrics for the S&P 500, most of them are in the not-too-hot-not-too-cold zone. About 70% of stocks are trading above their 50-day averages, which since 1928 has given an annualized return of 10.3%.
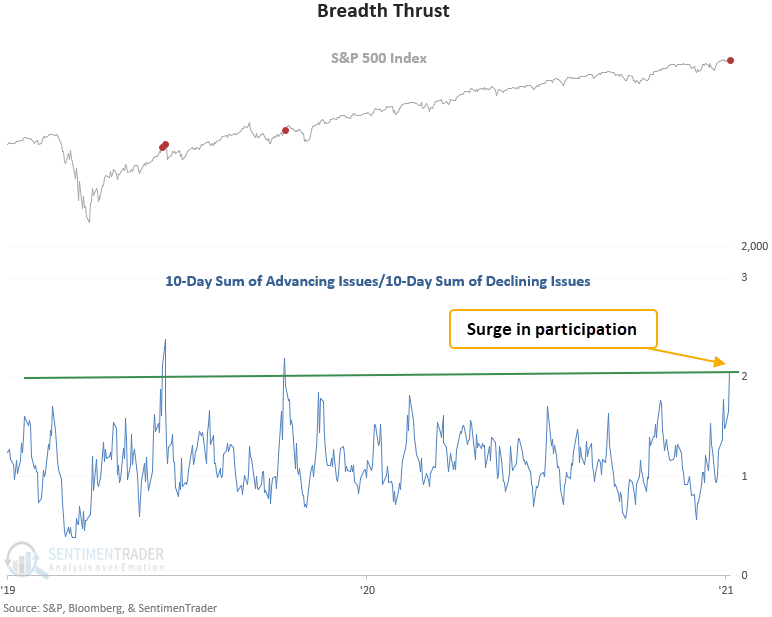
Broad participation led to a compelling breadth thrust
A new signal from a voting member in Dean's composite thrust model registered an alert on Tuesday.
The breadth thrust system identifies when the 10-day sum of S&P 500 advancing issues exceeds the 10-day sum of S&P 500 declining issues by a ratio of 2.02 to 1. I use a reset condition to screen out repeats, which requires the ratio to fall below 0.8 before a new signal can trigger again.
This signal has triggered 56 other times over the past 90 years. After the others, future returns, win rates, and risk/reward profiles were solid across all time frames. Since 1942, the win rate in the 12-month time frame has been excellent, with 44 out of 48 winners. And, the max drawdown was minimal, with a decline of 6.4%.
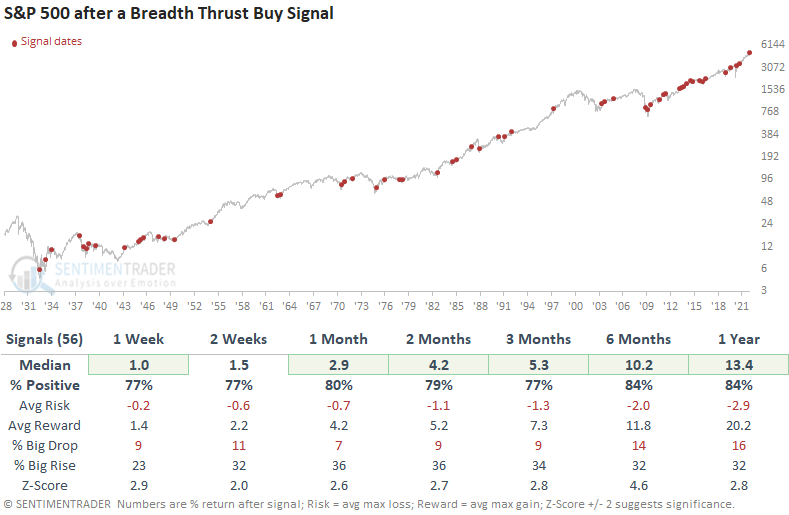
Returns were even better when the signal triggered when the S&P 500 was within 10% of a peak
Broad-based buying coincided with a drop in volatility
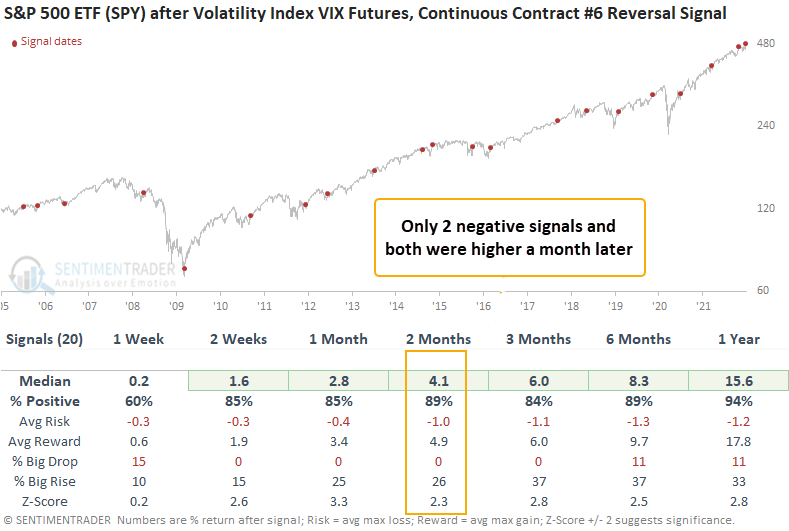
Dean noted that a trading model that uses VIX futures to identify when volatility cycles from high to low issued a buy signal at the close of trading on Wednesday.
The VIX Futures Range Rank signal triggers when the 4-month range rank for the VIX Futures Continuous Contract #6 reverses from a period of high volatility to low volatility. I use the 6-month continuous contract versus shorter duration contracts as the middle of the futures curve provides slightly better trading results.
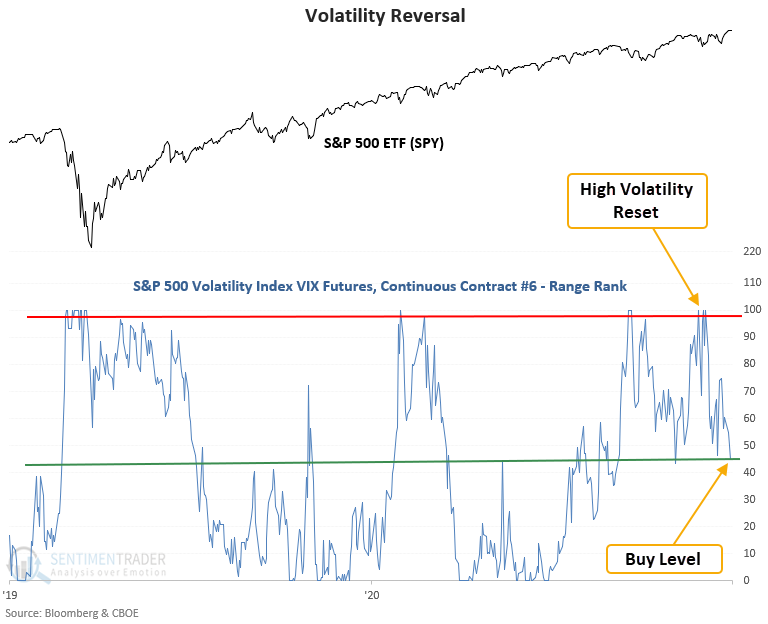
This signal has triggered 20 other times over the past 16 years. After the others, SPY's future returns, win rates, and risk/reward profiles were solid in 6 out of 7 periods. The most recent signal from November stumbled out of the gate. However, it has now recovered to show a gain of 2.75% through the first 38 sessions.
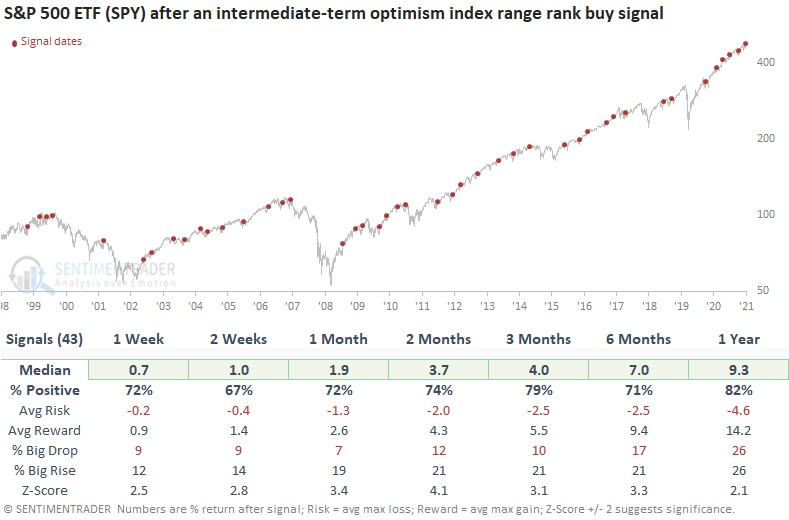
A drop in volatility allowed sentiment to become more optimistic
Dean also noted that a trading model that uses the Intermediate Term Optimism Index (Optix) to identify when sentiment reverses from a period of pessimism issued a buy signal last week.
The range rank indicator measures the current value relative to all other values over the last 2 months. The pessimistic reset condition is confirmed when the range rank for the Optix Index crosses below the 5th percentile. A new buy signal occurs when the range rank crosses back above the 55th percentile as long as market momentum is positive.
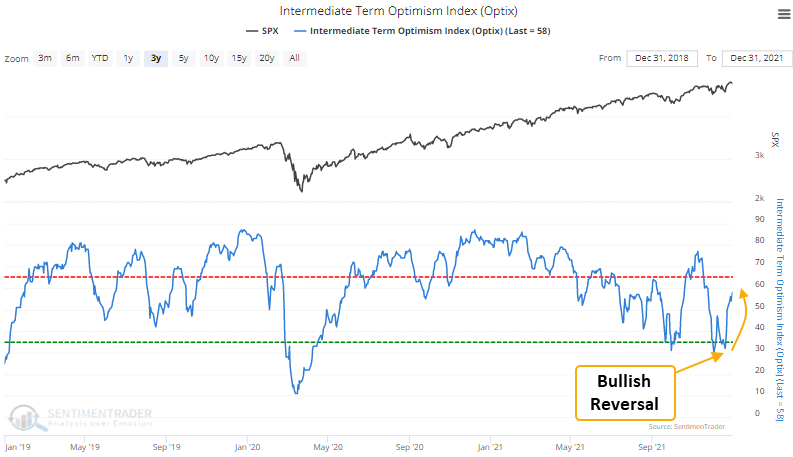
When the S&P 500 was trading above its 200-day moving average, the signal triggered 43 other times over the past 23 years. After the others, SPY's future returns, win rates, and risk/reward profiles were solid across all time frames.
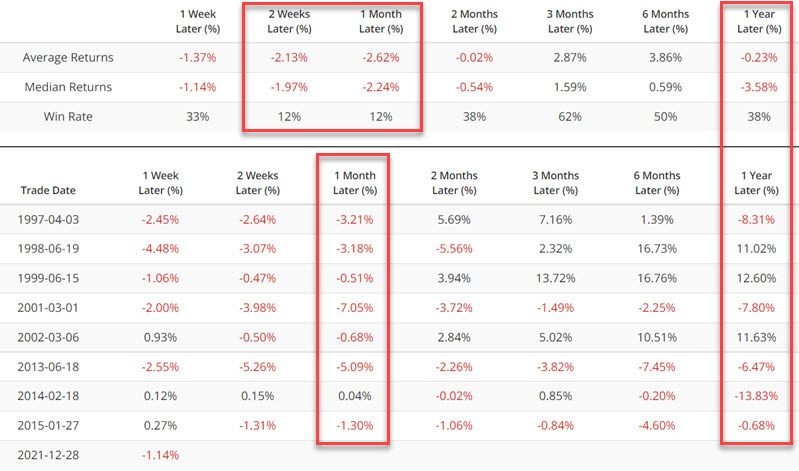
Sentiment improved even with a massive shock in Nasdaq stocks
Valuations are at historical highs, companies are raising billions based on fairy dust, and the Fed is signaling a tightening cycle. All of these are scaring investors that we're on the cusp of a repeat of 1999-2000.
After Wednesday's post-FOMC selloff, more than 38% of stocks trading on the Nasdaq are now down 50% from their 52-week highs. Only 13% of days since 1999 have seen more stocks cut in half.
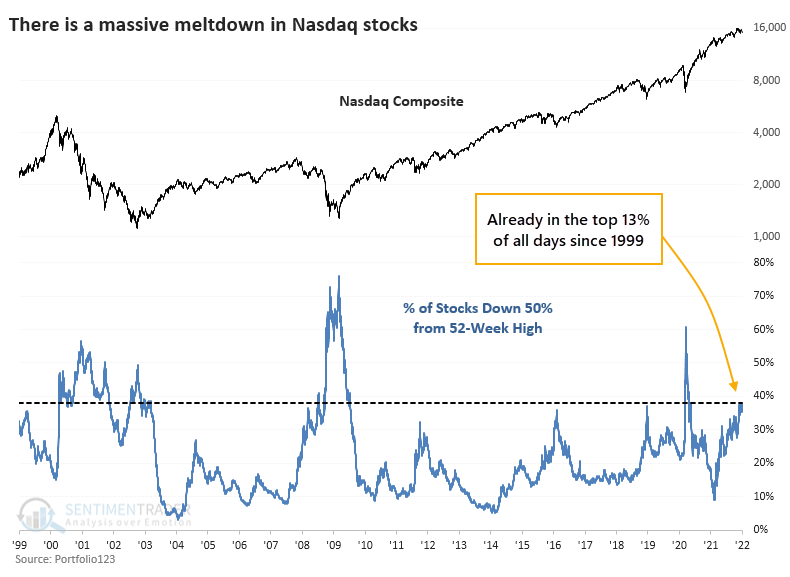
Bulls will suggest that most of the damage has been done, and the indexes should be able to soar from here. Bears will say this is just like the internet bubble, and the index is about to "catch down" to the average stock.
To get a sense of who may most likely be correct, the table below shows dates when the percentage of stocks cut in half cycles from a low level to above 35%. The index bounced around for a couple of months, with losses leading to gains and vice-versa, except for March 2020, which was near the pandemic low but it also triggered near the bottoms of several medium-term lows in the past decade.
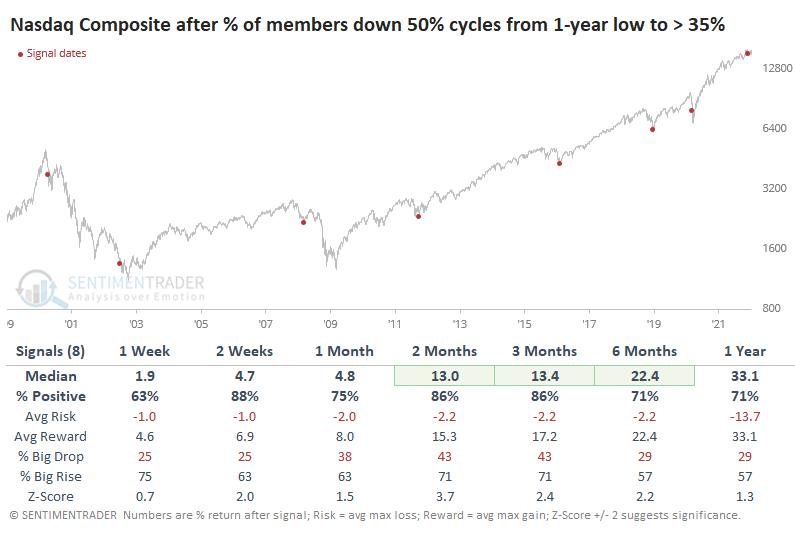
There are few, if any, precedents to the kind of activity we're seeing right now on the Nasdaq. There are some signs that it's equivalent to early 1999, right before a massive blow-off rally. And it's also somewhat similar to the behavior right after that peak.
There is a solid argument to be made that so many stocks have been hit so hard that the Nasdaq Composite shouldn't suffer too much more before being able to rally again. The most significant caveat, and it's a major one, is that there is the potential that we're also seeing behavior reminiscent of the 1999 and 2007 peaks.
Great quarter, guys
Jay showed that there have been 56 quarters that have seen the S&P 500 Index gain +9% or more in price since 1933. Forty-seven of those quarters were followed by another up quarter. Only nine times did the S&P 500 decline over the next quarter.
The chart below displays the quarterly performance for the S&P 500 following quarters of +9% or more.
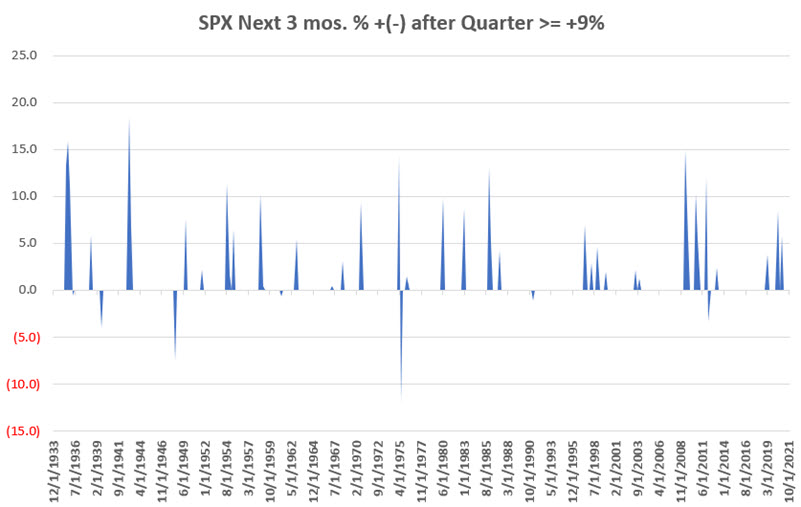
Traders should not assume that the first quarter of 2022 is sure to show a gain for the S&P 500 Index. An 84% success rate is a powerful indication, but it does not guarantee success. Still, the latest signal suggests that as long as price action holds up, investors should continue to give the bullish case the benefit of the doubt.
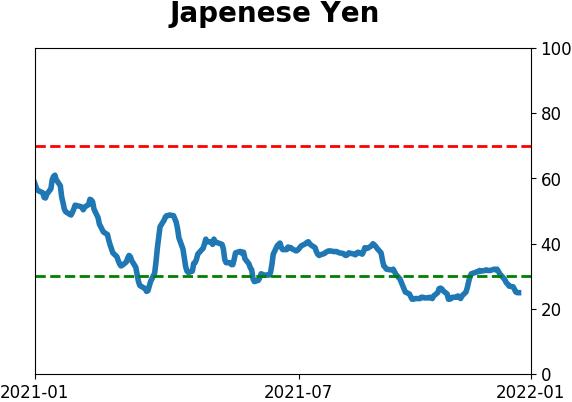
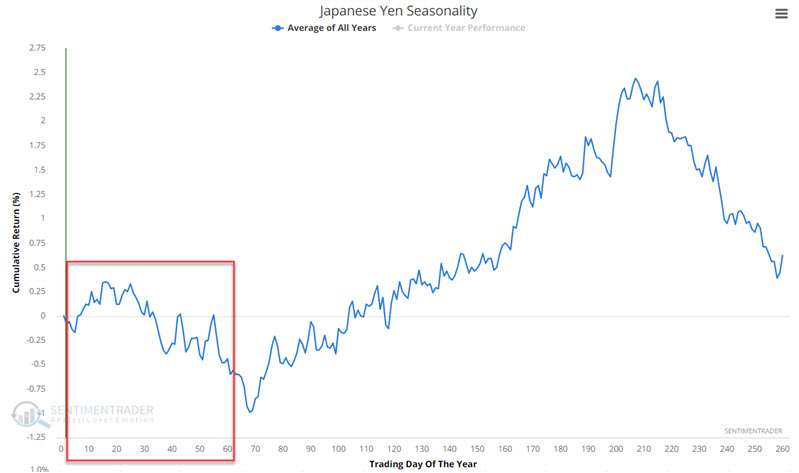
No yen for the yen
Jay looked at seasonality and sentiment in the Japanese Yen.
The chart below displays the Annual Seasonal Trend for the Japanese Yen. As you can see, the action in the first quarter of the year tends to be choppy and entirely lacking in trend. This creates a challenging trading environment for bulls and bears.
For most markets, a persistently low level of Optix tends to be bullish for that market. The Yen is an exception to the rule. The chart below displays those instances when the 50-day average for Yen Optix crossed above 27.
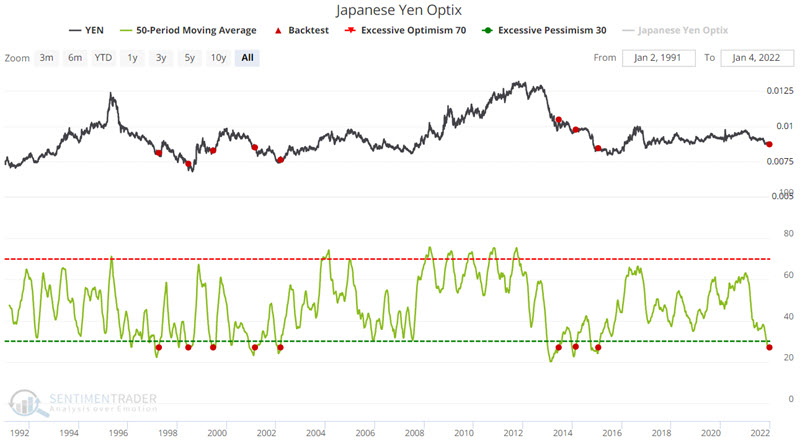
Typically, we would expect to see positive results following a low-level reversal. But the Yen is an exception to this rule.
Extending the gold miner rally window
Jay considered the standard Santa Claus Miner Rally period during post-election years and extend the holding period through the close of January Trading Day of Month #11 in the mid-term election year.
In other words:
- Buy gold miners at the close of Trading Day #11 of the post-election year
- Sell gold miners at the close of Trading Day #11 of the mid-term election year
For this cycle, the favorable period:
- Began at the close on 12/15/2021
- End at the close on 1/18/2022
The chart below displays HUI performance over this extended period every four years. Out of 16 signals, 14 showed a profit.
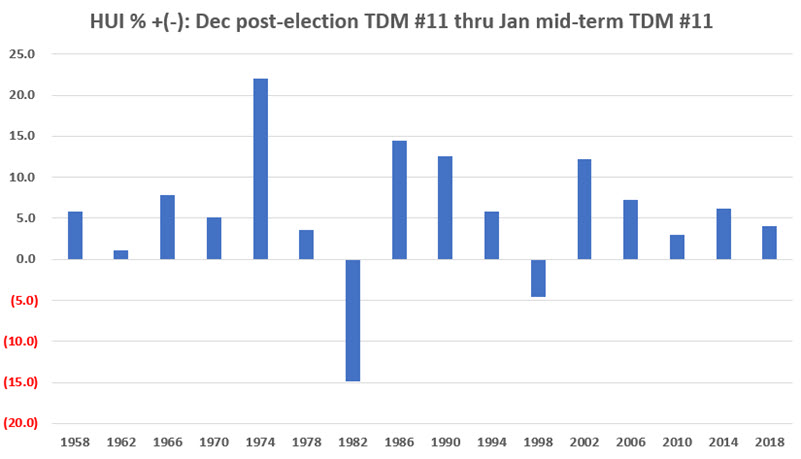
If history proves an accurate guide, the rally in gold miners that started on 12/16 may extend through 1/18/2022. Nevertheless, traders must recognize the speculative nature of trading gold mining stocks and remember that significant loss is possible.
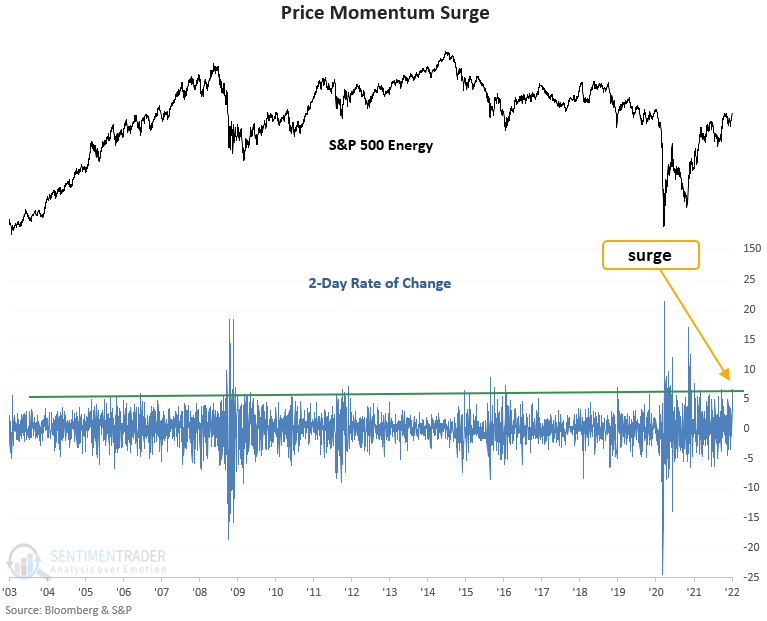
Impressive energy
Dean highlighted the fact that the S&P 500 energy sector has risen by 6.66% over the previous 2 trading sessions. This is the best start to a new year for energy stocks in history.
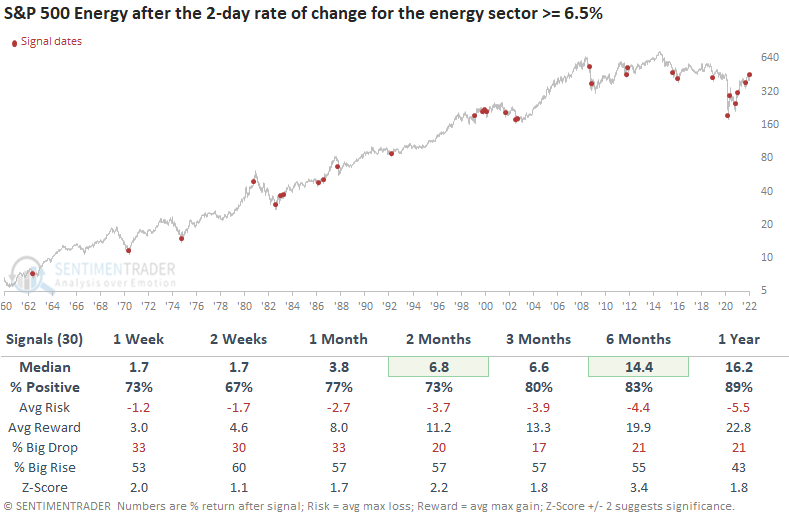
Let's conduct a study to assess the outlook for the sector when the 2-day rate of change increases by 6.5%. I will screen out repeats by only including the first occurrence in the previous 2 months, which is the case now.
This signal has triggered 30 other times over the past 60 years. After the others, energy sector future returns, win rates, and risk/reward profiles were solid across all time frames, especially the 6-month window. A year later, the energy sector was higher 89% of the time. And, the drawdowns in that time frame were all associated with recession/bear market environments.
Most instances occurred after a significant correction or bear market phase. That condition provided a solid backdrop for future returns.
About the Weekly Wrap...
The goal of the Weekly Wrap is to summarize our recent research. Some of it includes premium content (underlined links), but we're highlighting the key focus of the research for all. Sometimes there is a lot to digest, with this summary meant to highlight the highest conviction ideas we discussed. Tags will show any symbols and time frames related to the research.
Active Studies
| Time Frame | Bullish | Bearish | | Short-Term | 2 | 0 | | Medium-Term | 13 | 2 | | Long-Term | 12 | 4 |
|
Indicators at Extremes
Portfolio
| Position | Description | Weight % | Added / Reduced | Date | | Stocks | RSP | 35.9 | Added 25.2% | 2022-01-03 | | Bonds | 32.7% BND, 7.1% SCHP | 39.8 | Added 8.3% | 2021-10-26 | | Commodities | GCC | 2.4 | Reduced 2.1%
| 2020-09-04 | | Precious Metals | GDX | 4.6 | Reduced 4.2% | 2021-05-19 | | Special Situations | 9.8% KWEB, 4.7% XLE, 2.9% PSCE | 17.3 | Added 9.78% | 2021-10-01 | | Cash | | 0.1 | | |
|
Updates (Changes made today are underlined)
Coinciding with the new year, there was a thrust in participation in the S&P 500 near the end of December. Thrusts have been among the most consistent signals over the decades, and this is hard to ignore. I have greater confidence in thrusts when coming off extreme pessimism, like the spring of 2020, as opposed to near all-time highs on low volume. Still, it's hard to justify not being at least neutral weight stocks given this behavior. Bond sentiment is trying to recover from a recent bout of pessimism, and gold stocks are doing their thing which is not much at all. They've been flat for six months. Chinese tech stocks were doing exactly what they're supposed to do, then did *not* by plunging to new lows. This is troubling on a shorter-term time frame, but this was never meant for a trade, rather a multi-year investment. Recent behavior is troubling and I will not be adding any exposure as long as that's the case. RETURN YTD: -0.3% 2021: +8.7%, 2020: +8.1%, 2019: +12.6%, 2018: +0.6%, 2017: +3.8%, 2016: +17.1%, 2015: +9.2%, 2014: +14.5%, 2013: +2.2%, 2012: +10.8%, 2011: +16.5%, 2010: +15.3%, 2009: +23.9%, 2008: +16.2%, 2007: +7.8%
|
|
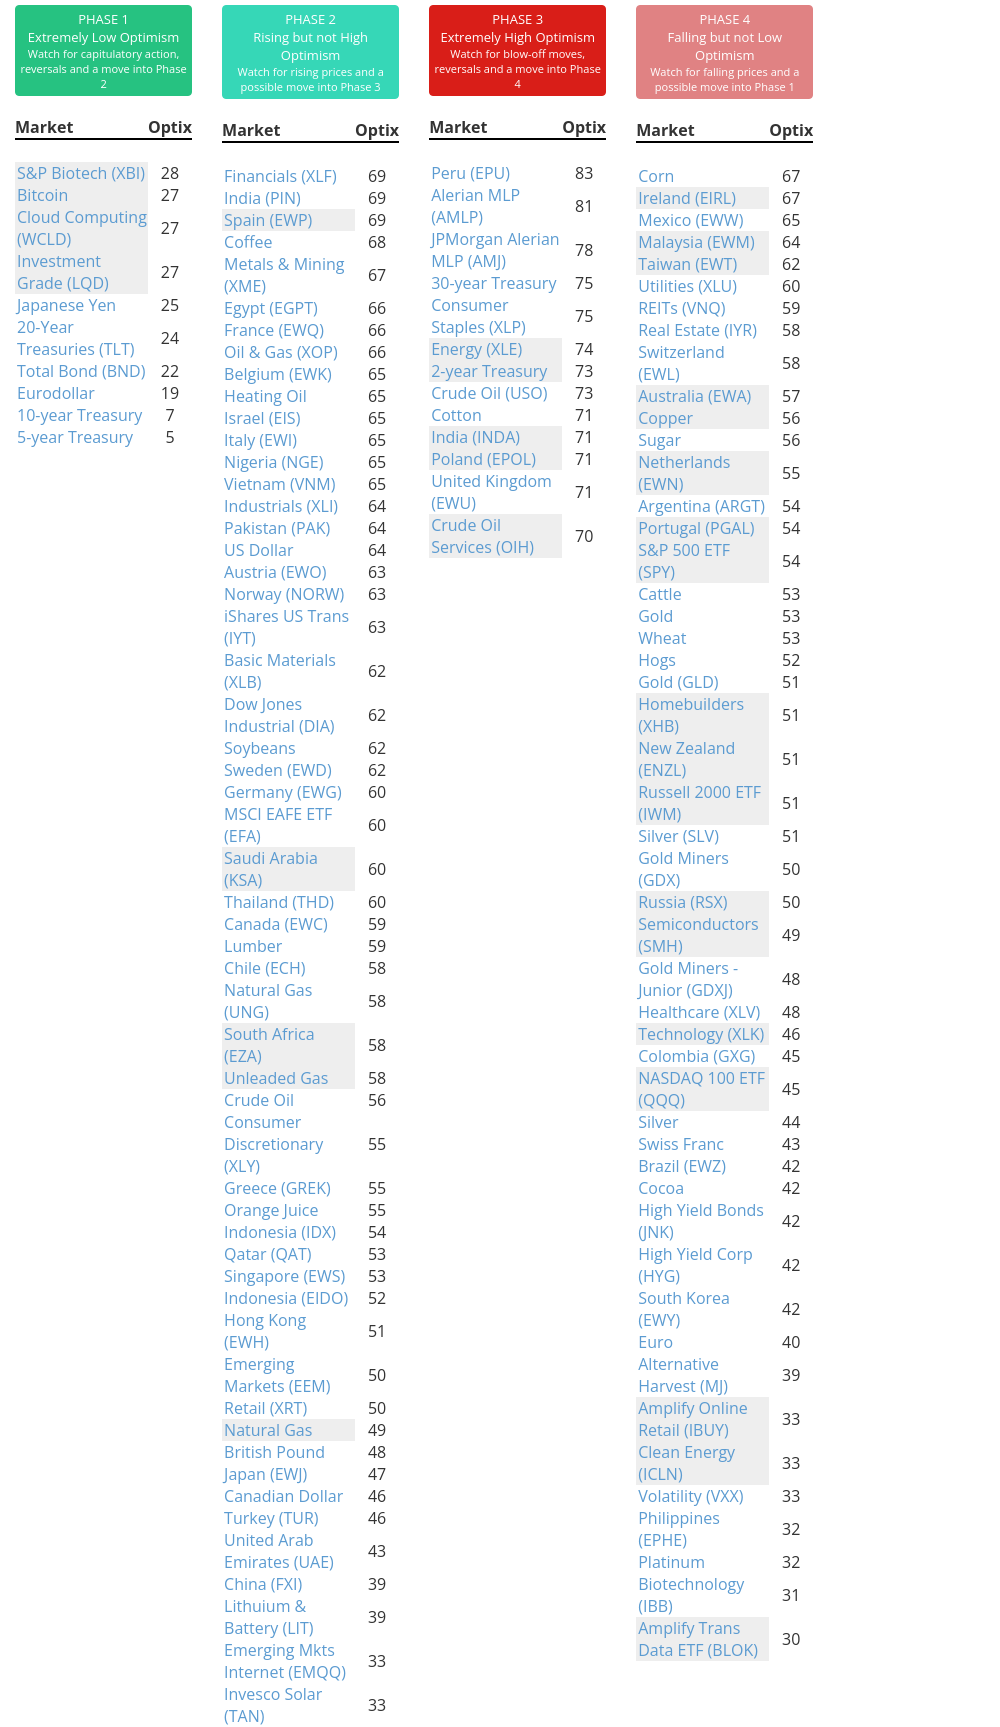
Phase Table
Ranks
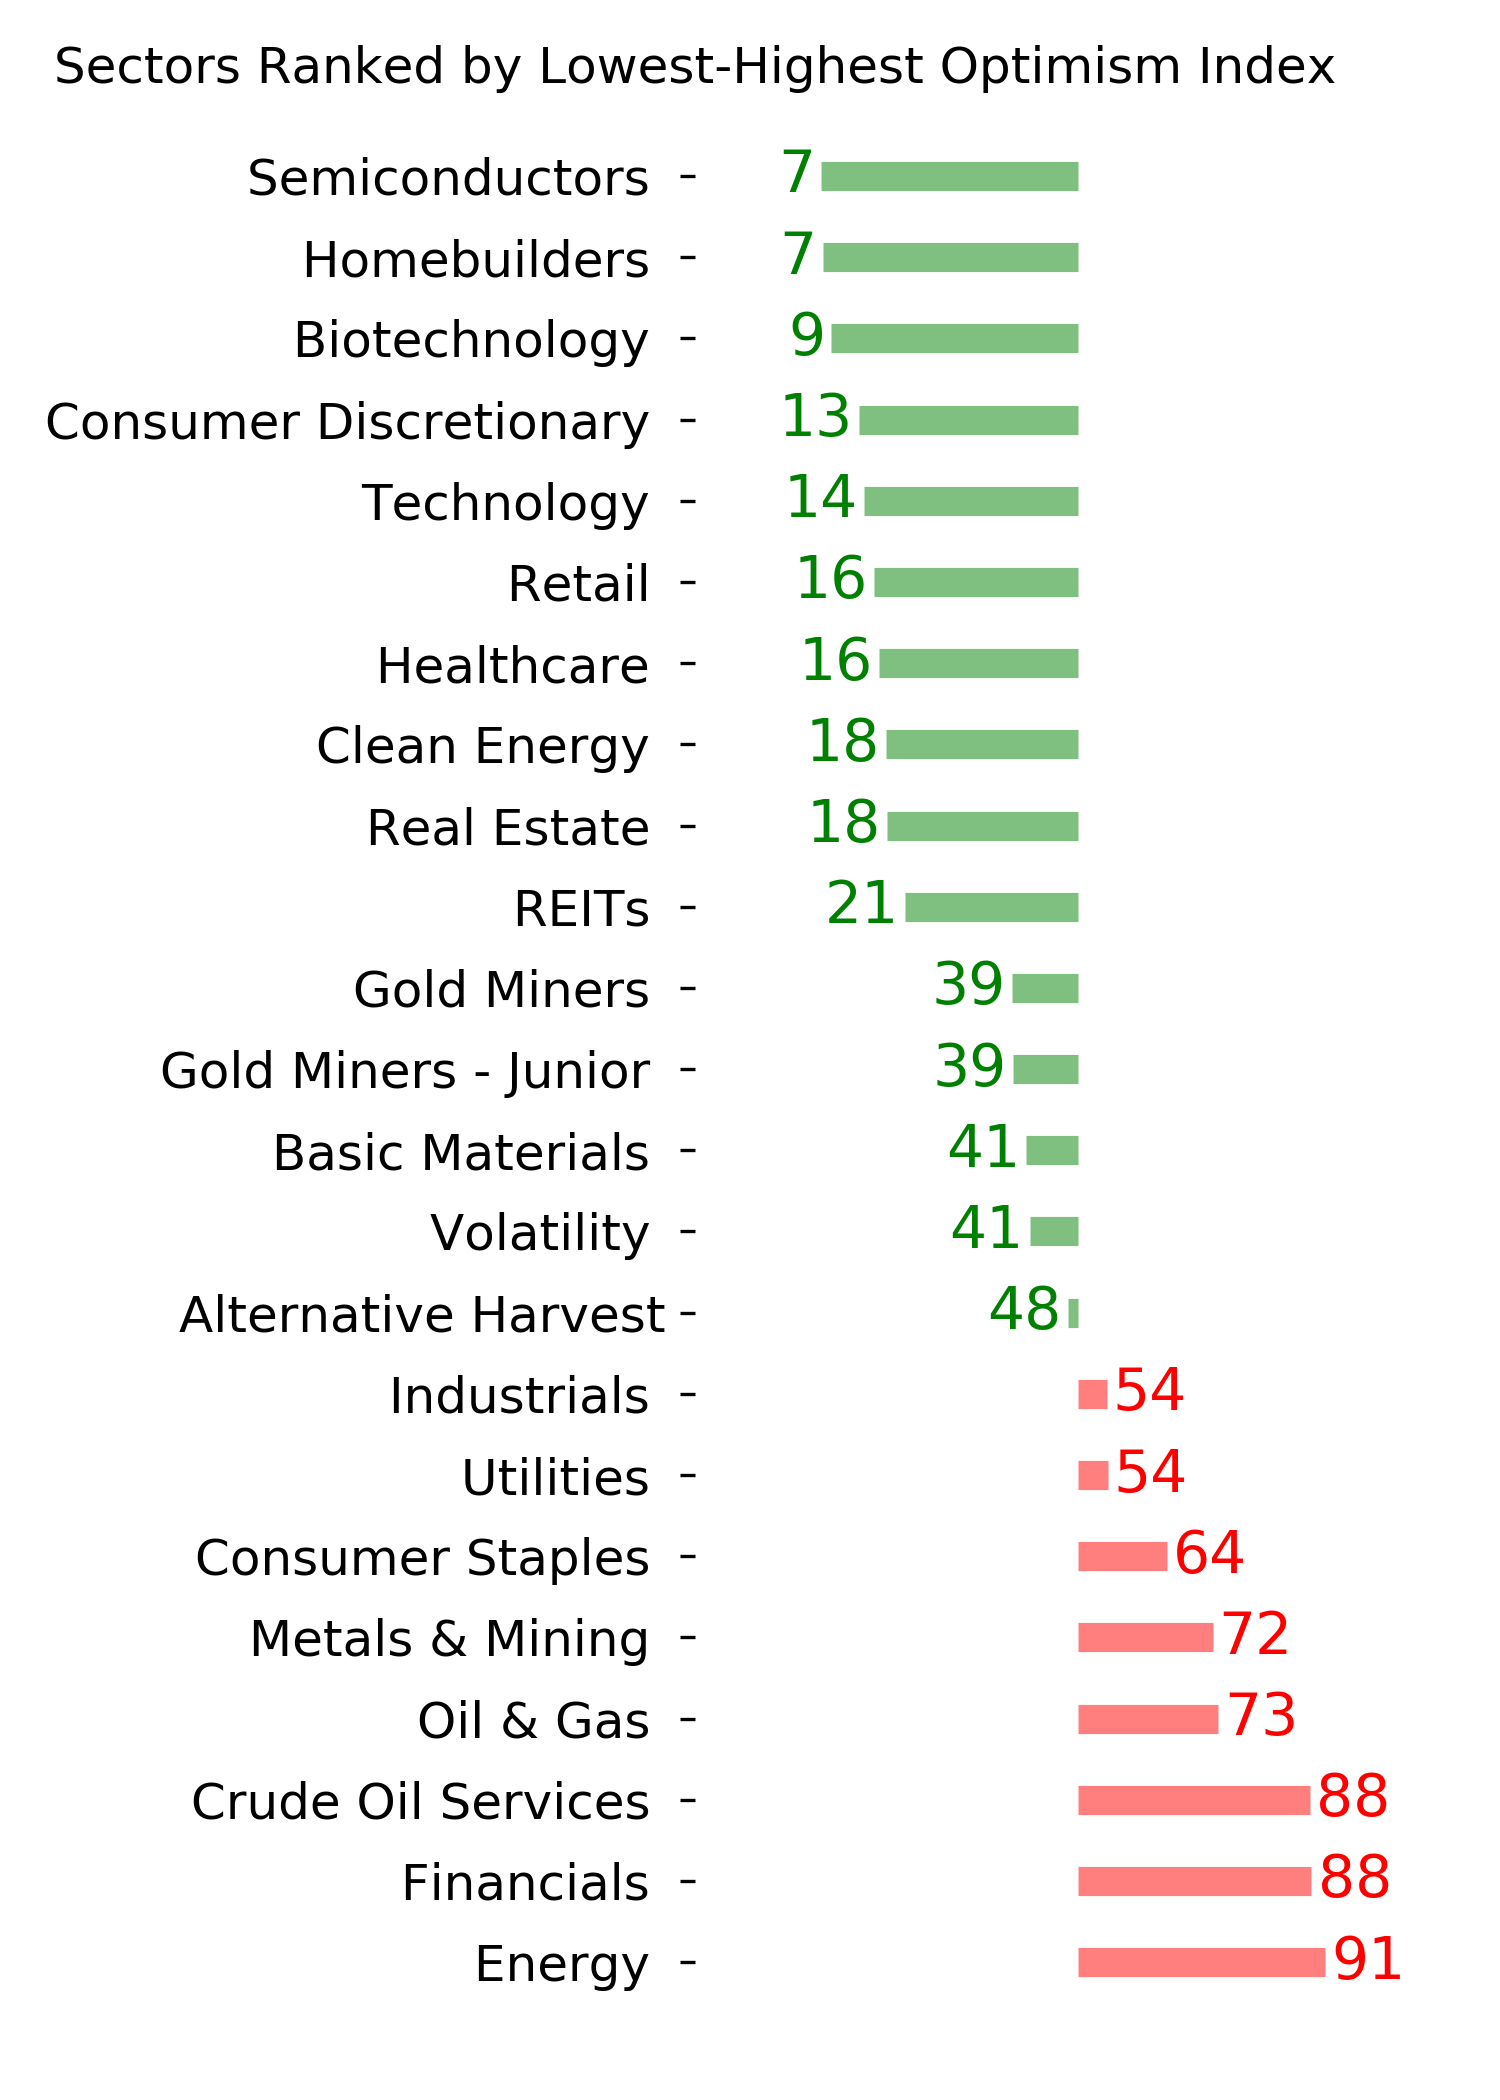
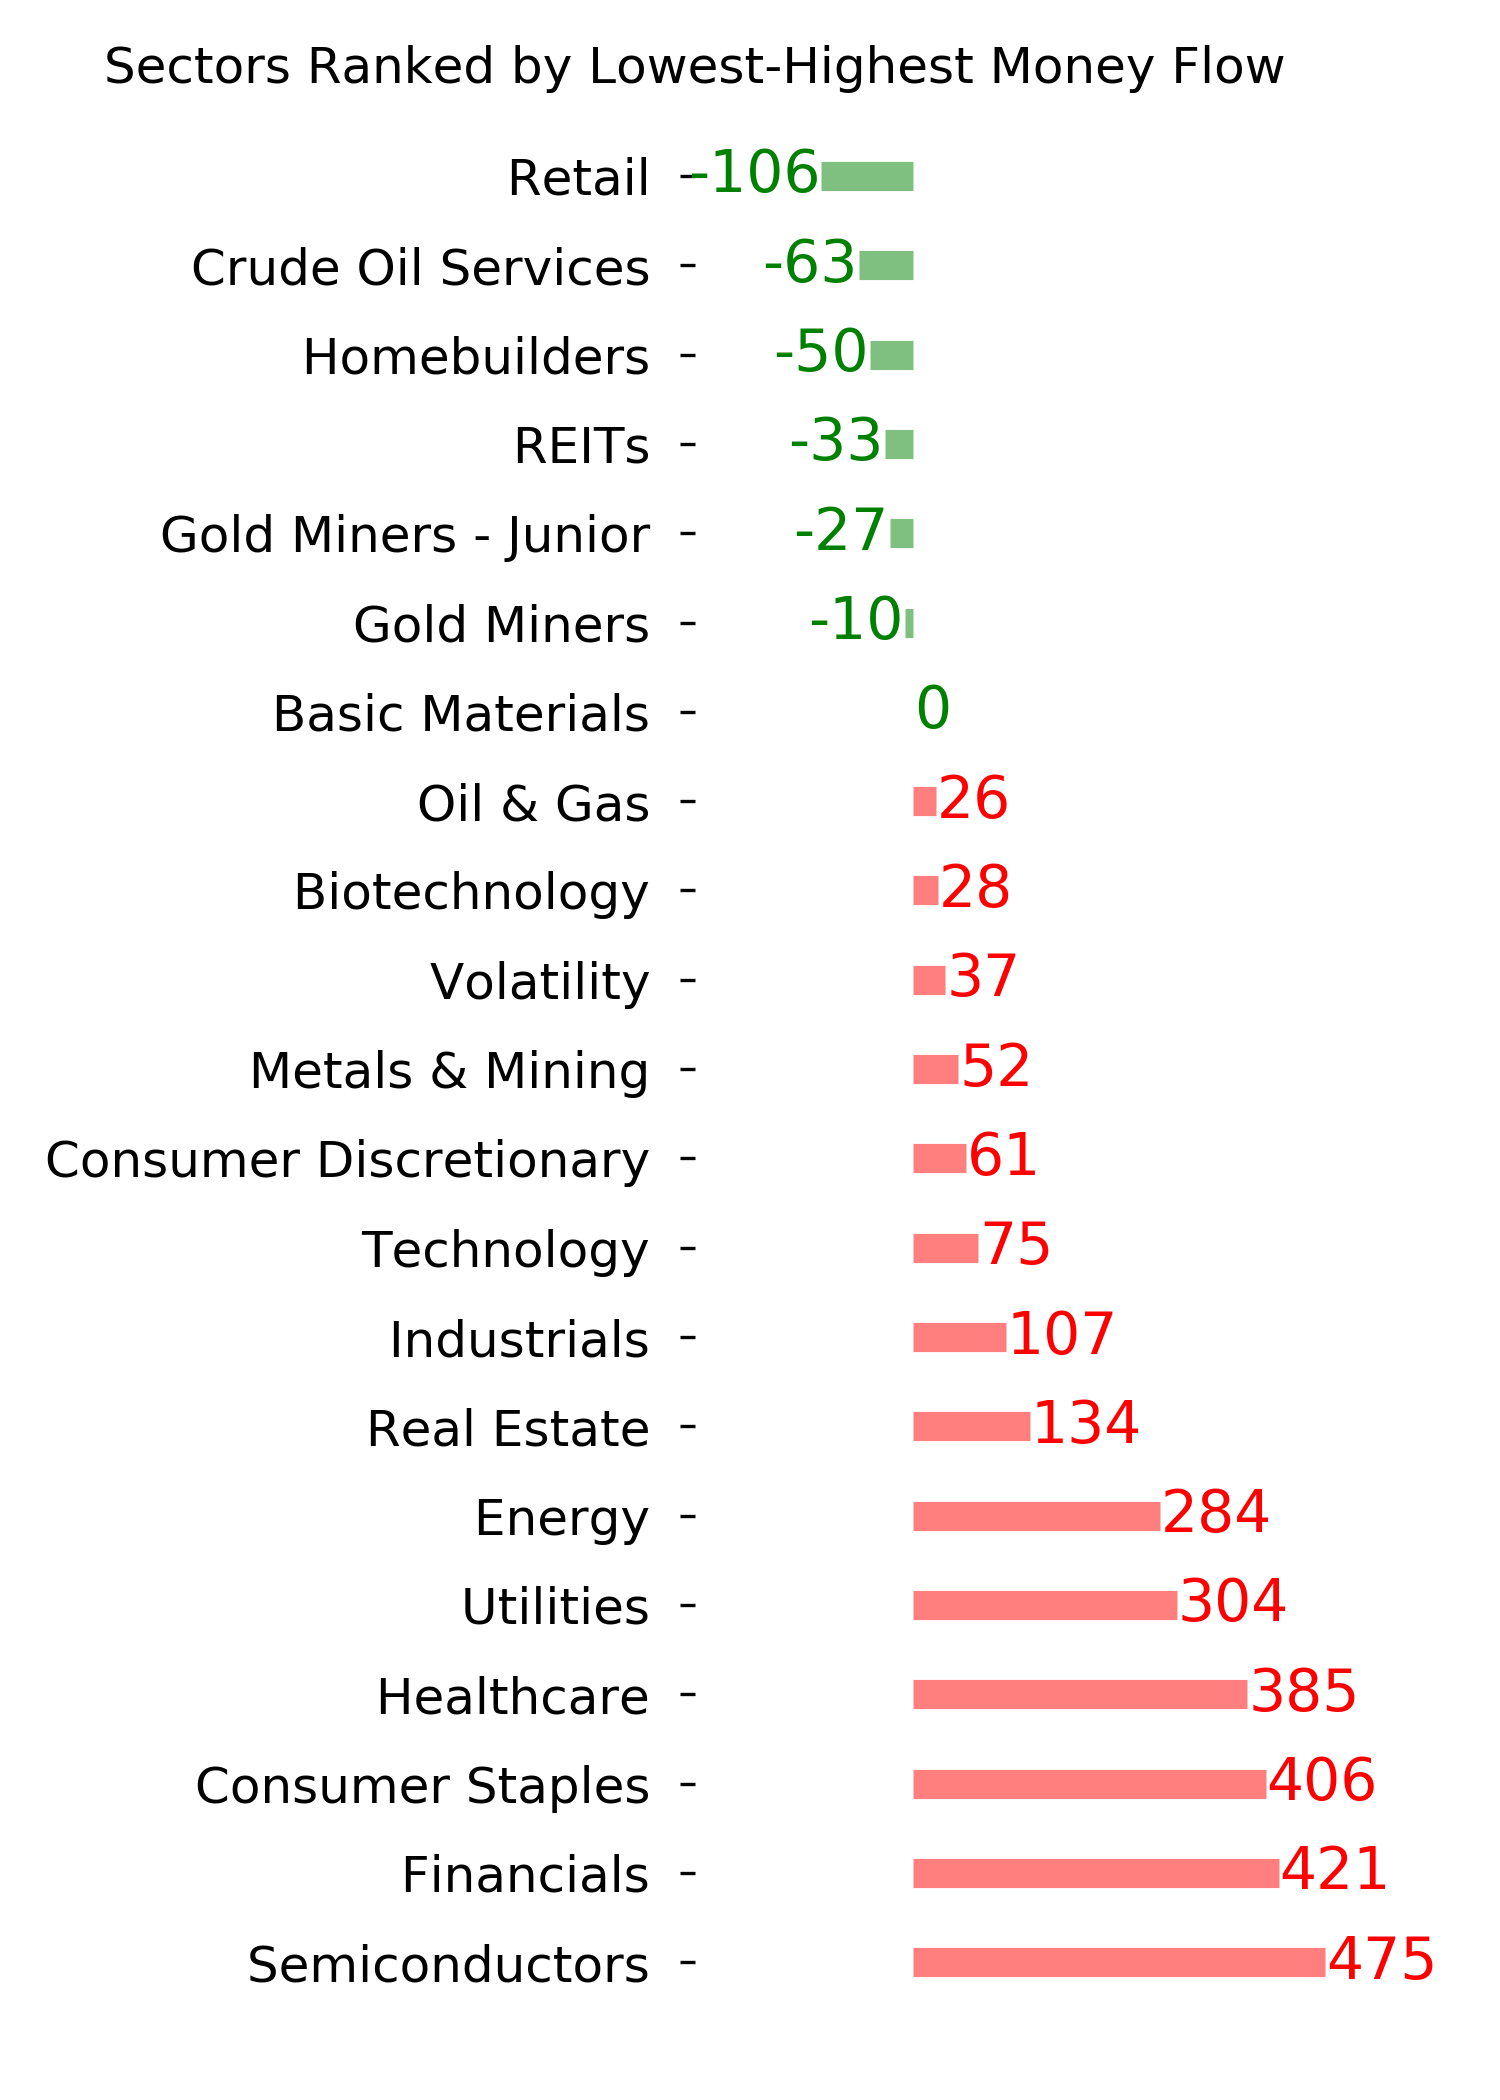
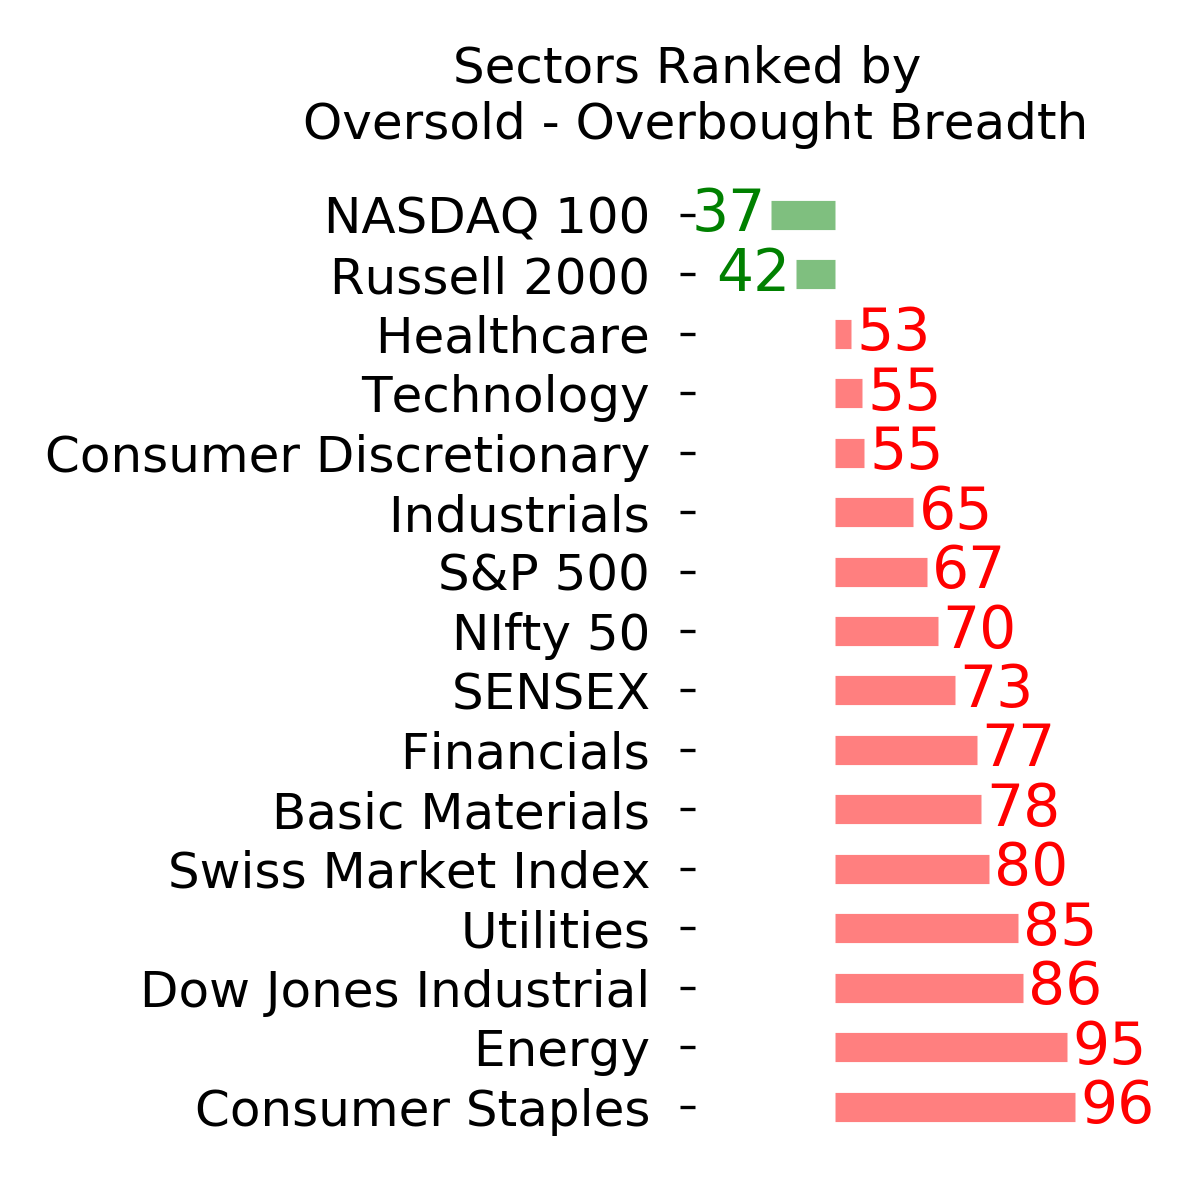
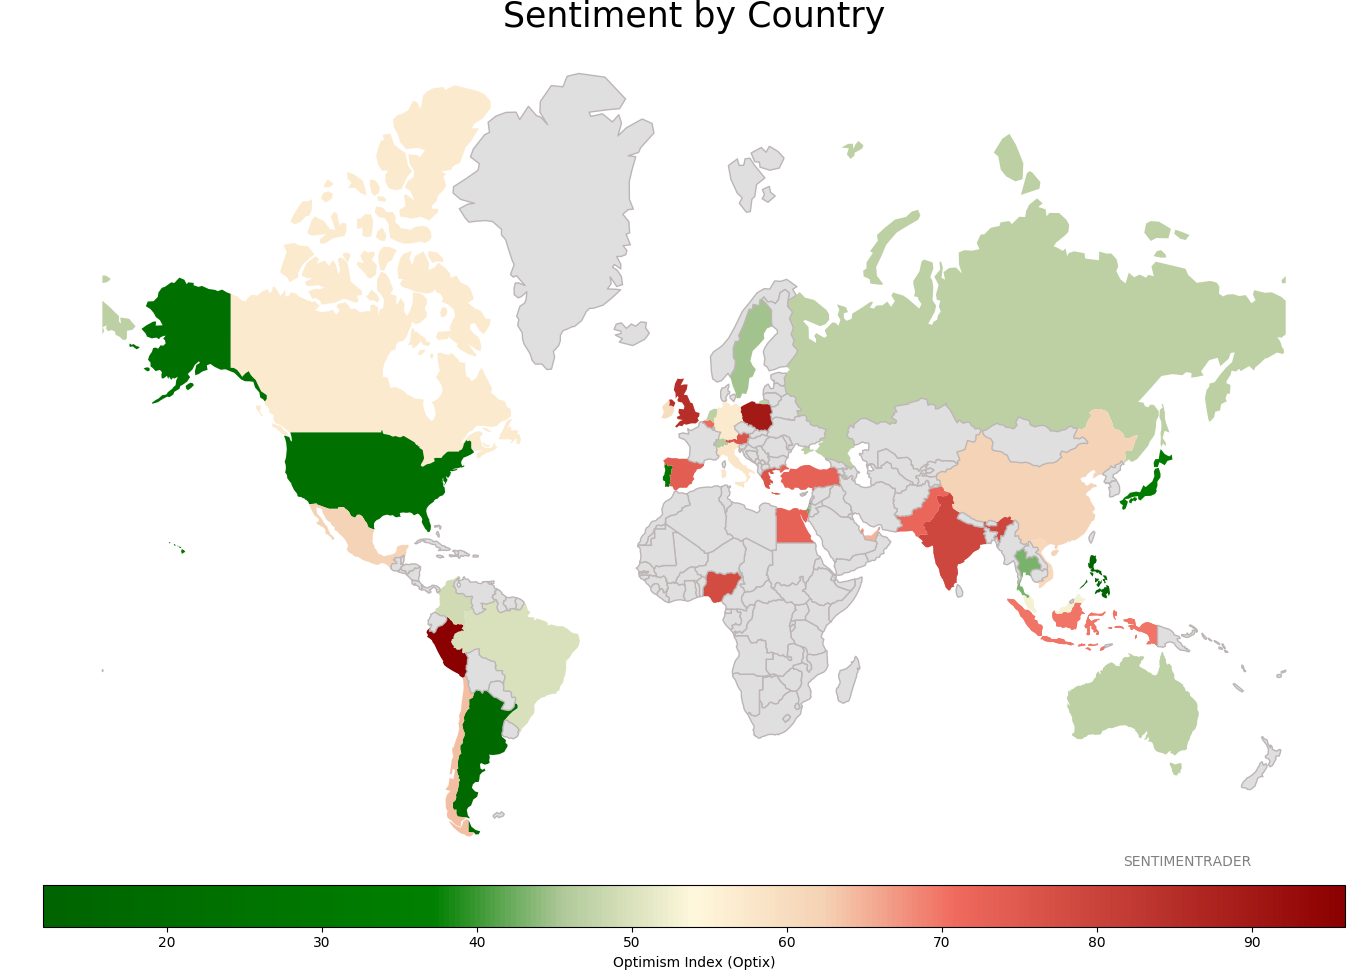
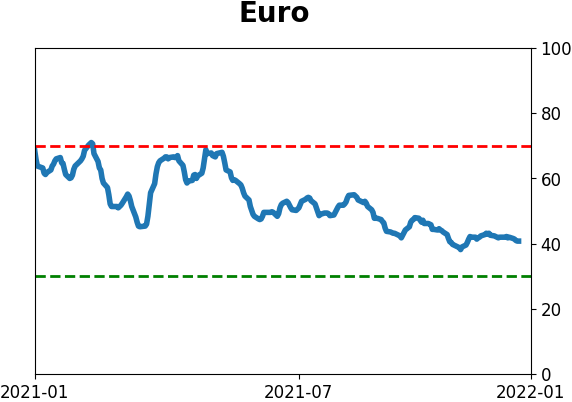
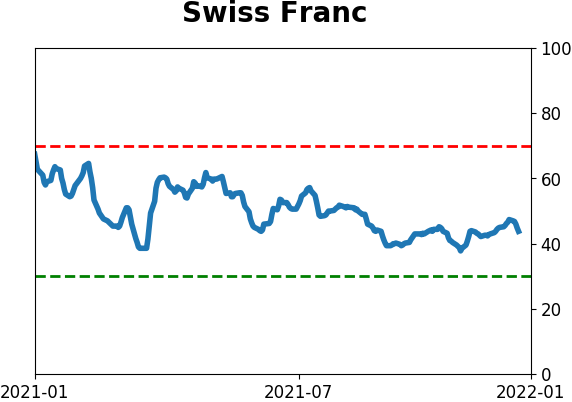
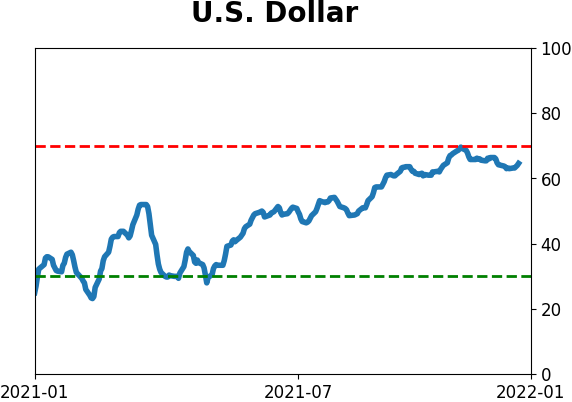
Sentiment Around The World
Optimism Index Thumbnails
|
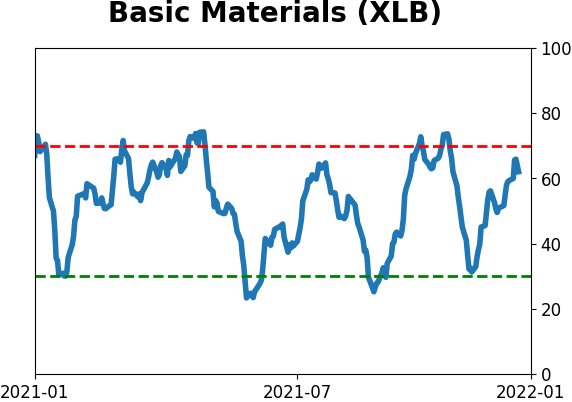
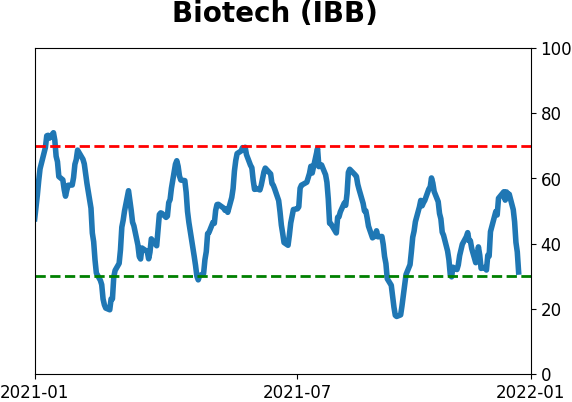
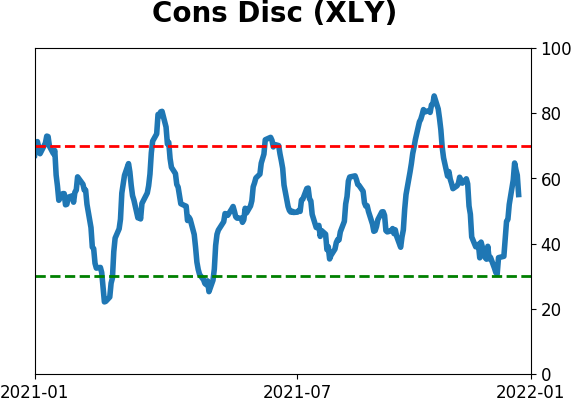
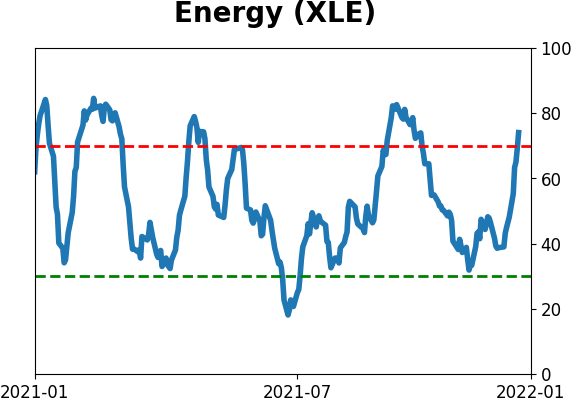
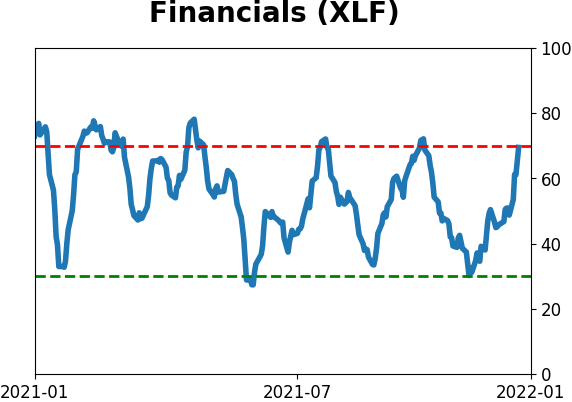
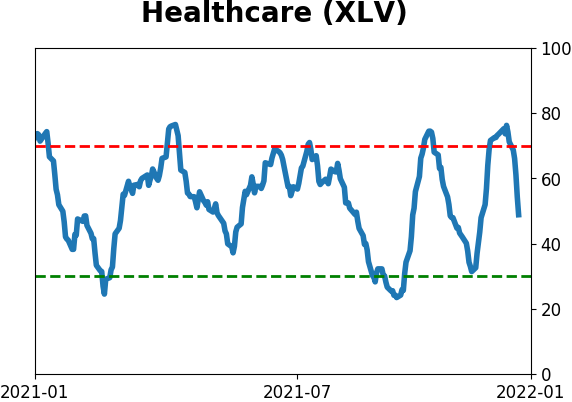
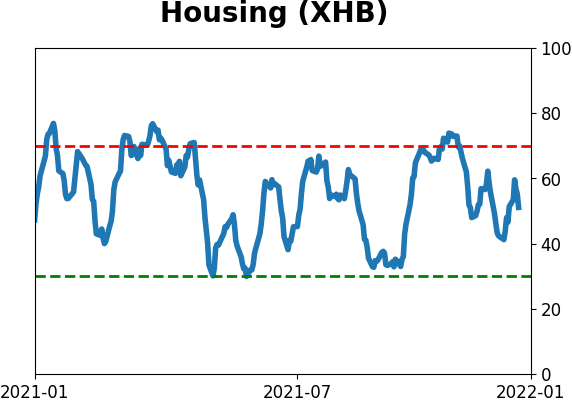
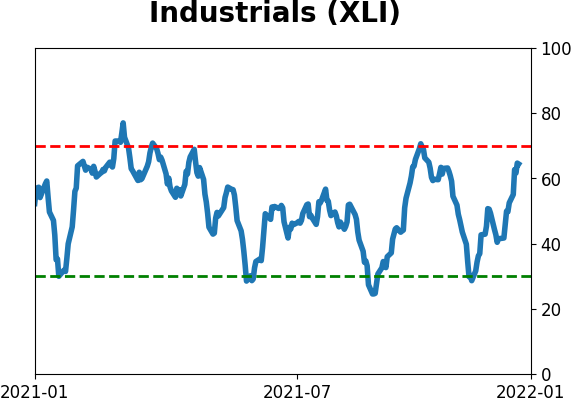
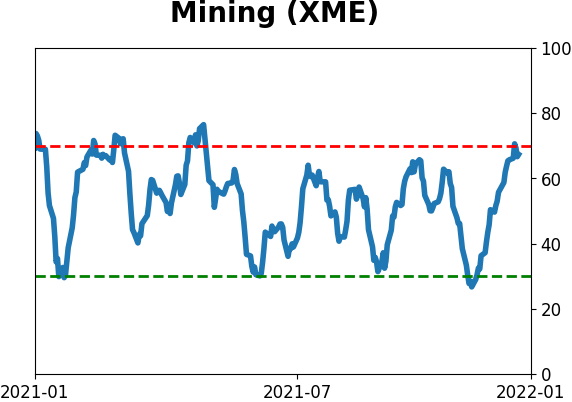
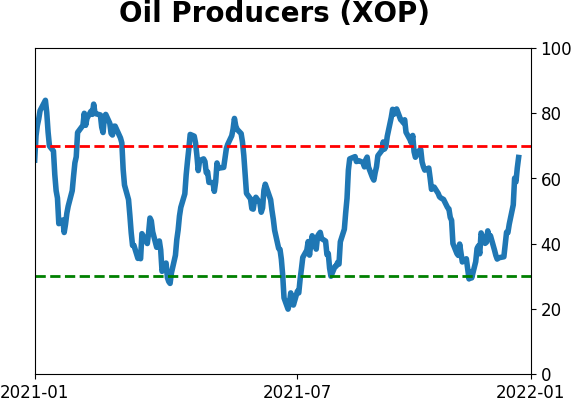
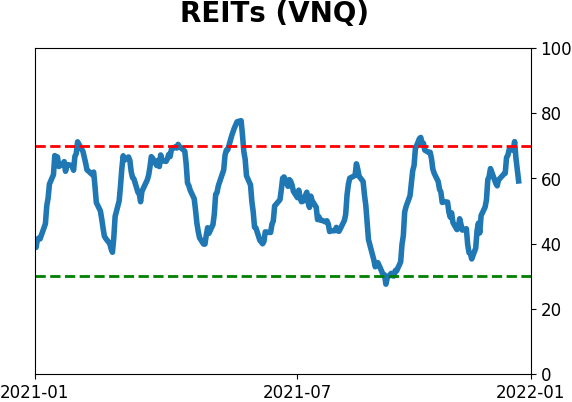
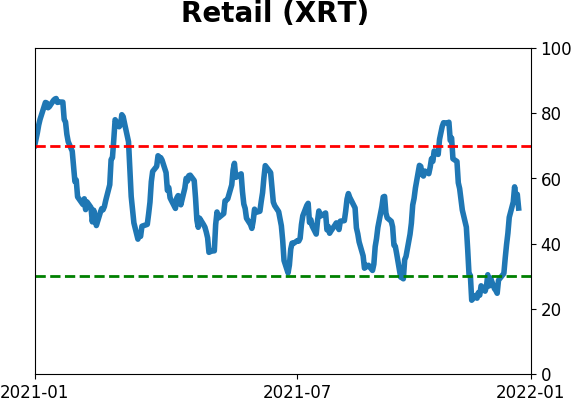
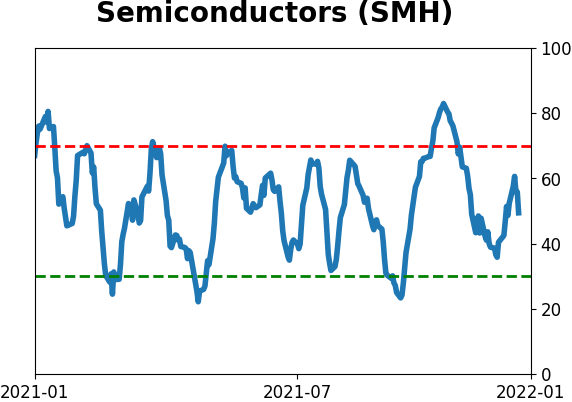
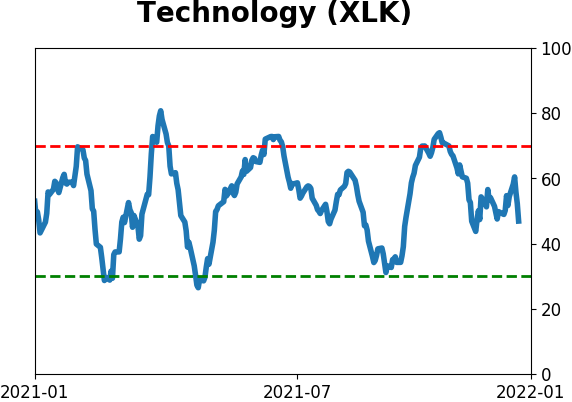
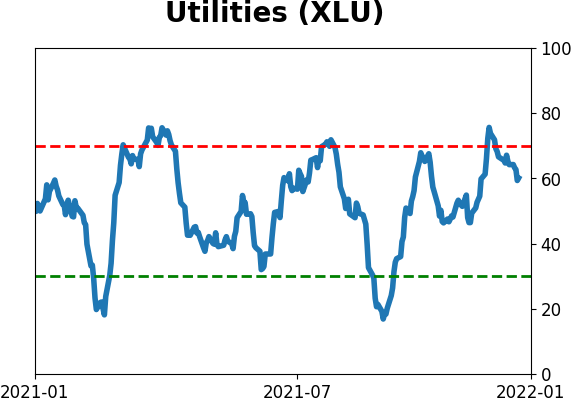
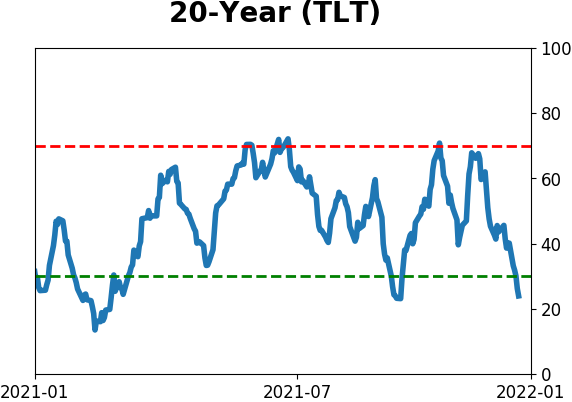
Sector ETF's - 10-Day Moving Average
|
|
|
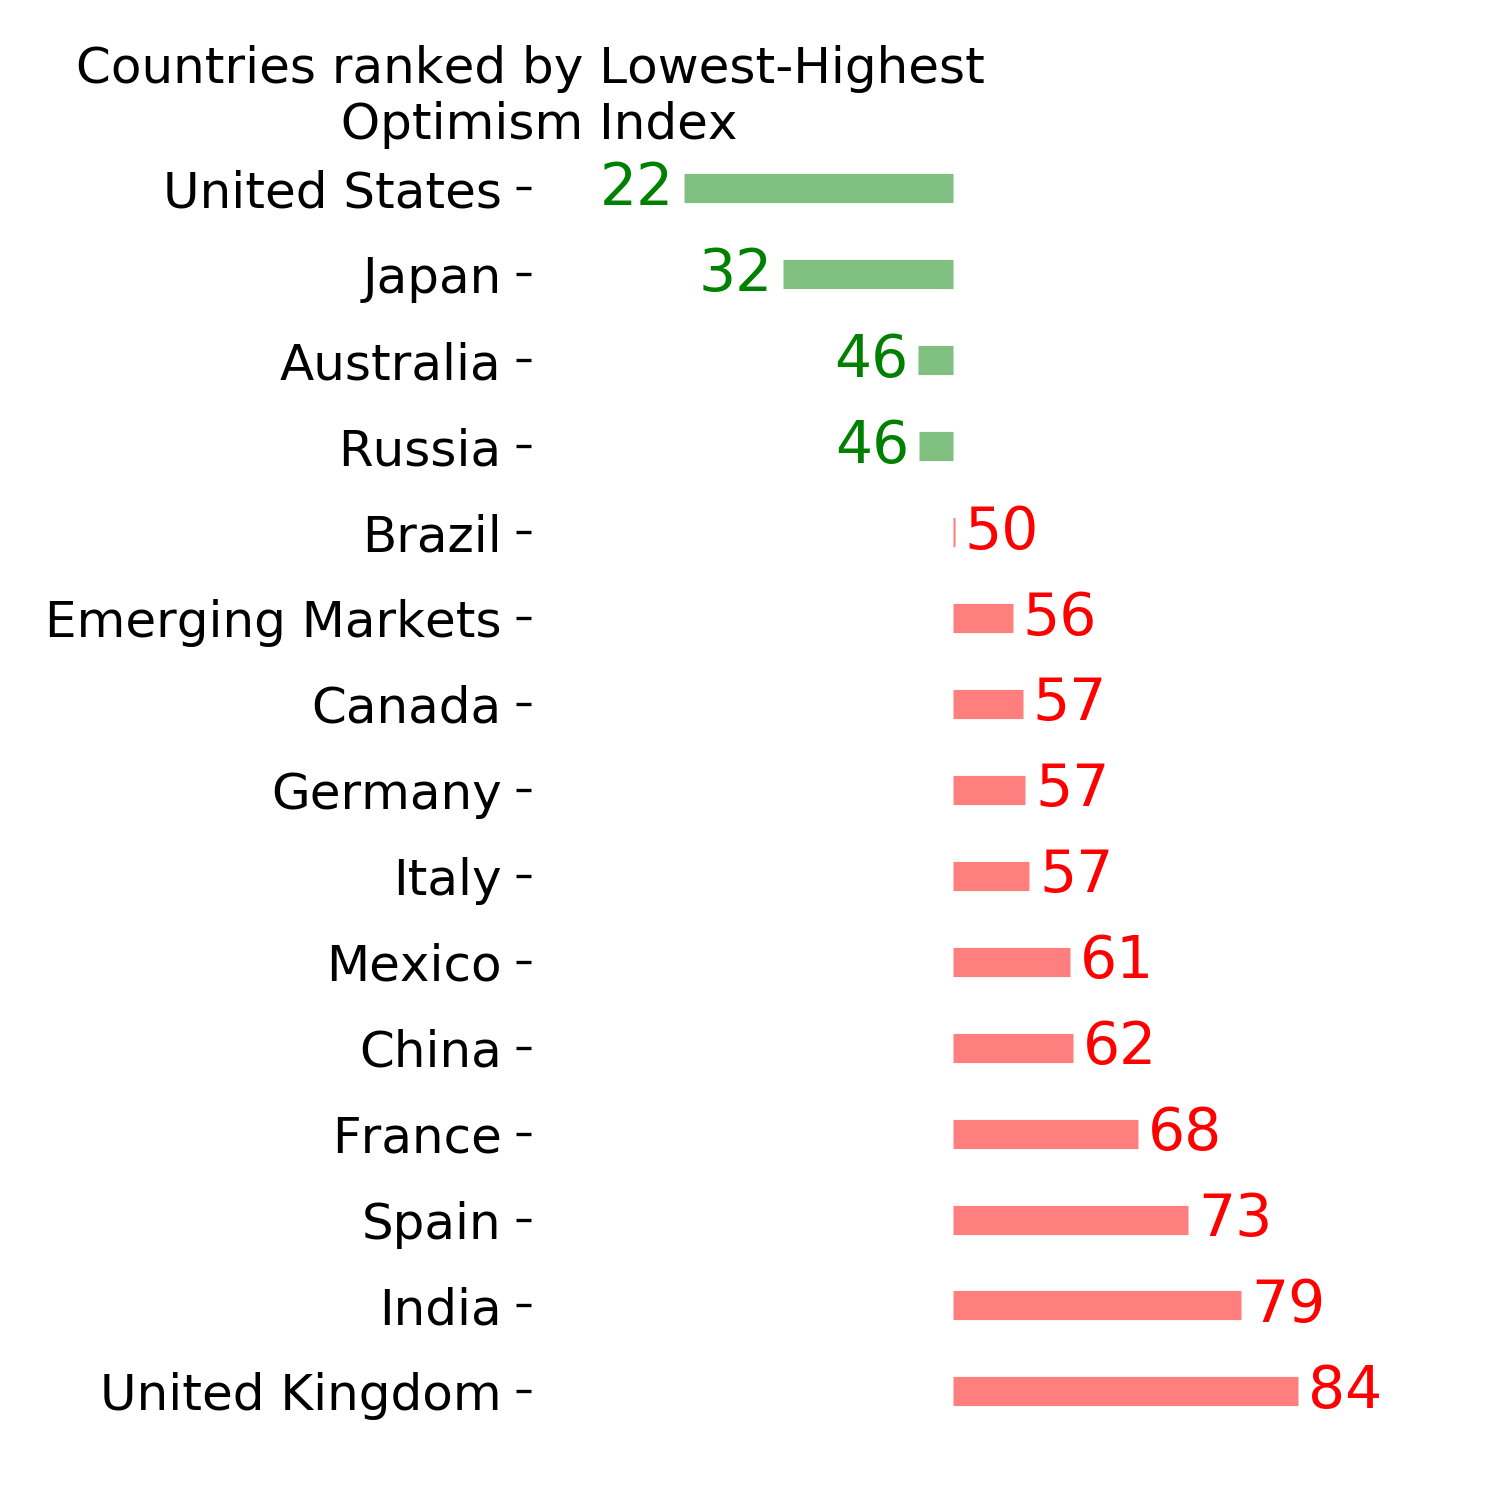
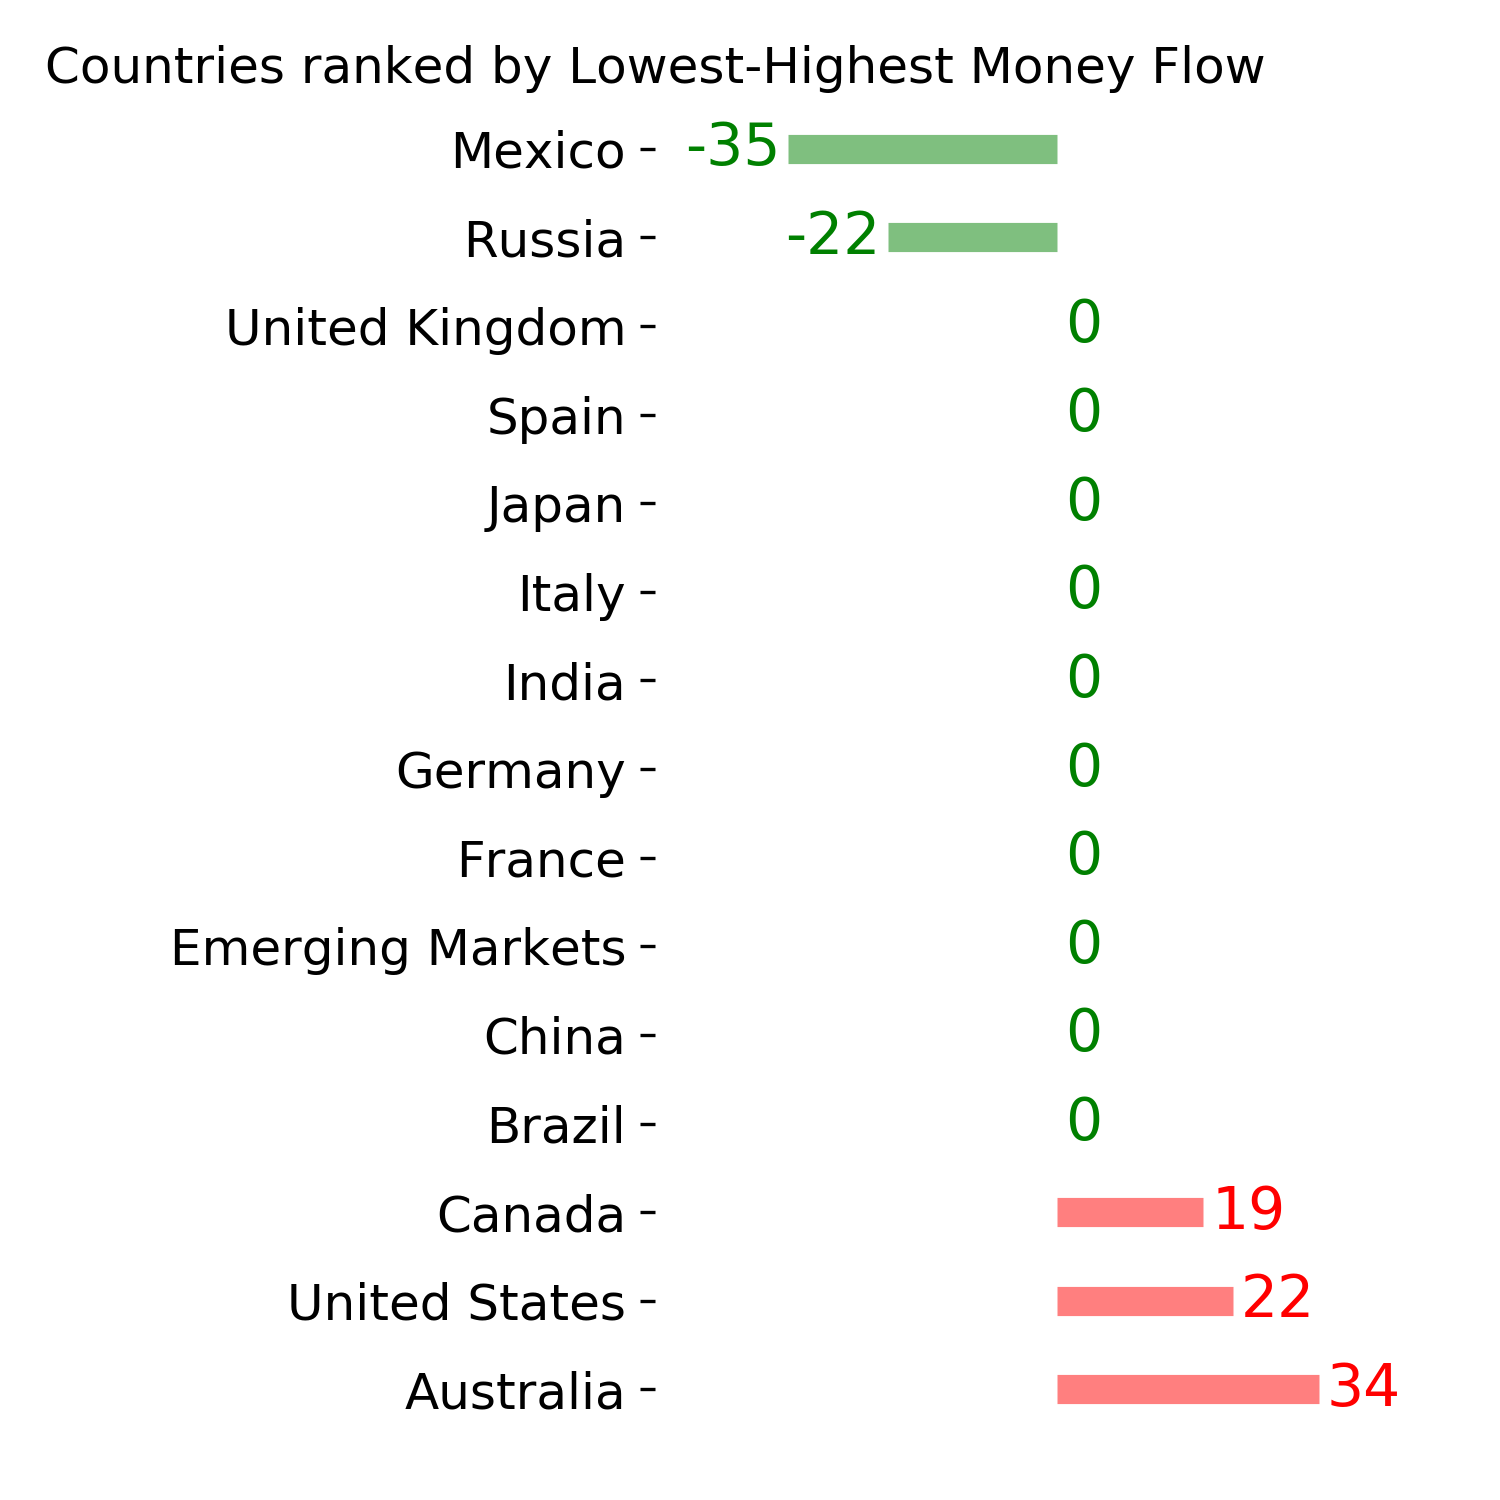
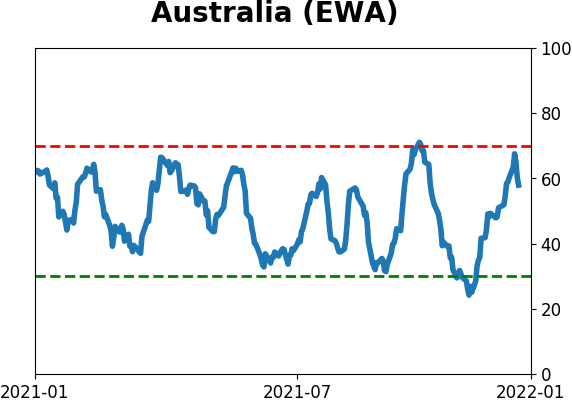
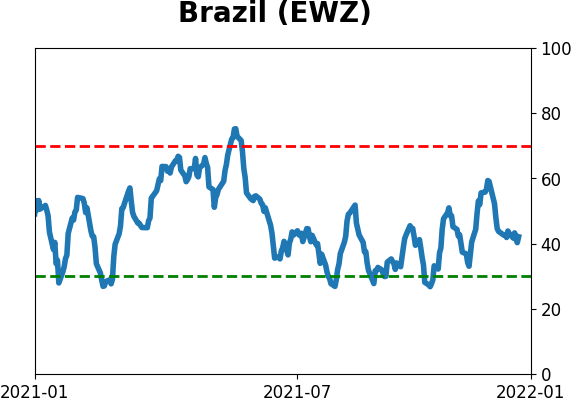
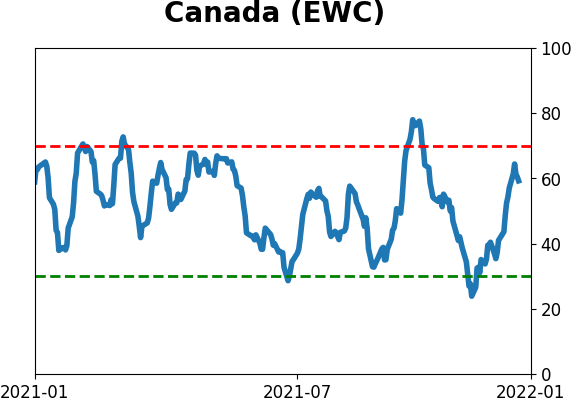
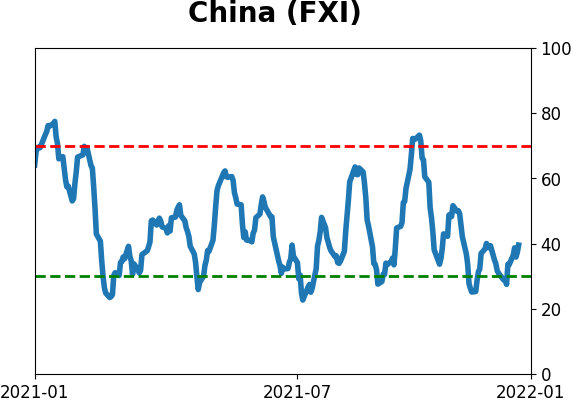
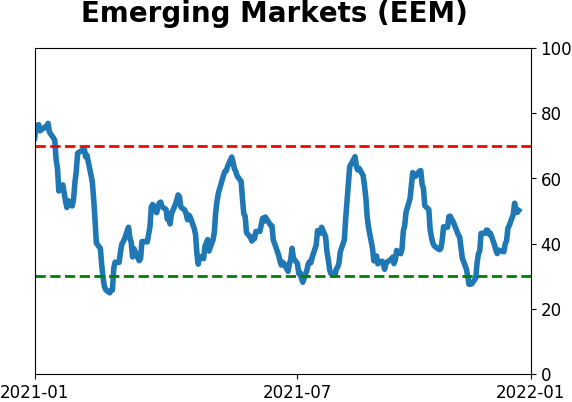
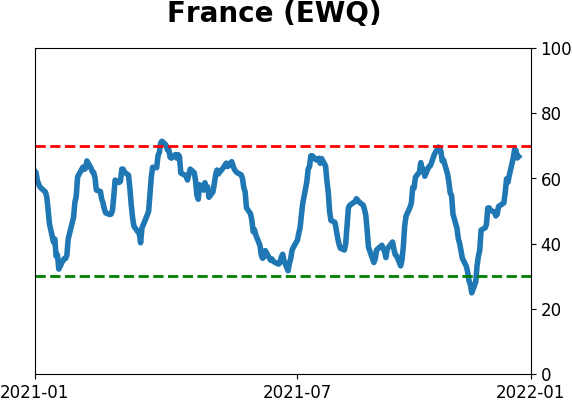
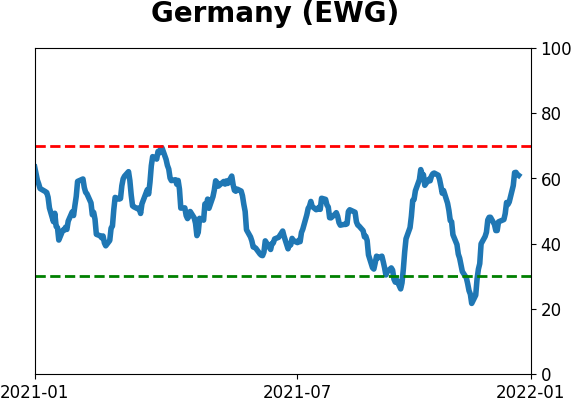
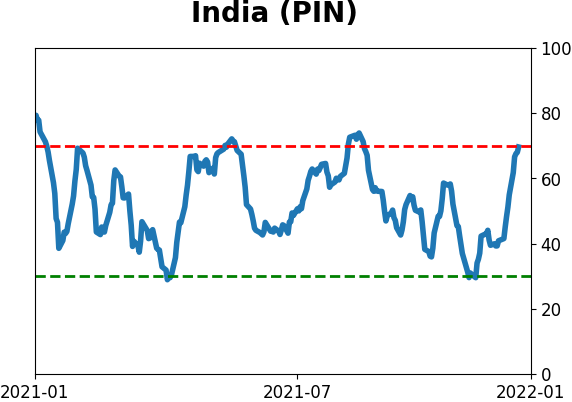
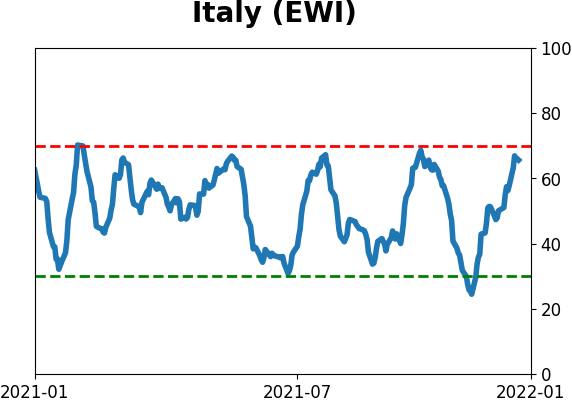
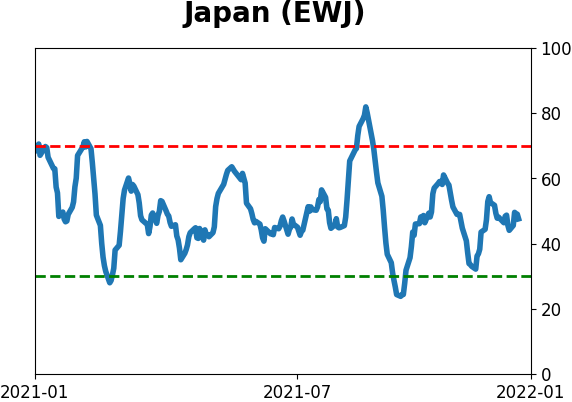
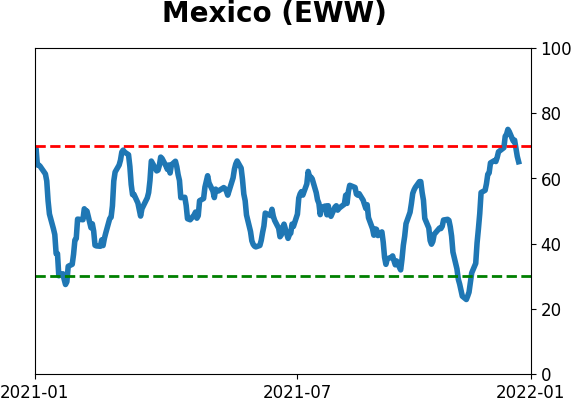
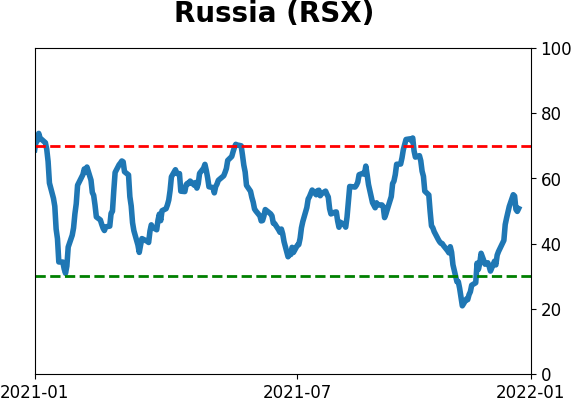
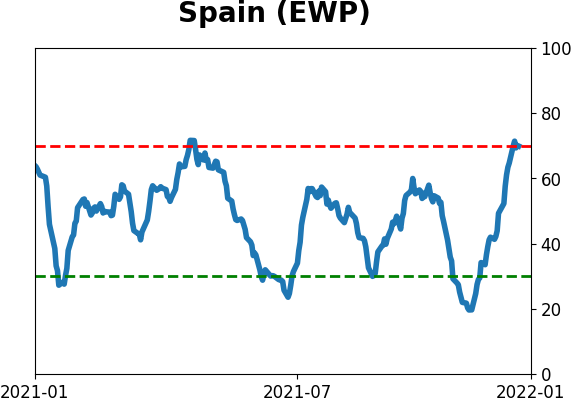
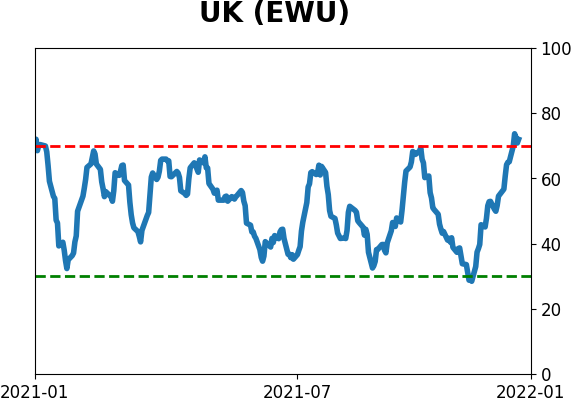
Country ETF's - 10-Day Moving Average
|
|
|
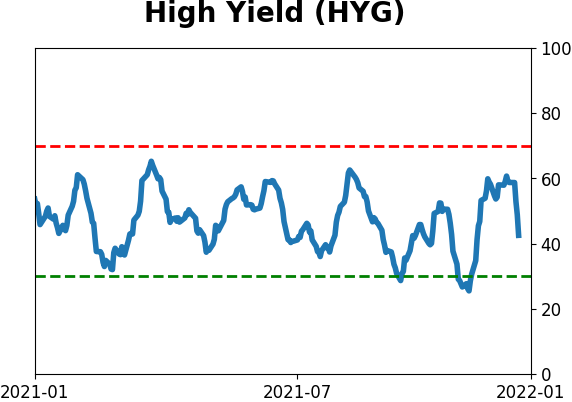
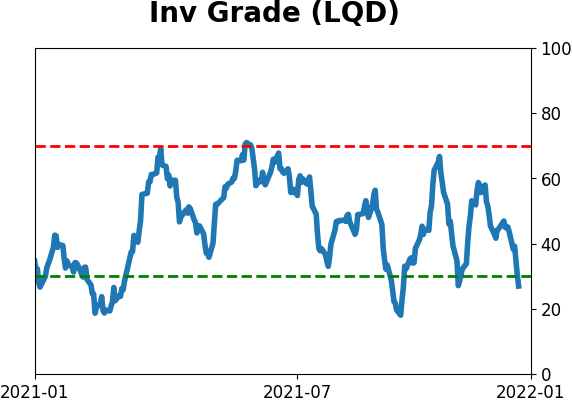
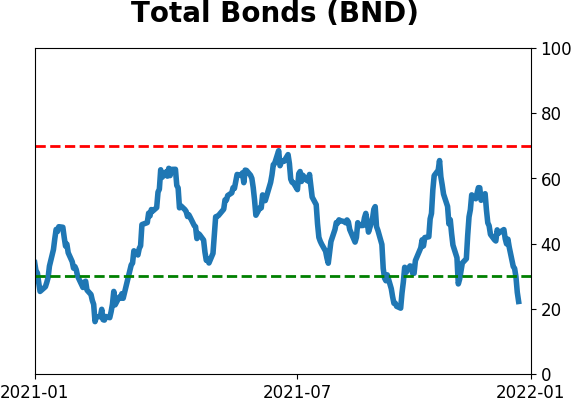
Bond ETF's - 10-Day Moving Average
|
|
|
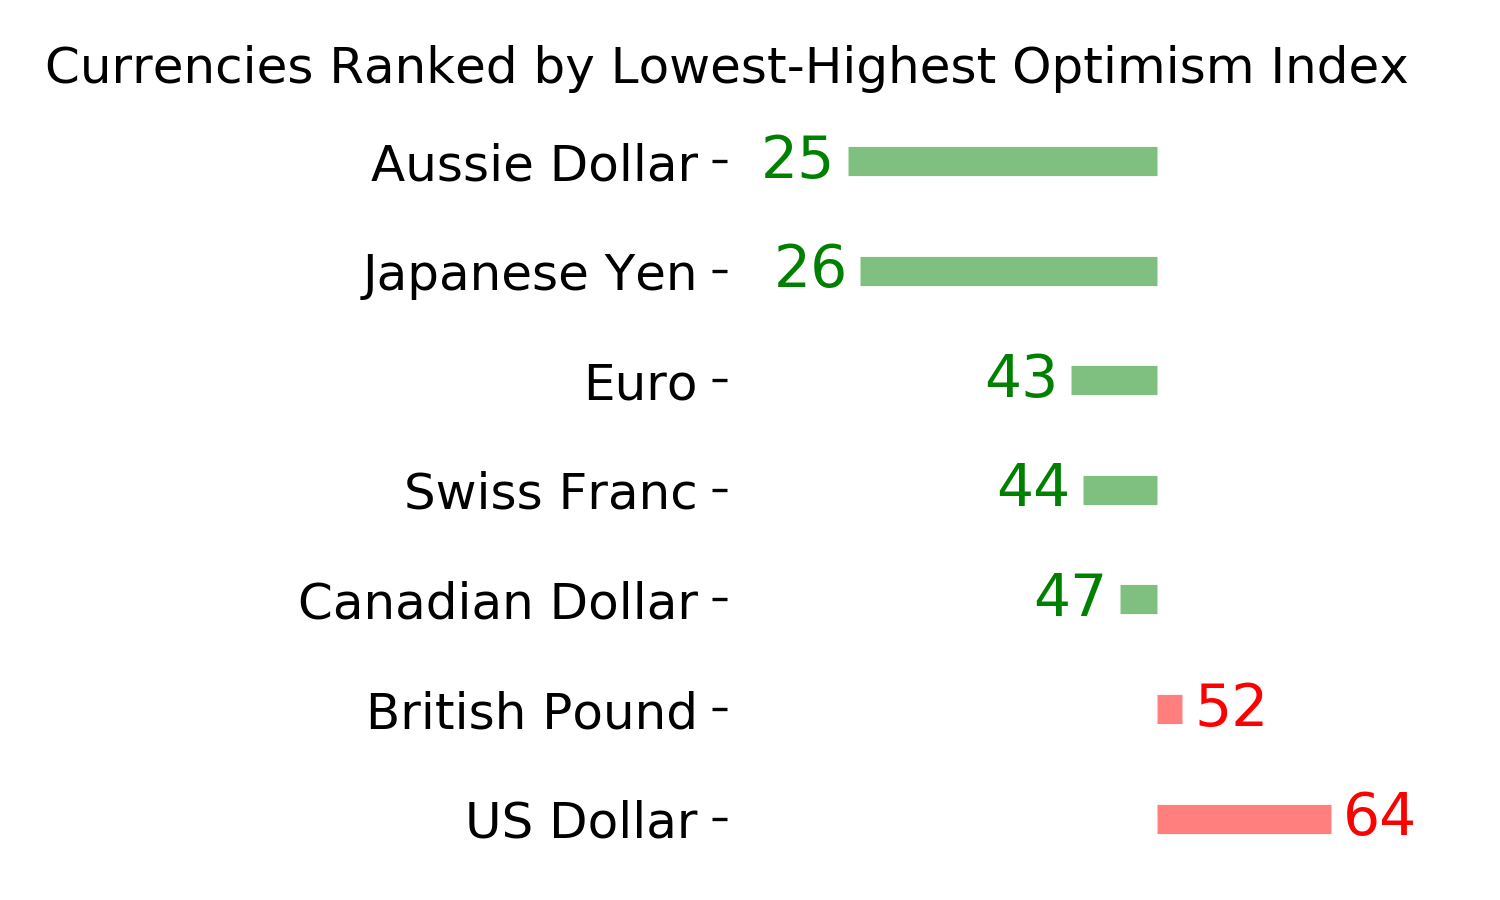
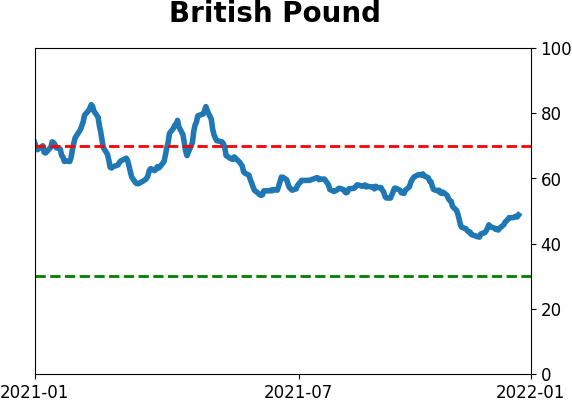
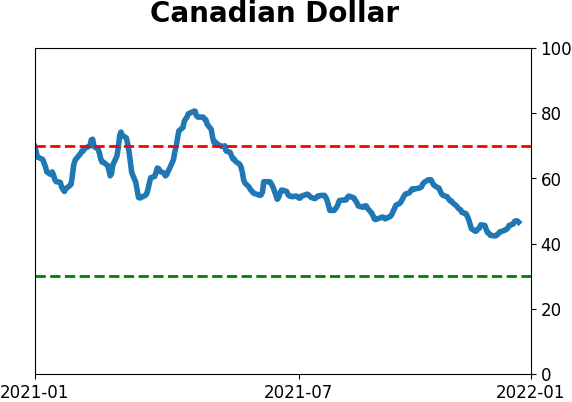
Currency ETF's - 5-Day Moving Average
|
|
|
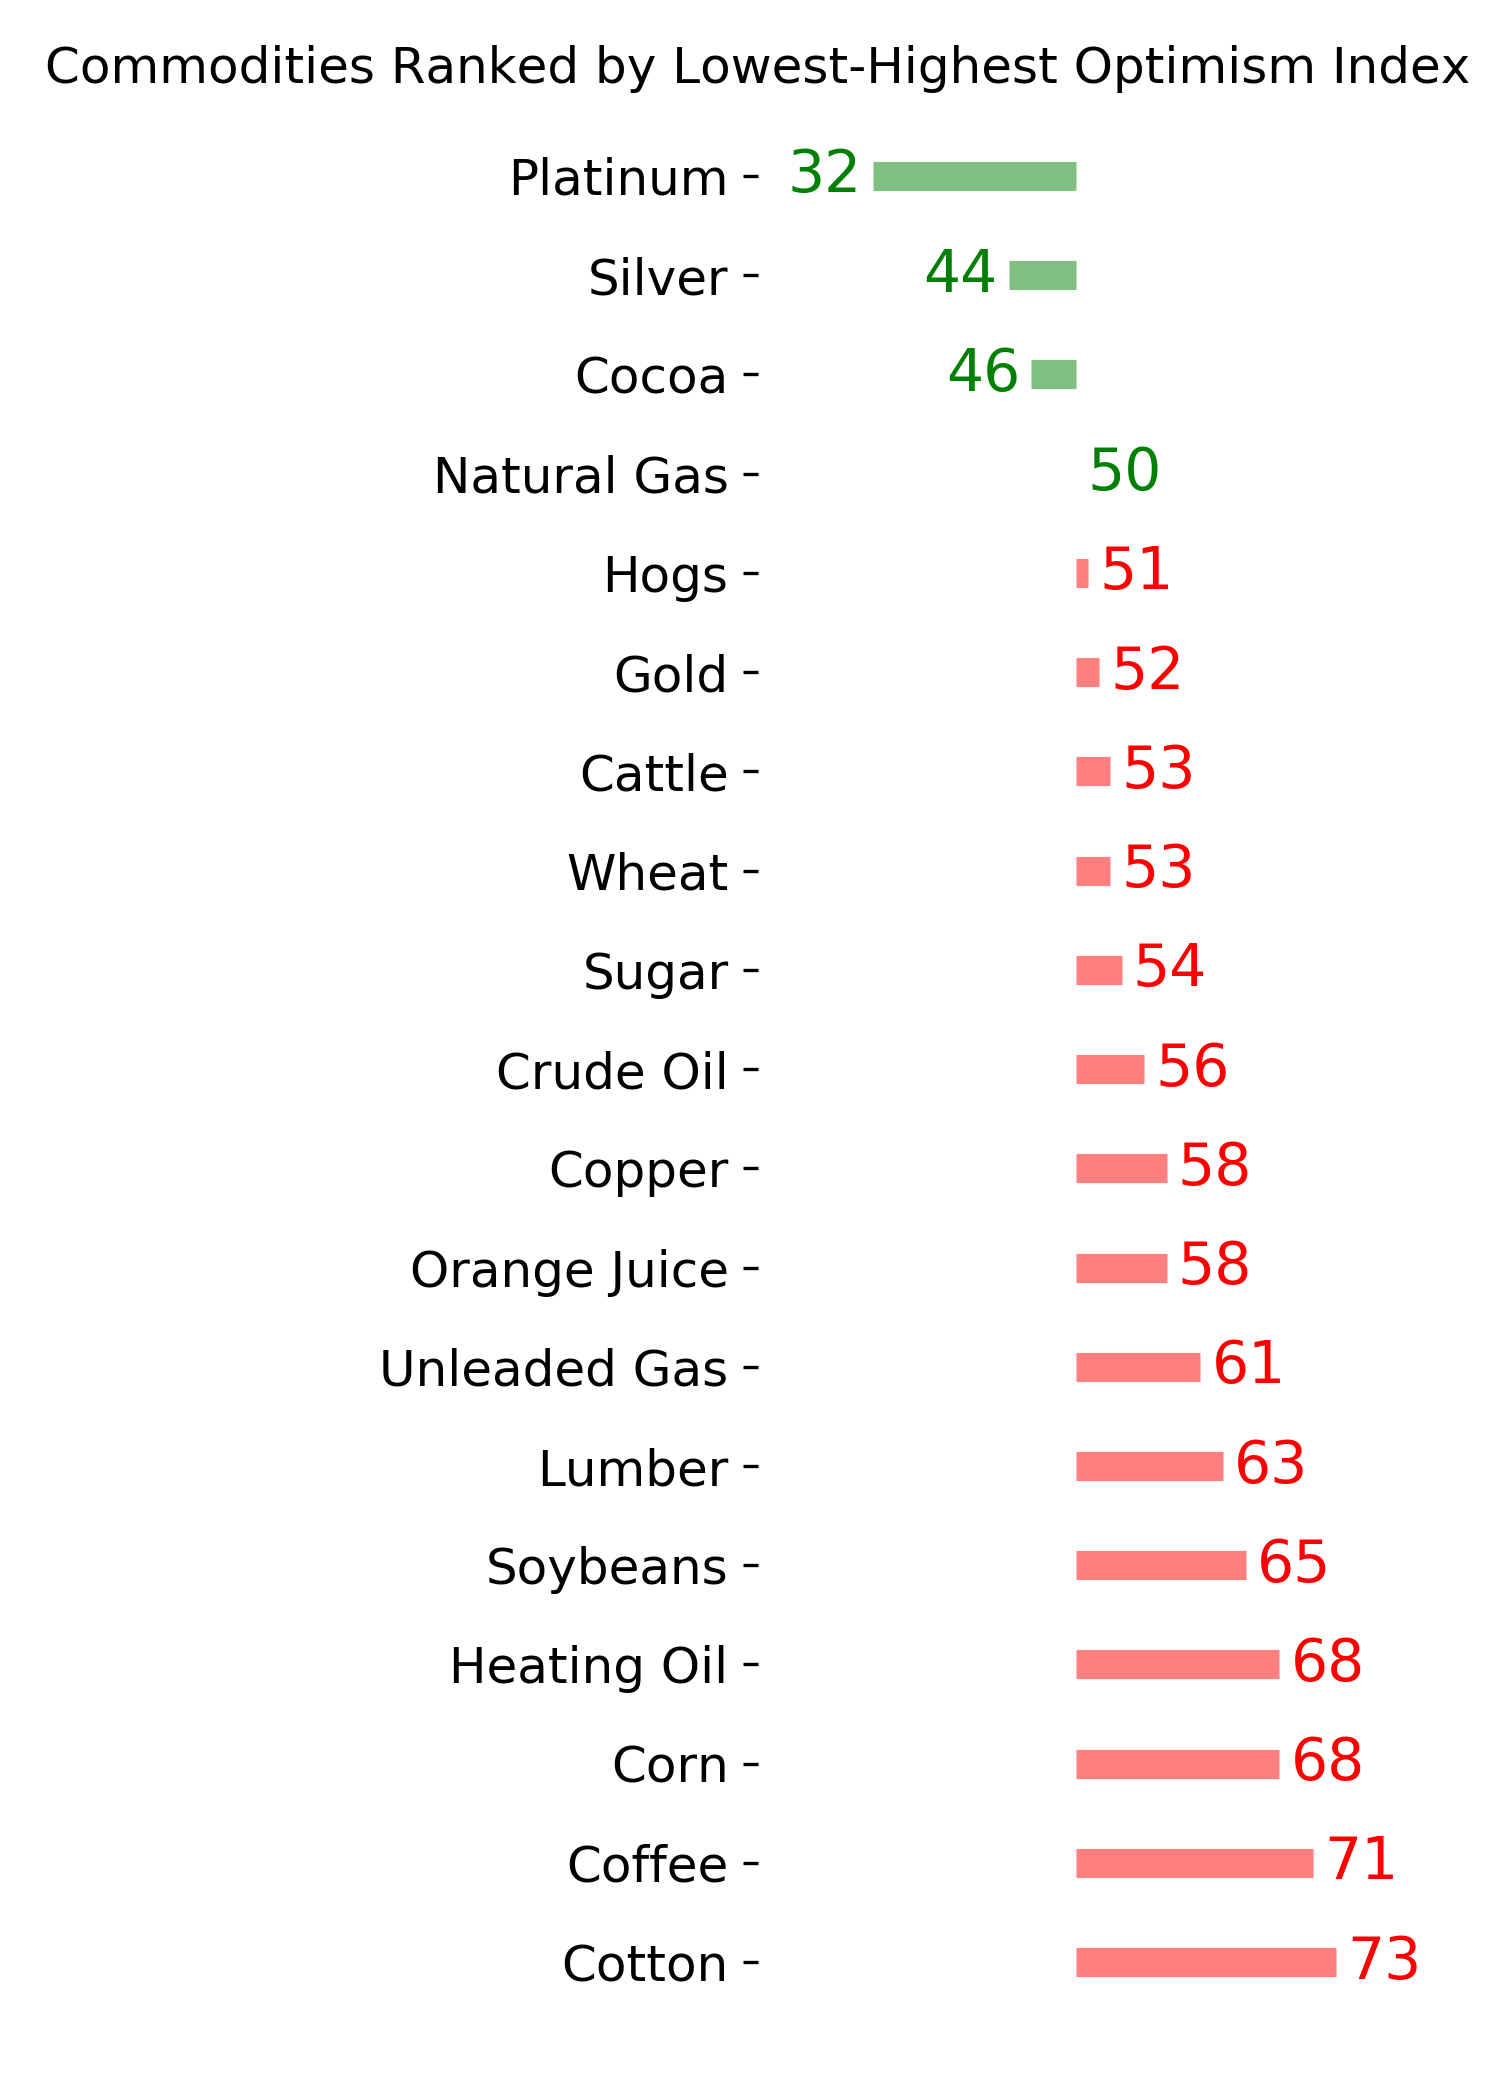
Commodity ETF's - 5-Day Moving Average
|
|