Headlines
|
|
Good quarters tend to beget good quarters:
The S&P 500 Index gained 10.6% during the 4th quarter of 2021. Does this have any implications for the 1st quarter of 2022? This piece highlights the history of S&P 500 performance following particularly strong quarters.
The years with sector and factor performance most like 2021:
A look at the years with the closest sector and factor performance to 2021 shows that 1996 led all years. Years with similar behavior preceded mostly good returns during the next year, with some evidence of mean-reversion among the sectors.
|
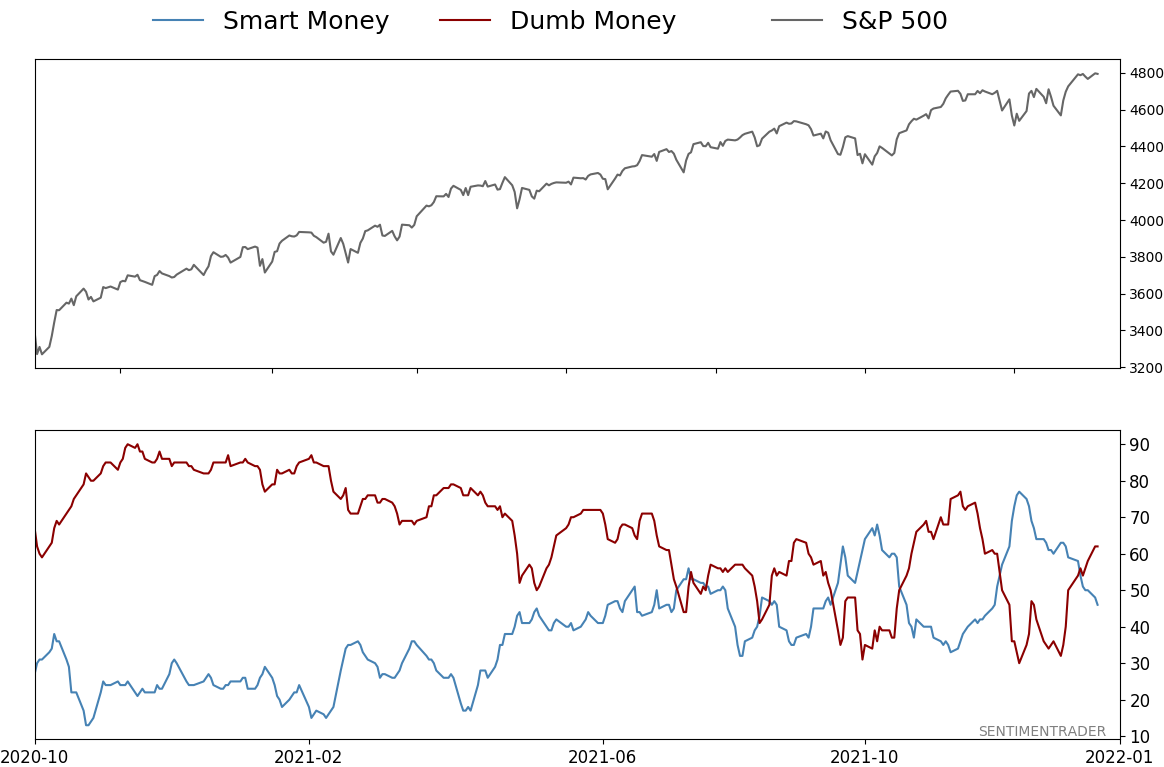
Smart / Dumb Money Confidence
|
Smart Money Confidence: 46%
Dumb Money Confidence: 62%
|
|
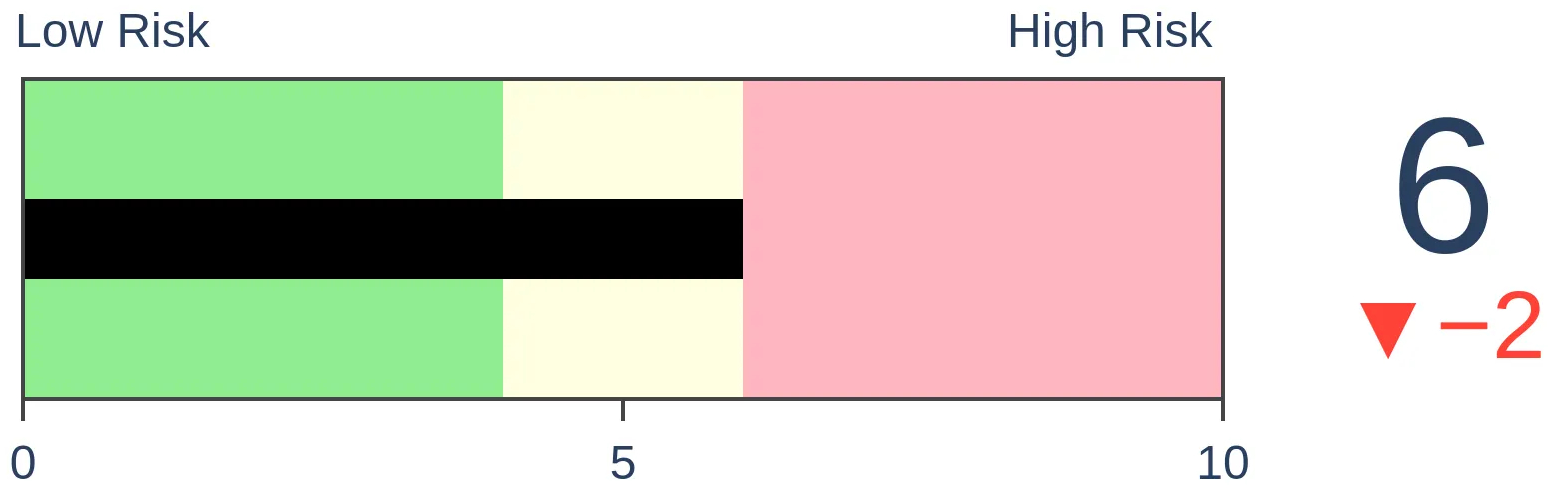
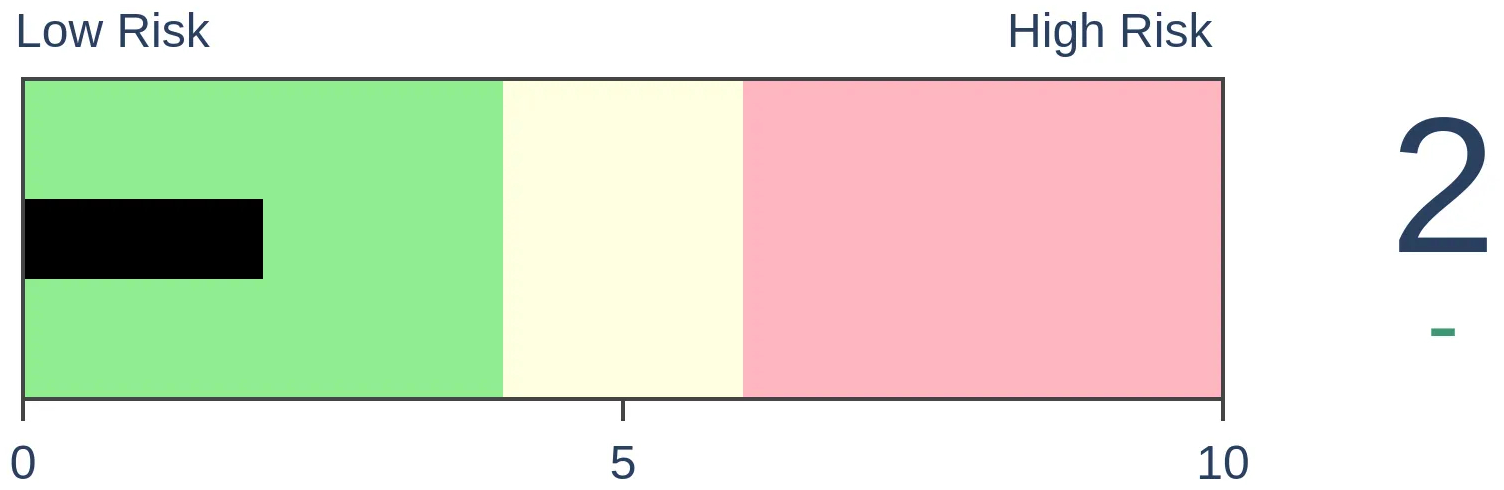
Risk Levels
Stocks Short-Term
|
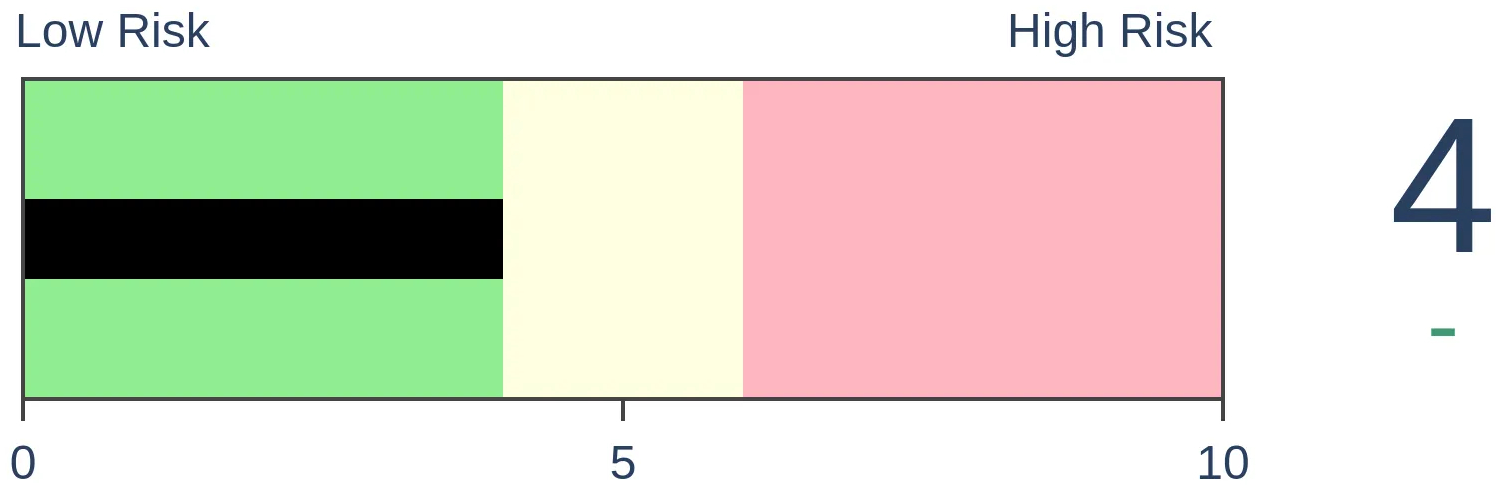
Stocks Medium-Term
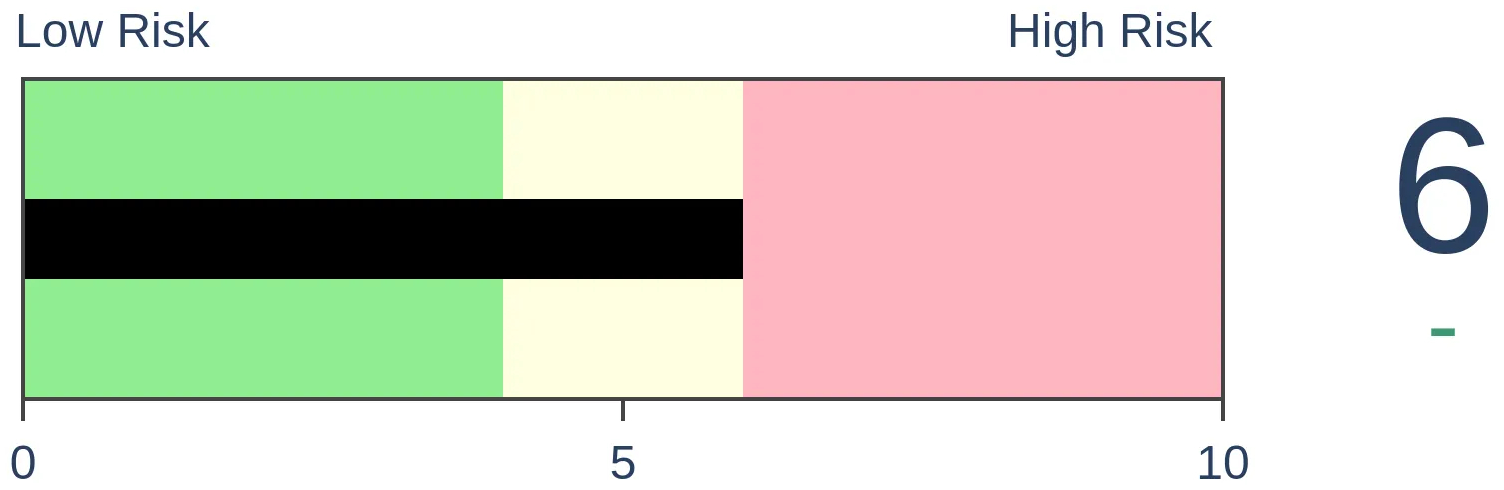
|
|
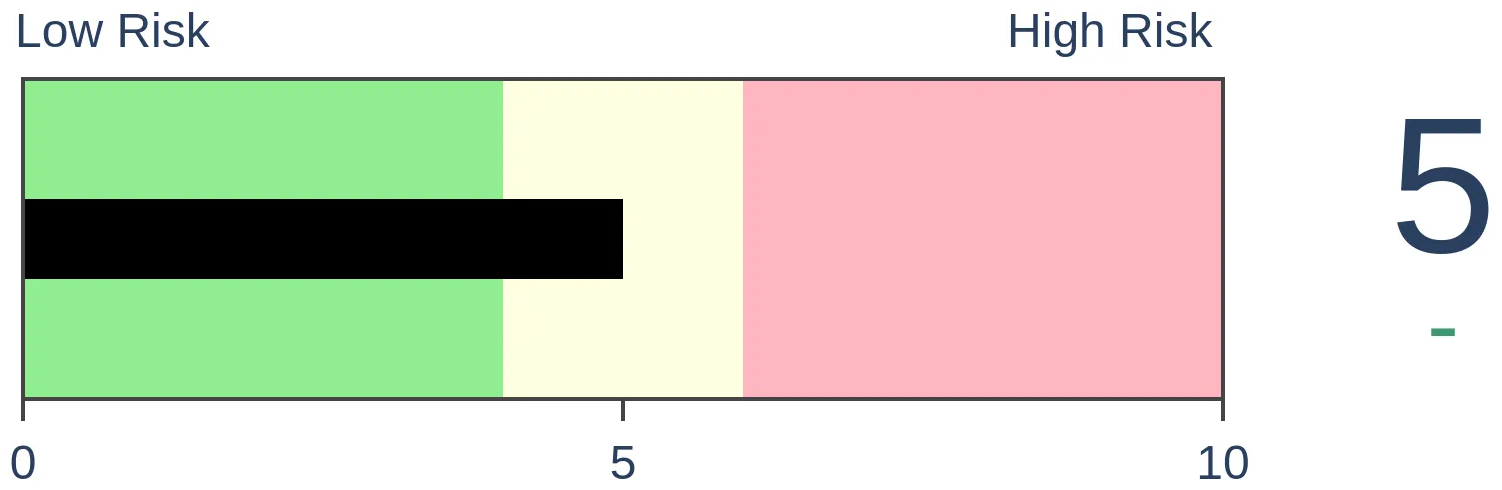
Bonds
|
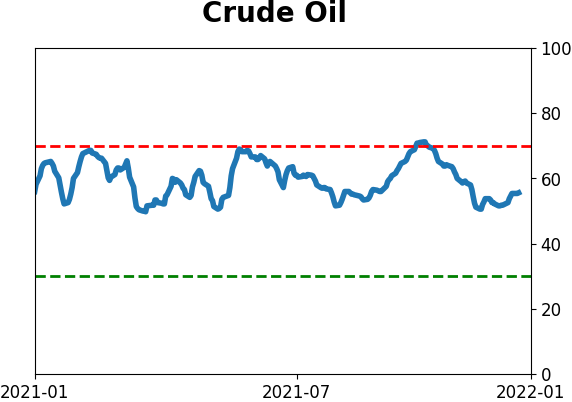
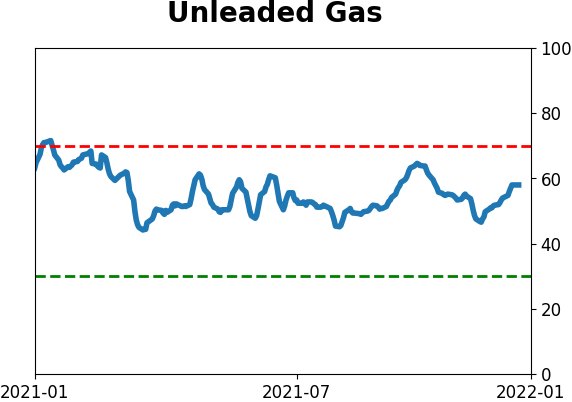
Crude Oil
|
|
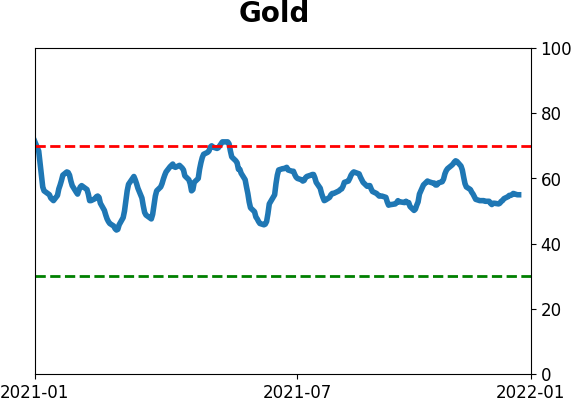
Gold
|
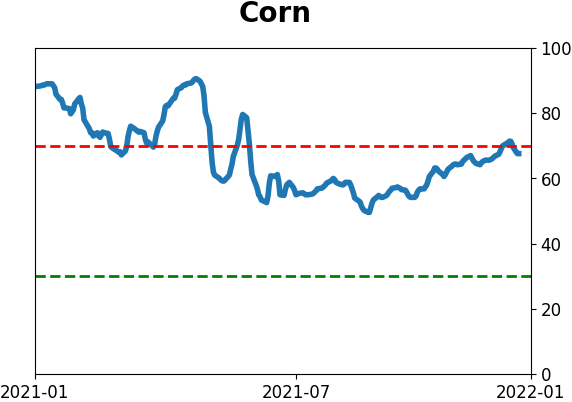
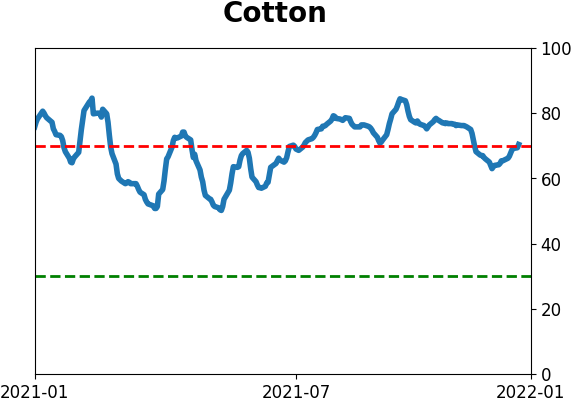
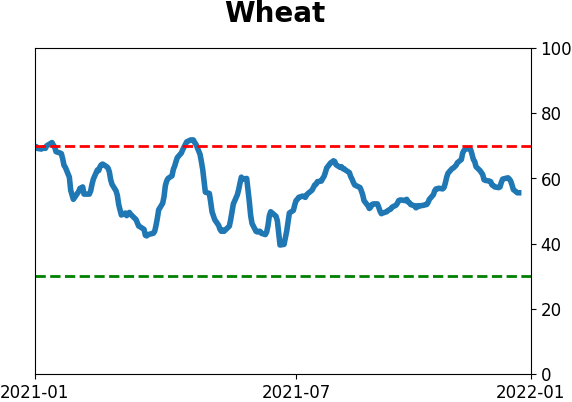
Agriculture

|
|
Research
By Jay Kaeppel
BOTTOM LINE
The S&P 500 Index gained 10.6% during the 4th quarter of 2021. Does this have any implications for the 1st quarter of 2022? This piece highlights the history of S&P 500 performance following particularly strong quarters.
FORECAST / TIMEFRAME
SPY -- Up, Medium-Term
|
Key points:
- The S&P 500 Index gained +10.6% during the 4th quarter of 2021
- Historically, a quarterly performance of +9% or more has been followed by another up quarter 84% of the time
Quarters up 9% or more
We define a quarter as any three months ending in March, June, September, or December.
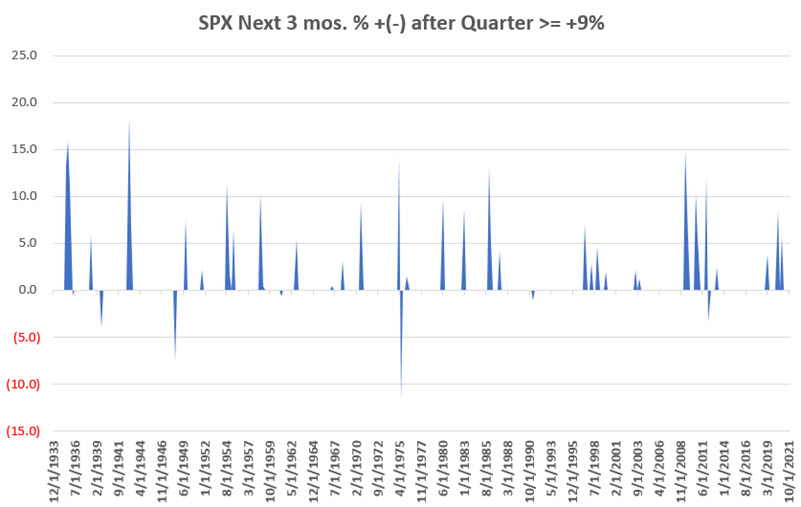
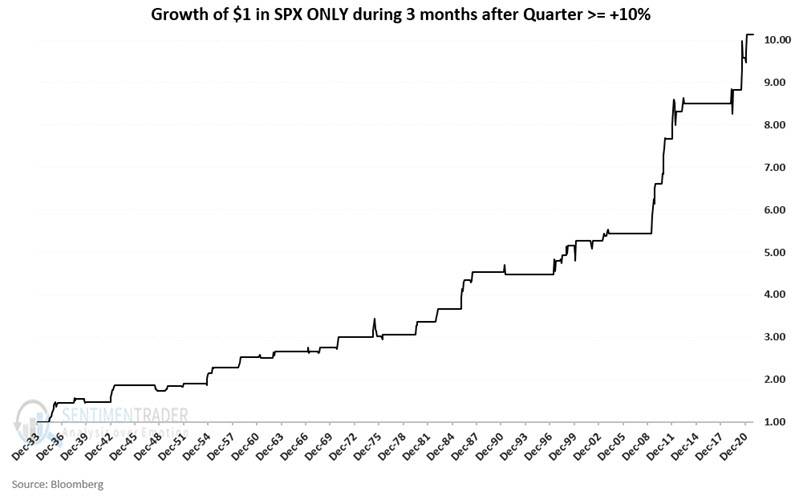
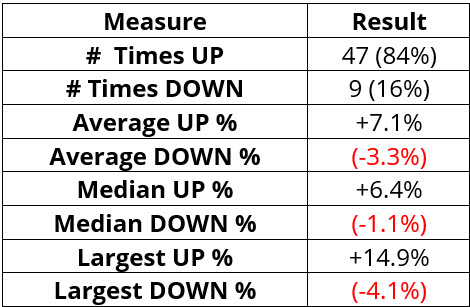
There have been 56 quarters that have seen the S&P 500 Index gain +9% or more in price since 1933. Forty-seven of those quarters were followed by another up quarter. Only nine times did the S&P 500 decline over the next quarter.
The chart below displays the quarterly performance for the S&P 500 following quarters of +9% or more.
The chart below displays the cumulative growth of $1 invested in the S&P 500 for three months after a +9% quarter.
The table below displays a summary of performance results.
What the research tells us…
Traders should not assume that the first quarter of 2022 is sure to show a gain for the S&P 500 Index. An 84% success rate is a powerful indication, but it does not guarantee success. Still, the latest signal suggests that as long as price action holds up, investors should continue to give the bullish case the benefit of the doubt.
By Jason Goepfert
BOTTOM LINE
A look at the years with the closest sector and factor performance to 2021 shows that 1996 led all years. Years with similar behavior preceded mostly good returns during the next year, with some evidence of mean-reversion among the sectors.
FORECAST / TIMEFRAME
None
|
Key points:
- There have been 15 years since 1928 with sector and factor performance similar to 2021
- After those years, the S&P 500 showed modest medium-term returns and decent long-term ones
- Defensive sectors showed better returns overall, as did Small-Cap stocks
The year most like 2021 was...1996
Near the end of the year, we looked at the S&P 500's closest analogs. In terms of pure price performance for the index itself, the highest-correlated year was 1995.
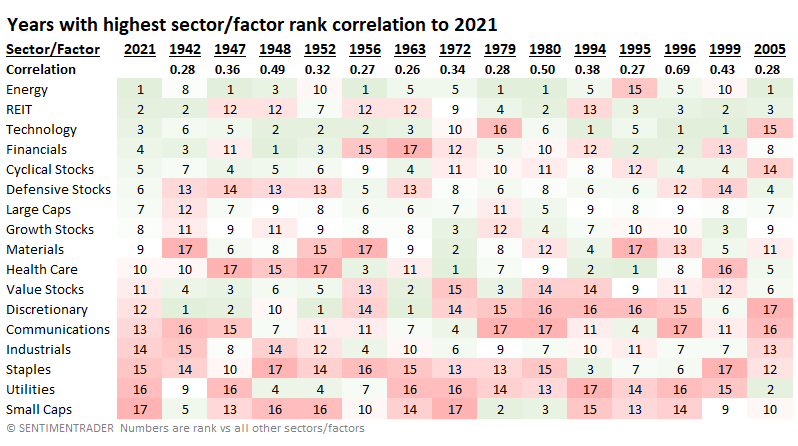
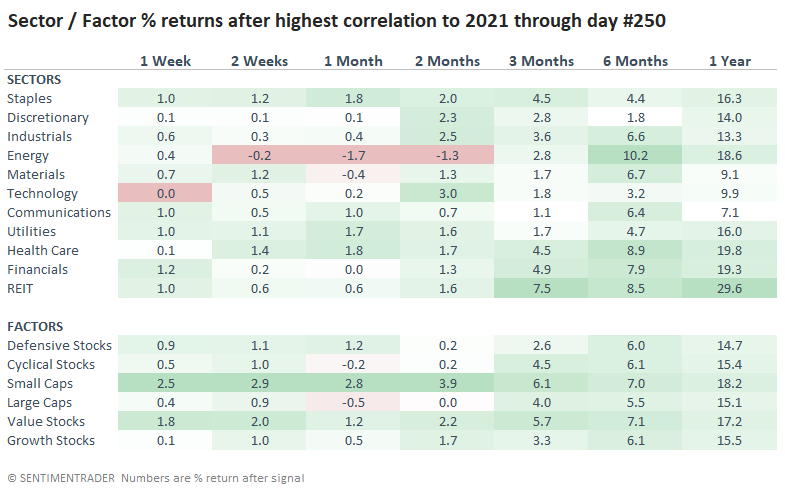
If we look at performance under the surface, things change a bit. In 2021, Energy and REITs were the highest-ranked sectors, while the Small-Cap factor took up the rear. This is using total return and ranked against the return of all other sectors and factors. In 1995, Health Care and Financials led everything else, though Small-Caps were still weak.
Using the correlation between sector and factor ranks, 1995 doesn't show up as the closest correlation (+0.27 out of a scale from -1.0 to +1.0). That honor belongs to the following year (0.69). Most sectors/factors with high (green) and low (red) rankings in 2021 showed similar rankings in 1996.
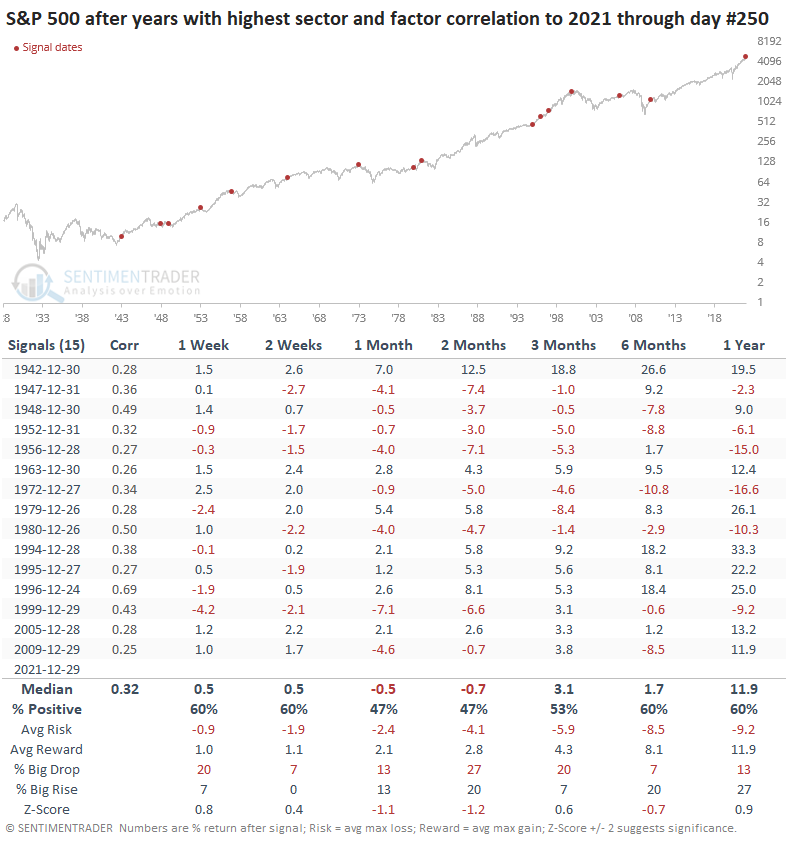
Like we saw with the S&P analog, years with the highest sector and factor correlations to 2021 showed strength in the first couple of weeks, then less so.
Some signs of sector mean-reversion
For the sectors and factors themselves, there was some evidence of mean-reversion. Energy stocks were the weakest performers over the next couple of months, while Small-Cap stocks were the strongest. Perpetually suffering Value stocks showed admirable performance as well.
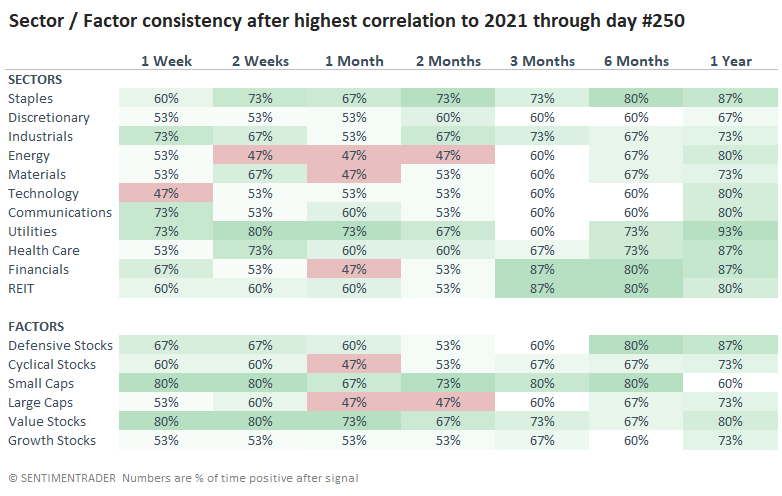
Looking at the consistency of returns - how often the sectors and factors showed a positive return across time frames - there was a bias toward some of the more defensive sectors while higher-beta ones suffered a bit.
What the research tells us...
Bulls might take heart that the price behavior and sector returns most like 2021 can be found in the mid-1990s, right before one of the best runs in equity market history. About the only negatives when looking at similar years were relatively soft returns through February/March but few of them saw more than double-digit drawdowns, at least through the next 6 months.
Active Studies
| Time Frame | Bullish | Bearish | | Short-Term | 2 | 0 | | Medium-Term | 12 | 2 | | Long-Term | 10 | 4 |
|
Indicators at Extremes
Portfolio
| Position | Description | Weight % | Added / Reduced | Date | | Stocks | RSP | 35.9 | Added 25.2% | 2022-01-03 | | Bonds | 32.7% BND, 7.1% SCHP | 39.8 | Added 8.3% | 2021-10-26 | | Commodities | GCC | 2.4 | Reduced 2.1%
| 2020-09-04 | | Precious Metals | GDX | 4.6 | Reduced 4.2% | 2021-05-19 | | Special Situations | 9.8% KWEB, 4.7% XLE, 2.9% PSCE | 17.3 | Added 9.78% | 2021-10-01 | | Cash | | 0.1 | | |
|
Updates (Changes made today are underlined)
Coinciding with the new year, there was a thrust in participation in the S&P 500 near the end of December. Thrusts have been among the most consistent signals over the decades, and this is hard to ignore. I have greater confidence in thrusts when coming off extreme pessimism, like the spring of 2020, as opposed to near all-time highs on low volume. Still, it's hard to justify not being at least neutral weight stocks given this behavior. Bond sentiment is trying to recover from a recent bout of pessimism, and gold stocks are doing their thing which is not much at all. They've been flat for six months. Chinese tech stocks were doing exactly what they're supposed to do, then did *not* by plunging to new lows. This is troubling on a shorter-term time frame, but this was never meant for a trade, rather a multi-year investment. Recent behavior is troubling and I will not be adding any exposure as long as that's the case. RETURN YTD: +0.3% 2020: +8.7%, 2020: +8.1%, 2019: +12.6%, 2018: +0.6%, 2017: +3.8%, 2016: +17.1%, 2015: +9.2%, 2014: +14.5%, 2013: +2.2%, 2012: +10.8%, 2011: +16.5%, 2010: +15.3%, 2009: +23.9%, 2008: +16.2%, 2007: +7.8%
|
|
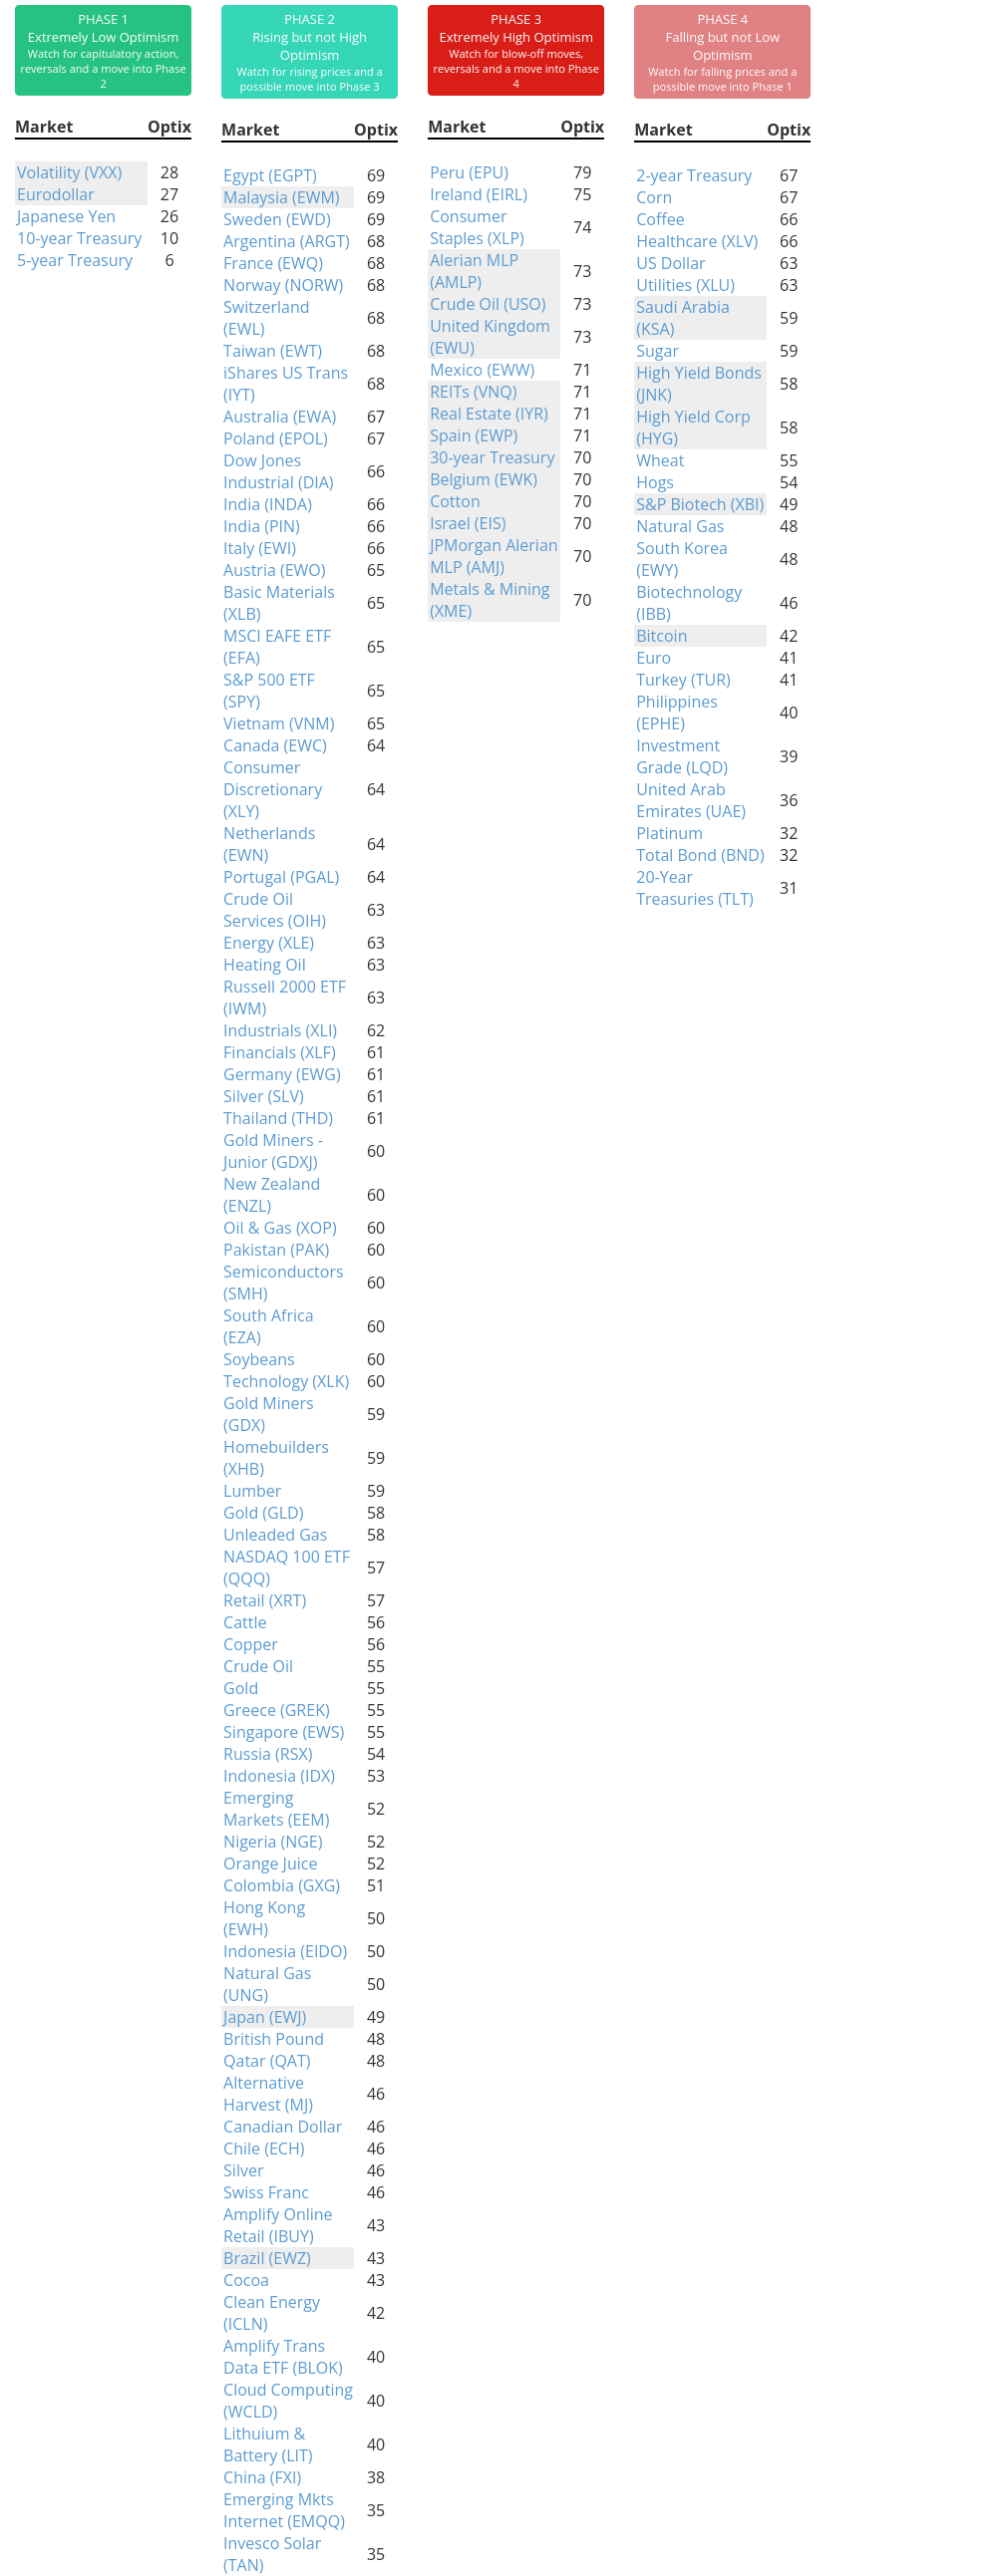
Phase Table
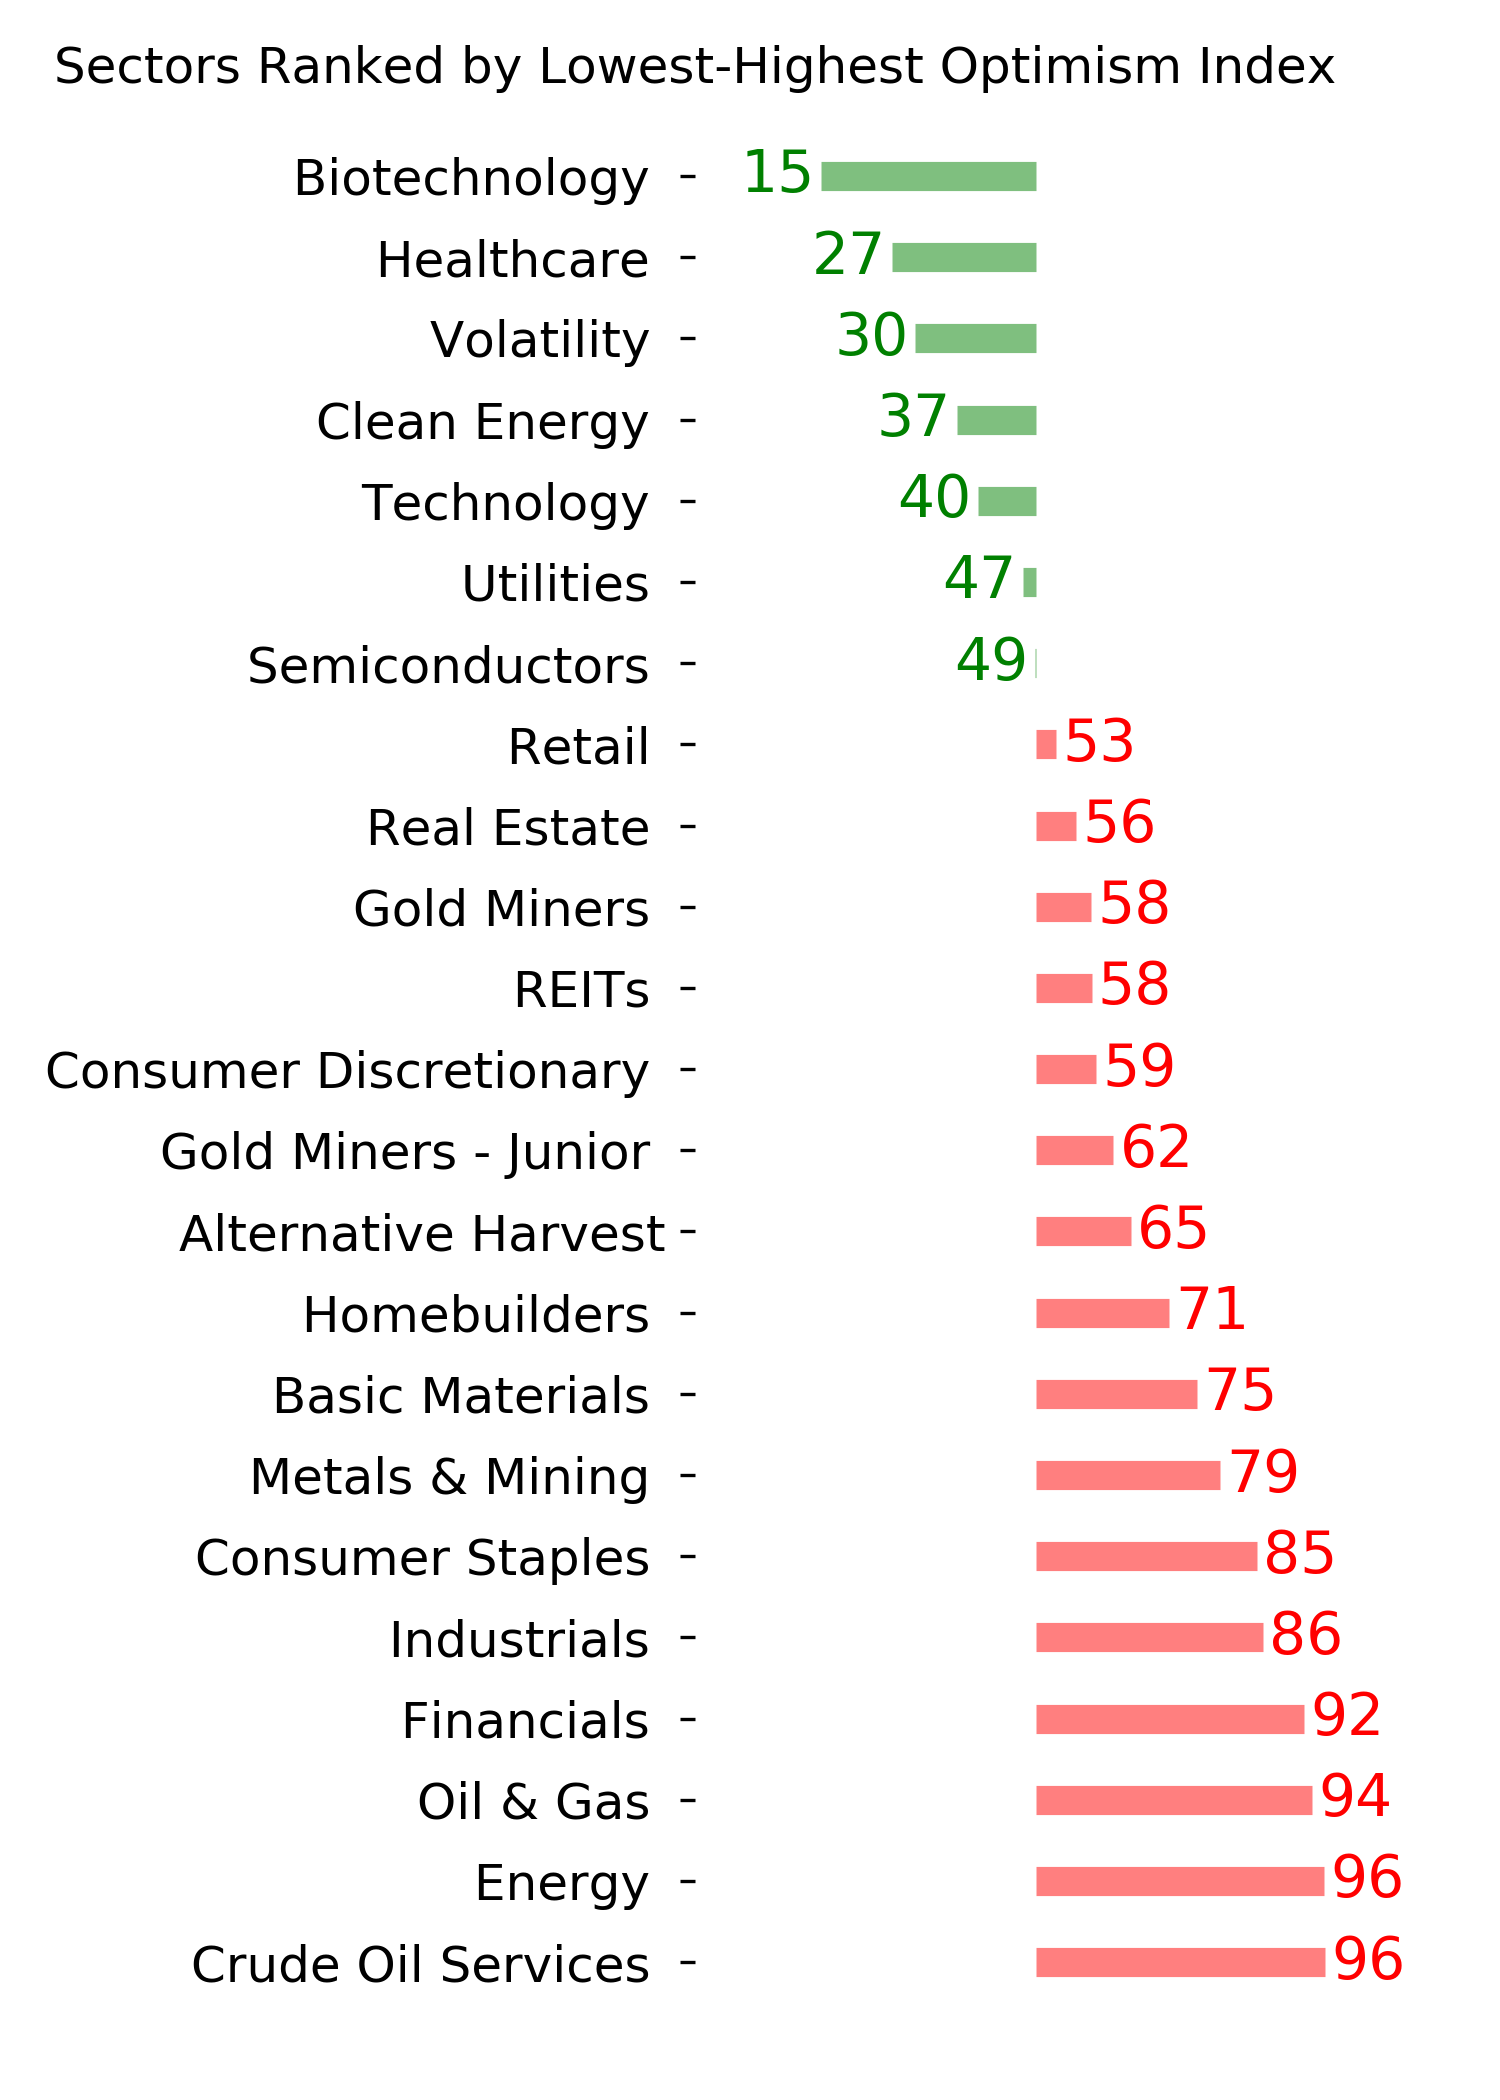
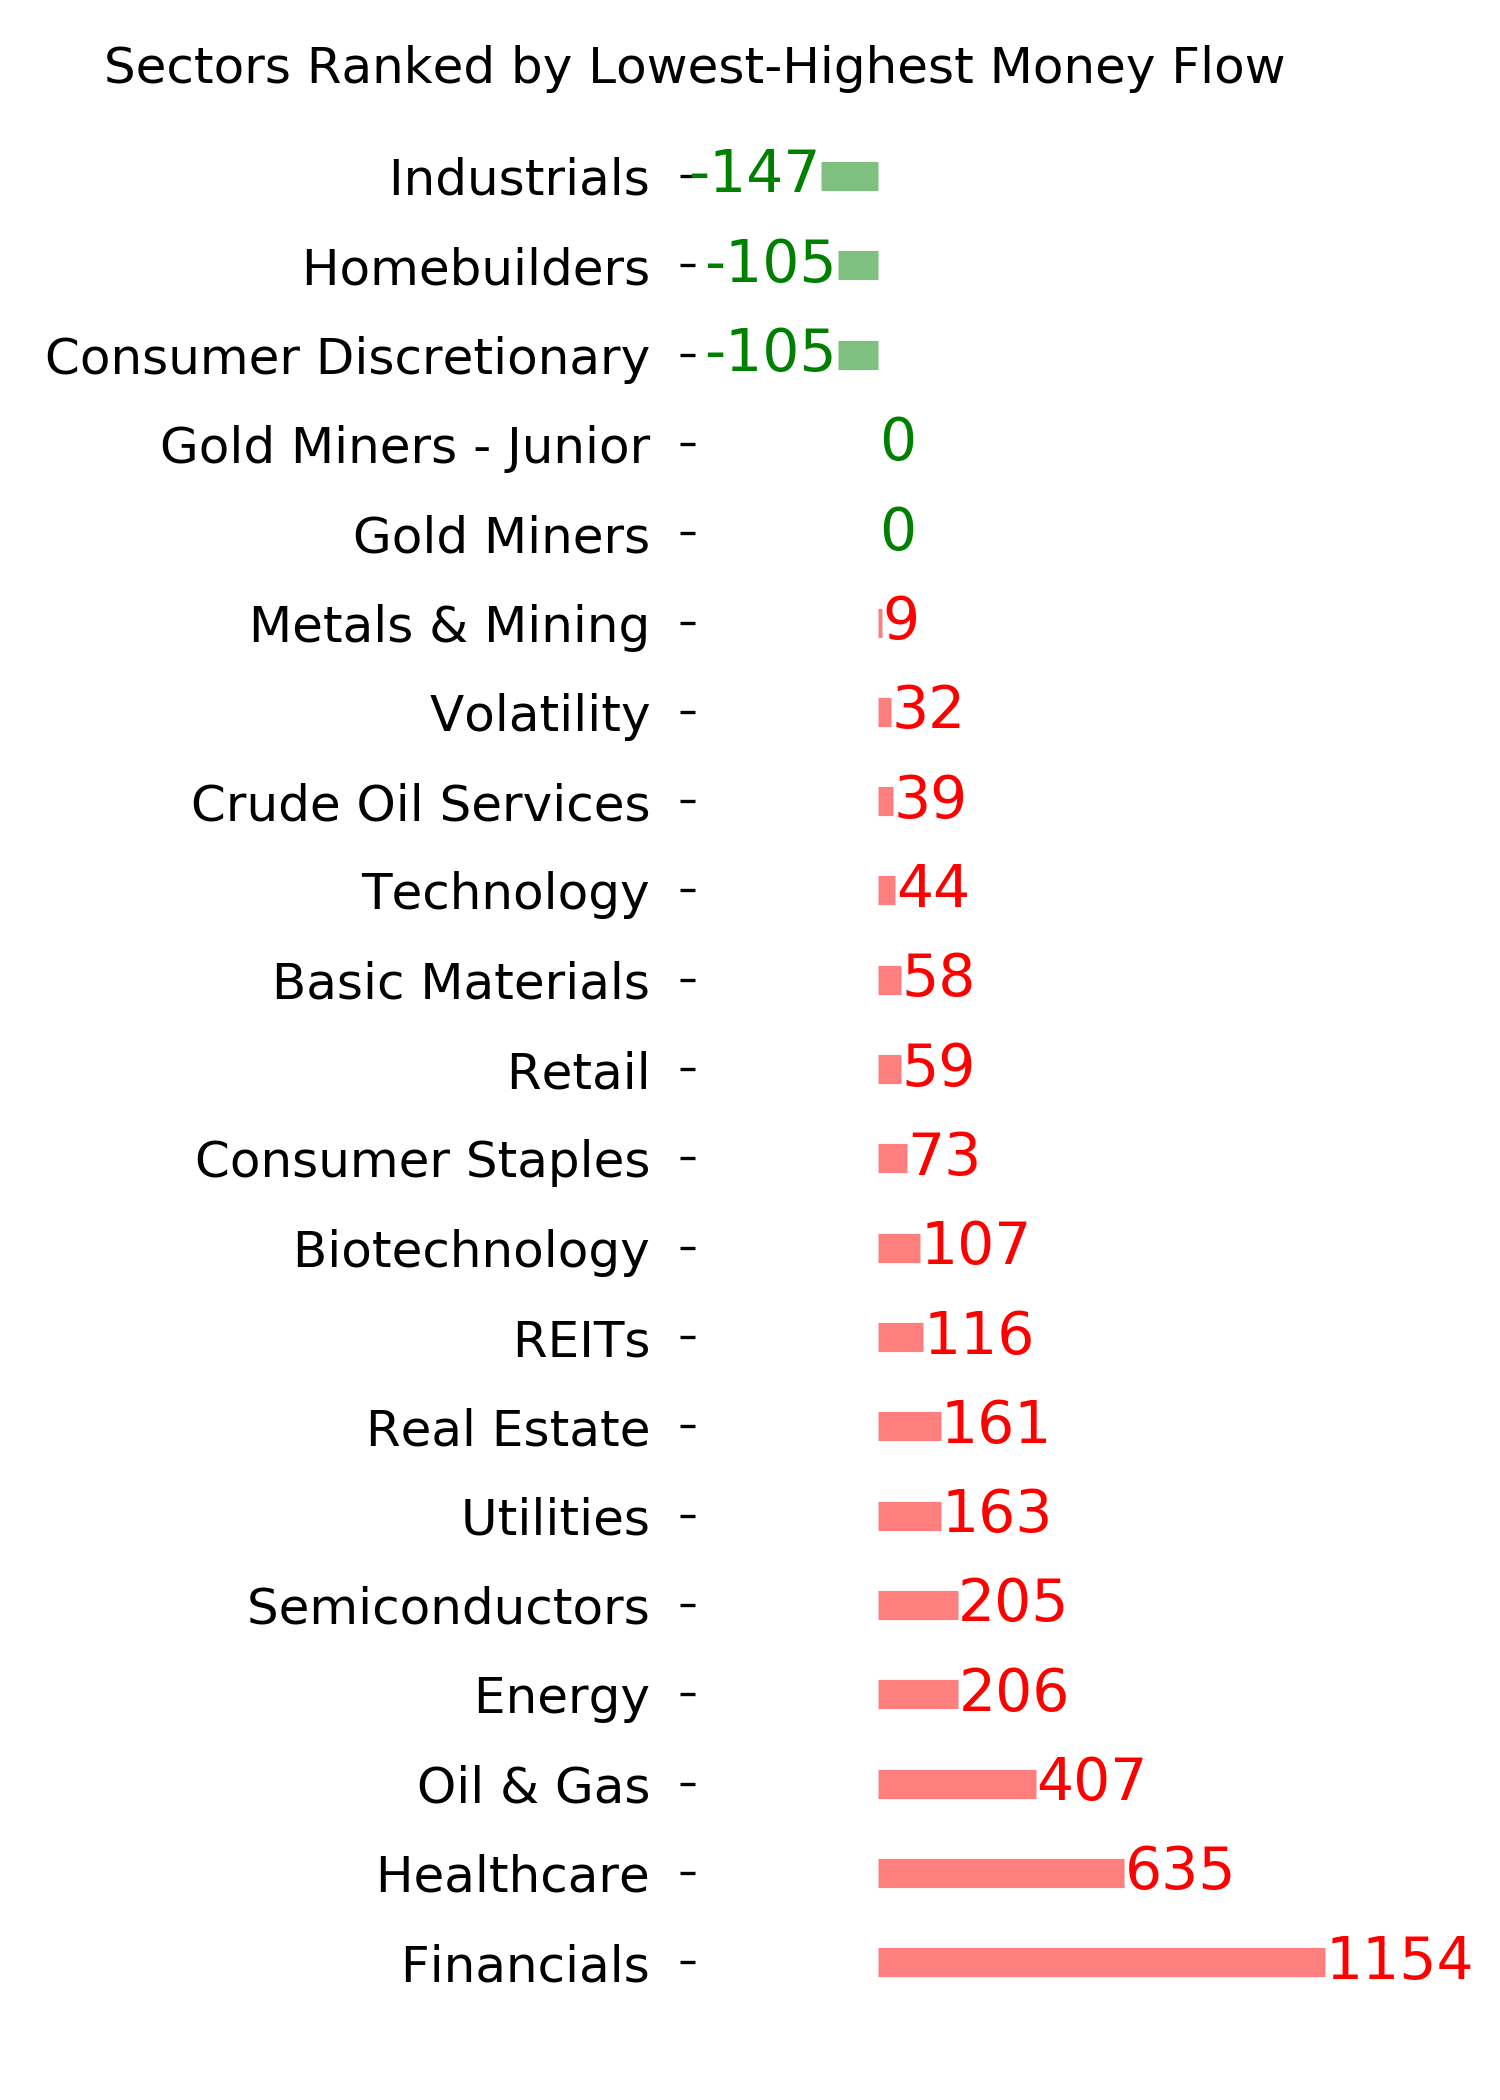
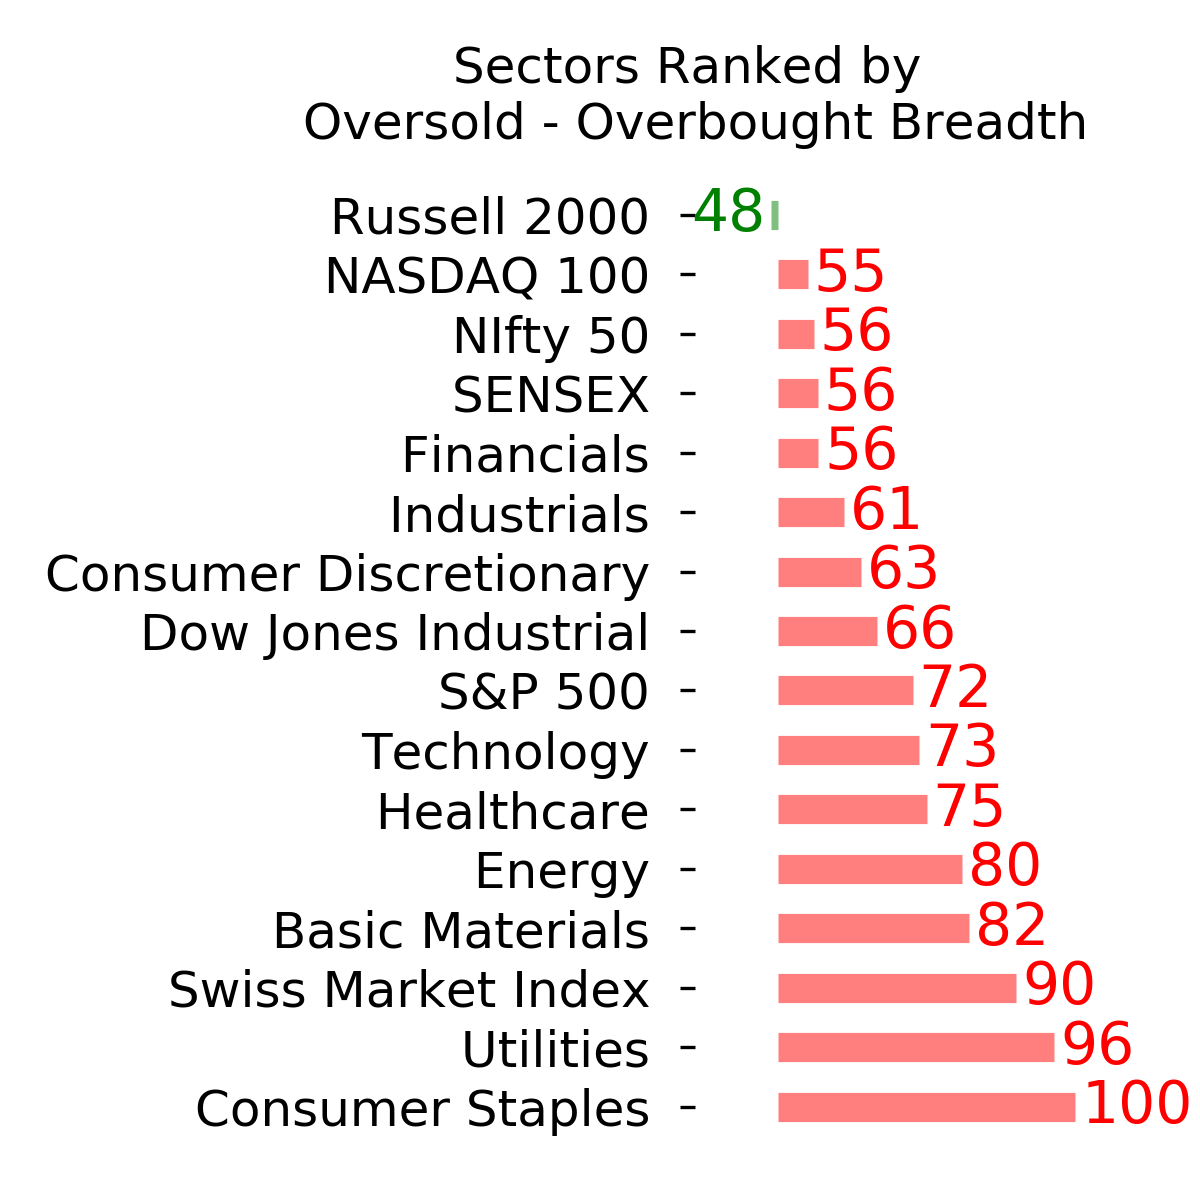
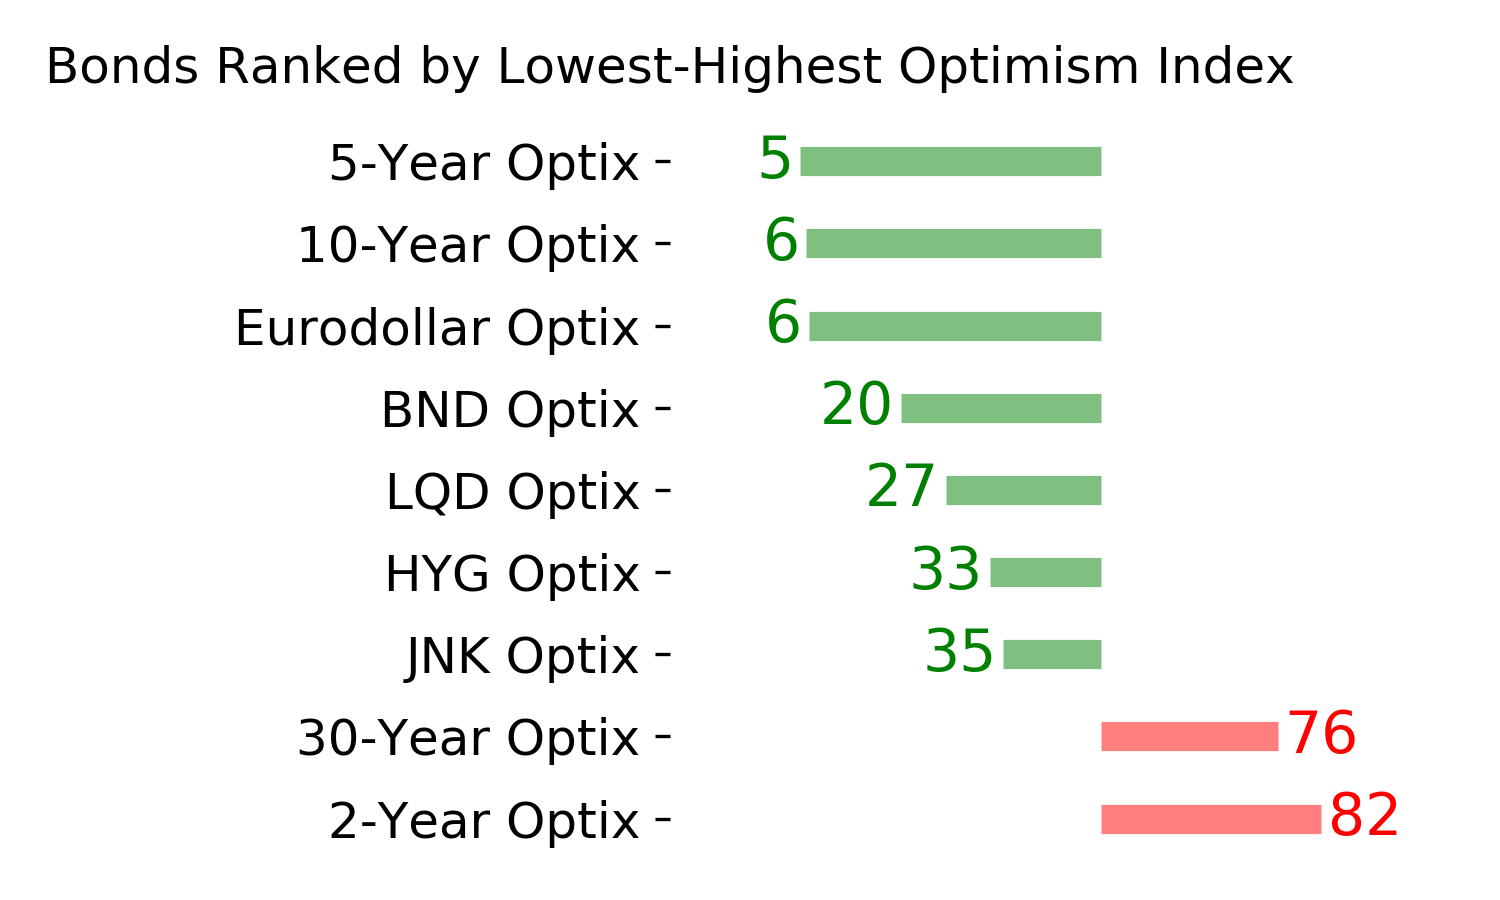
Ranks
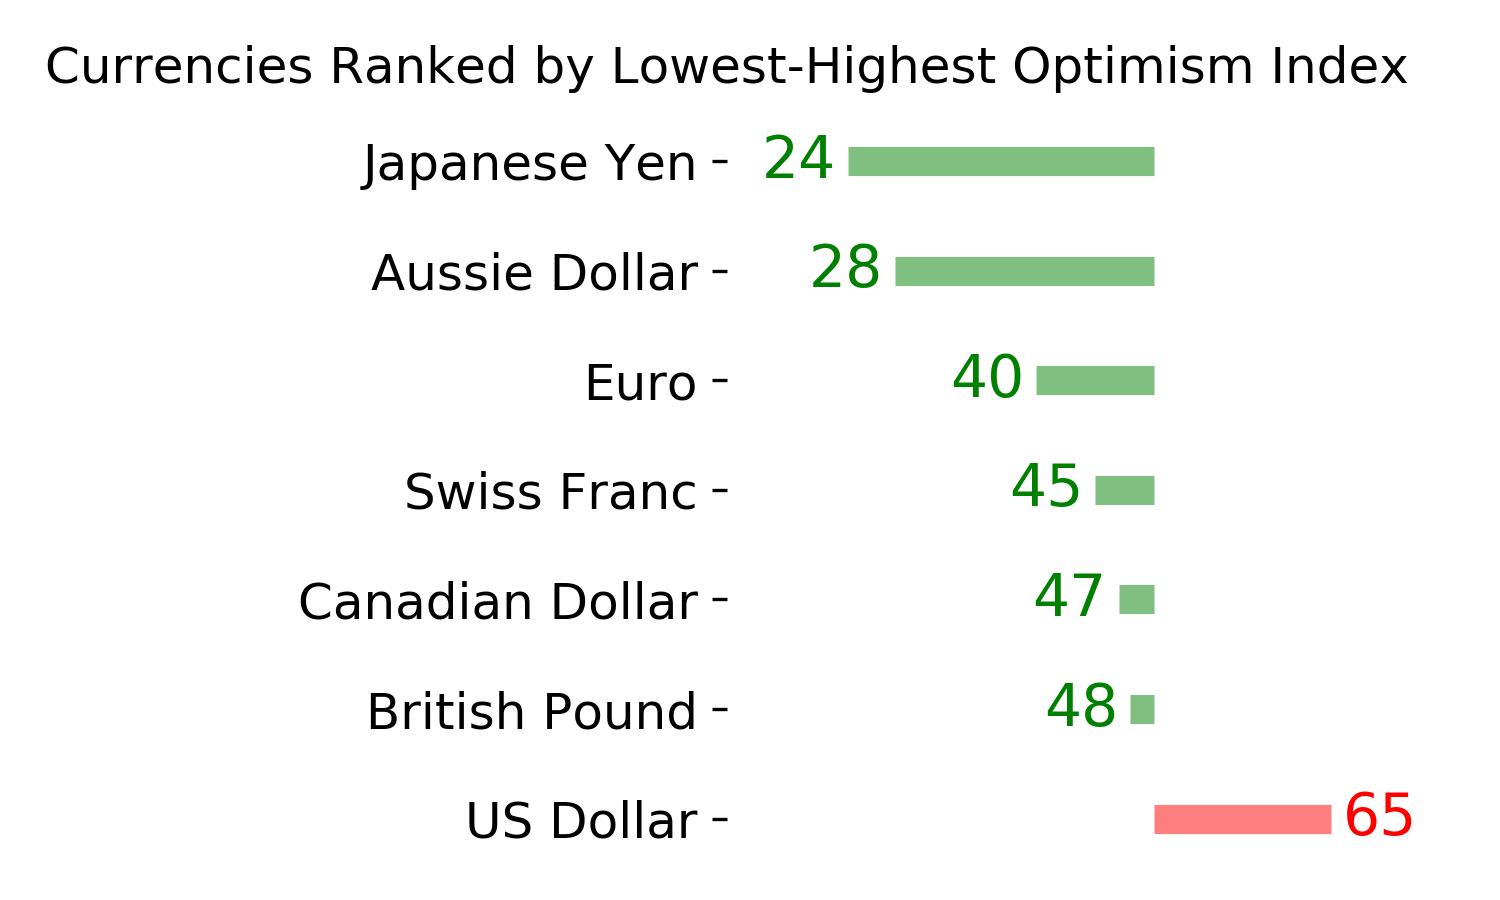
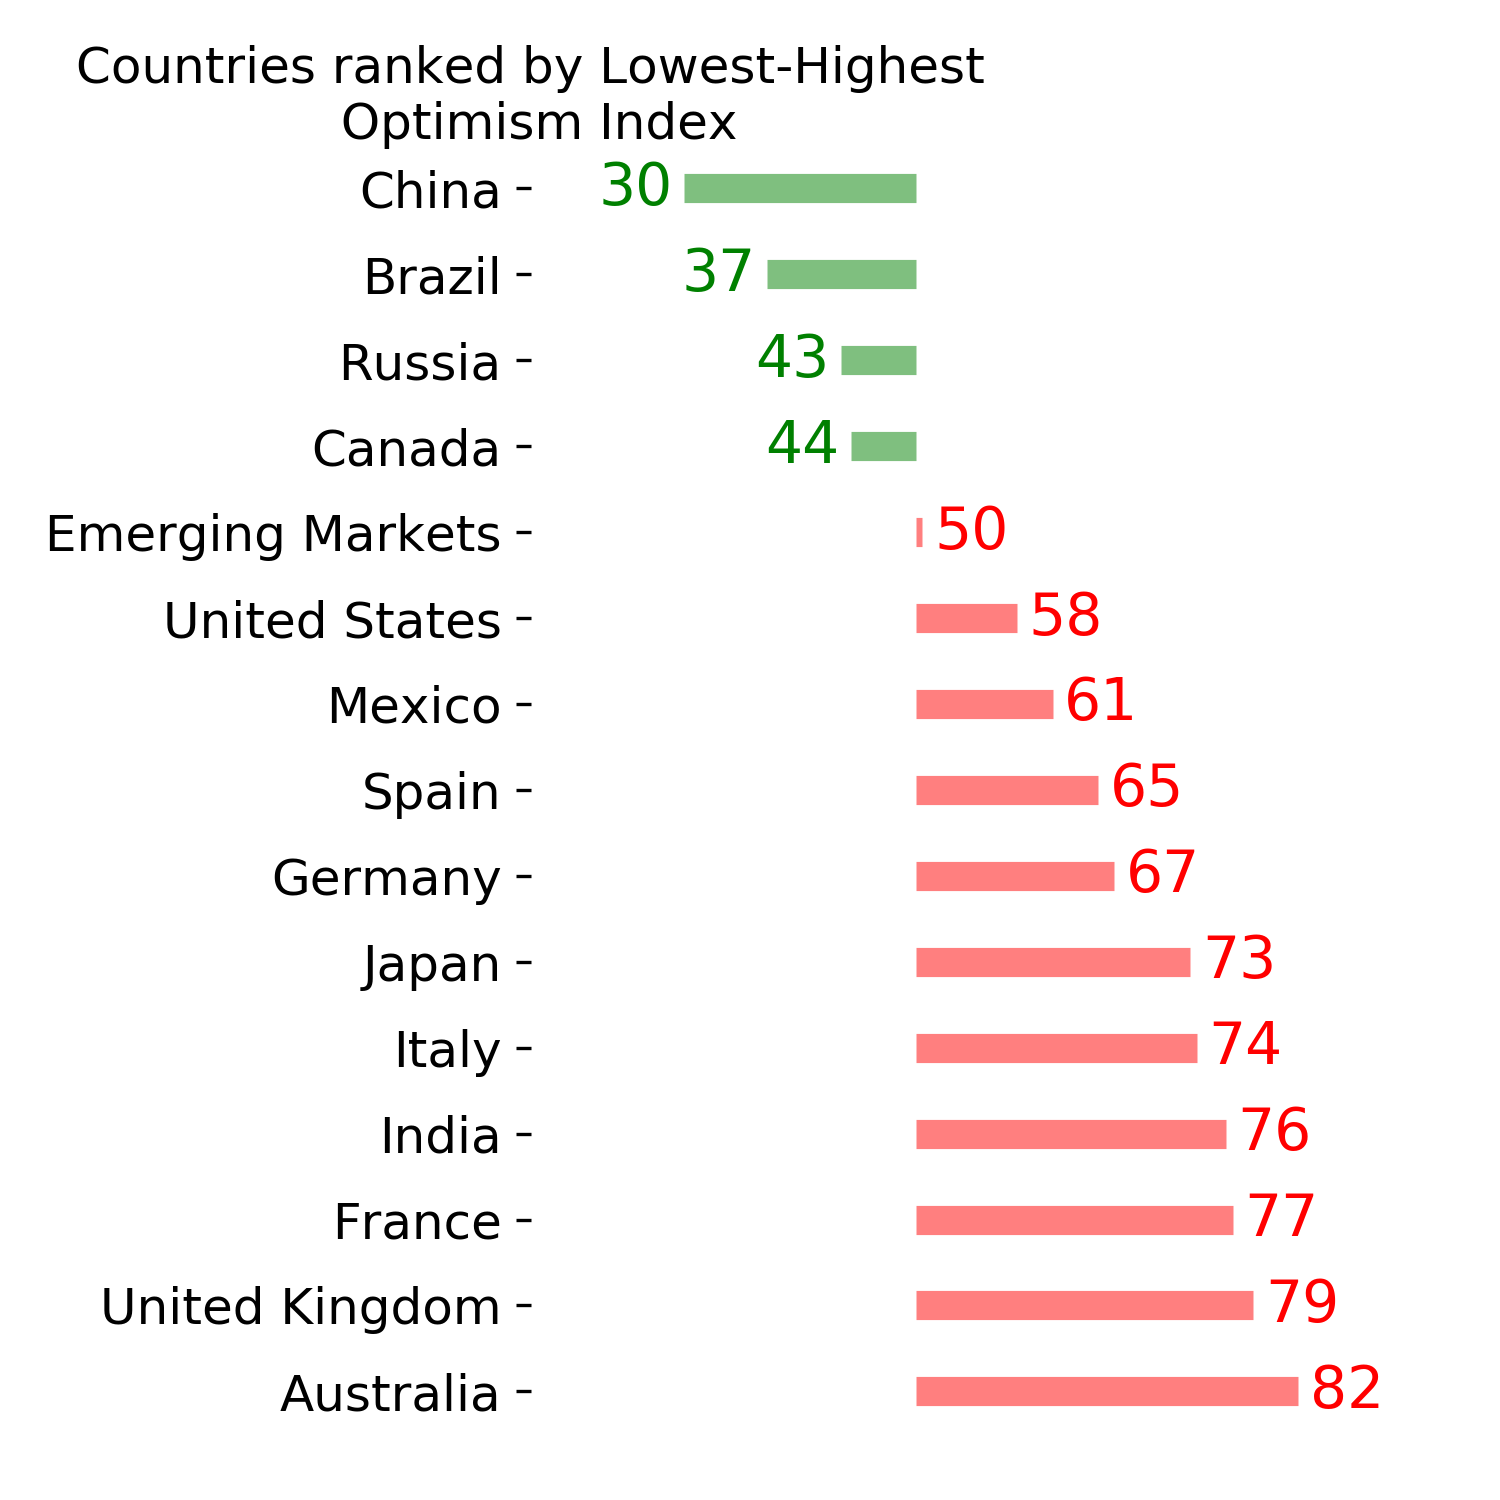
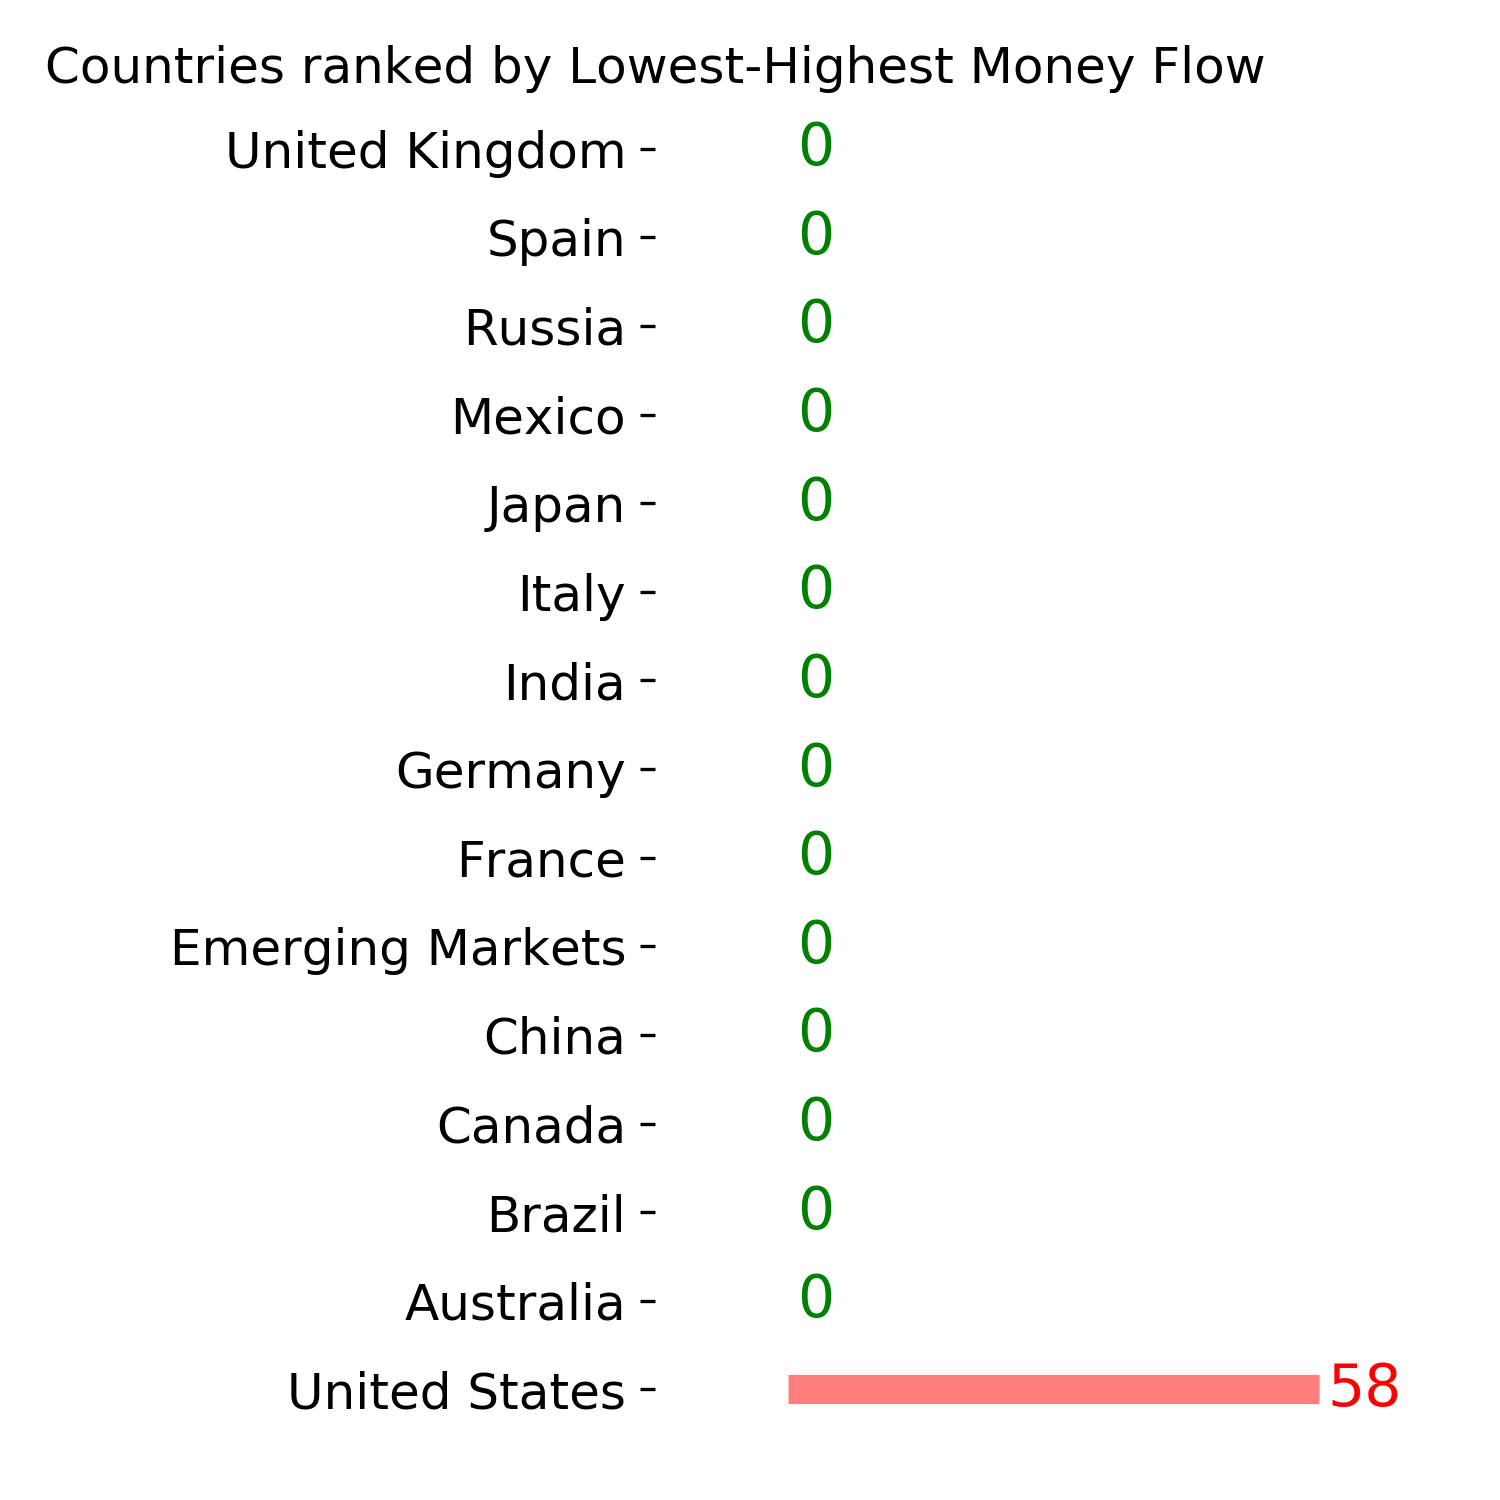
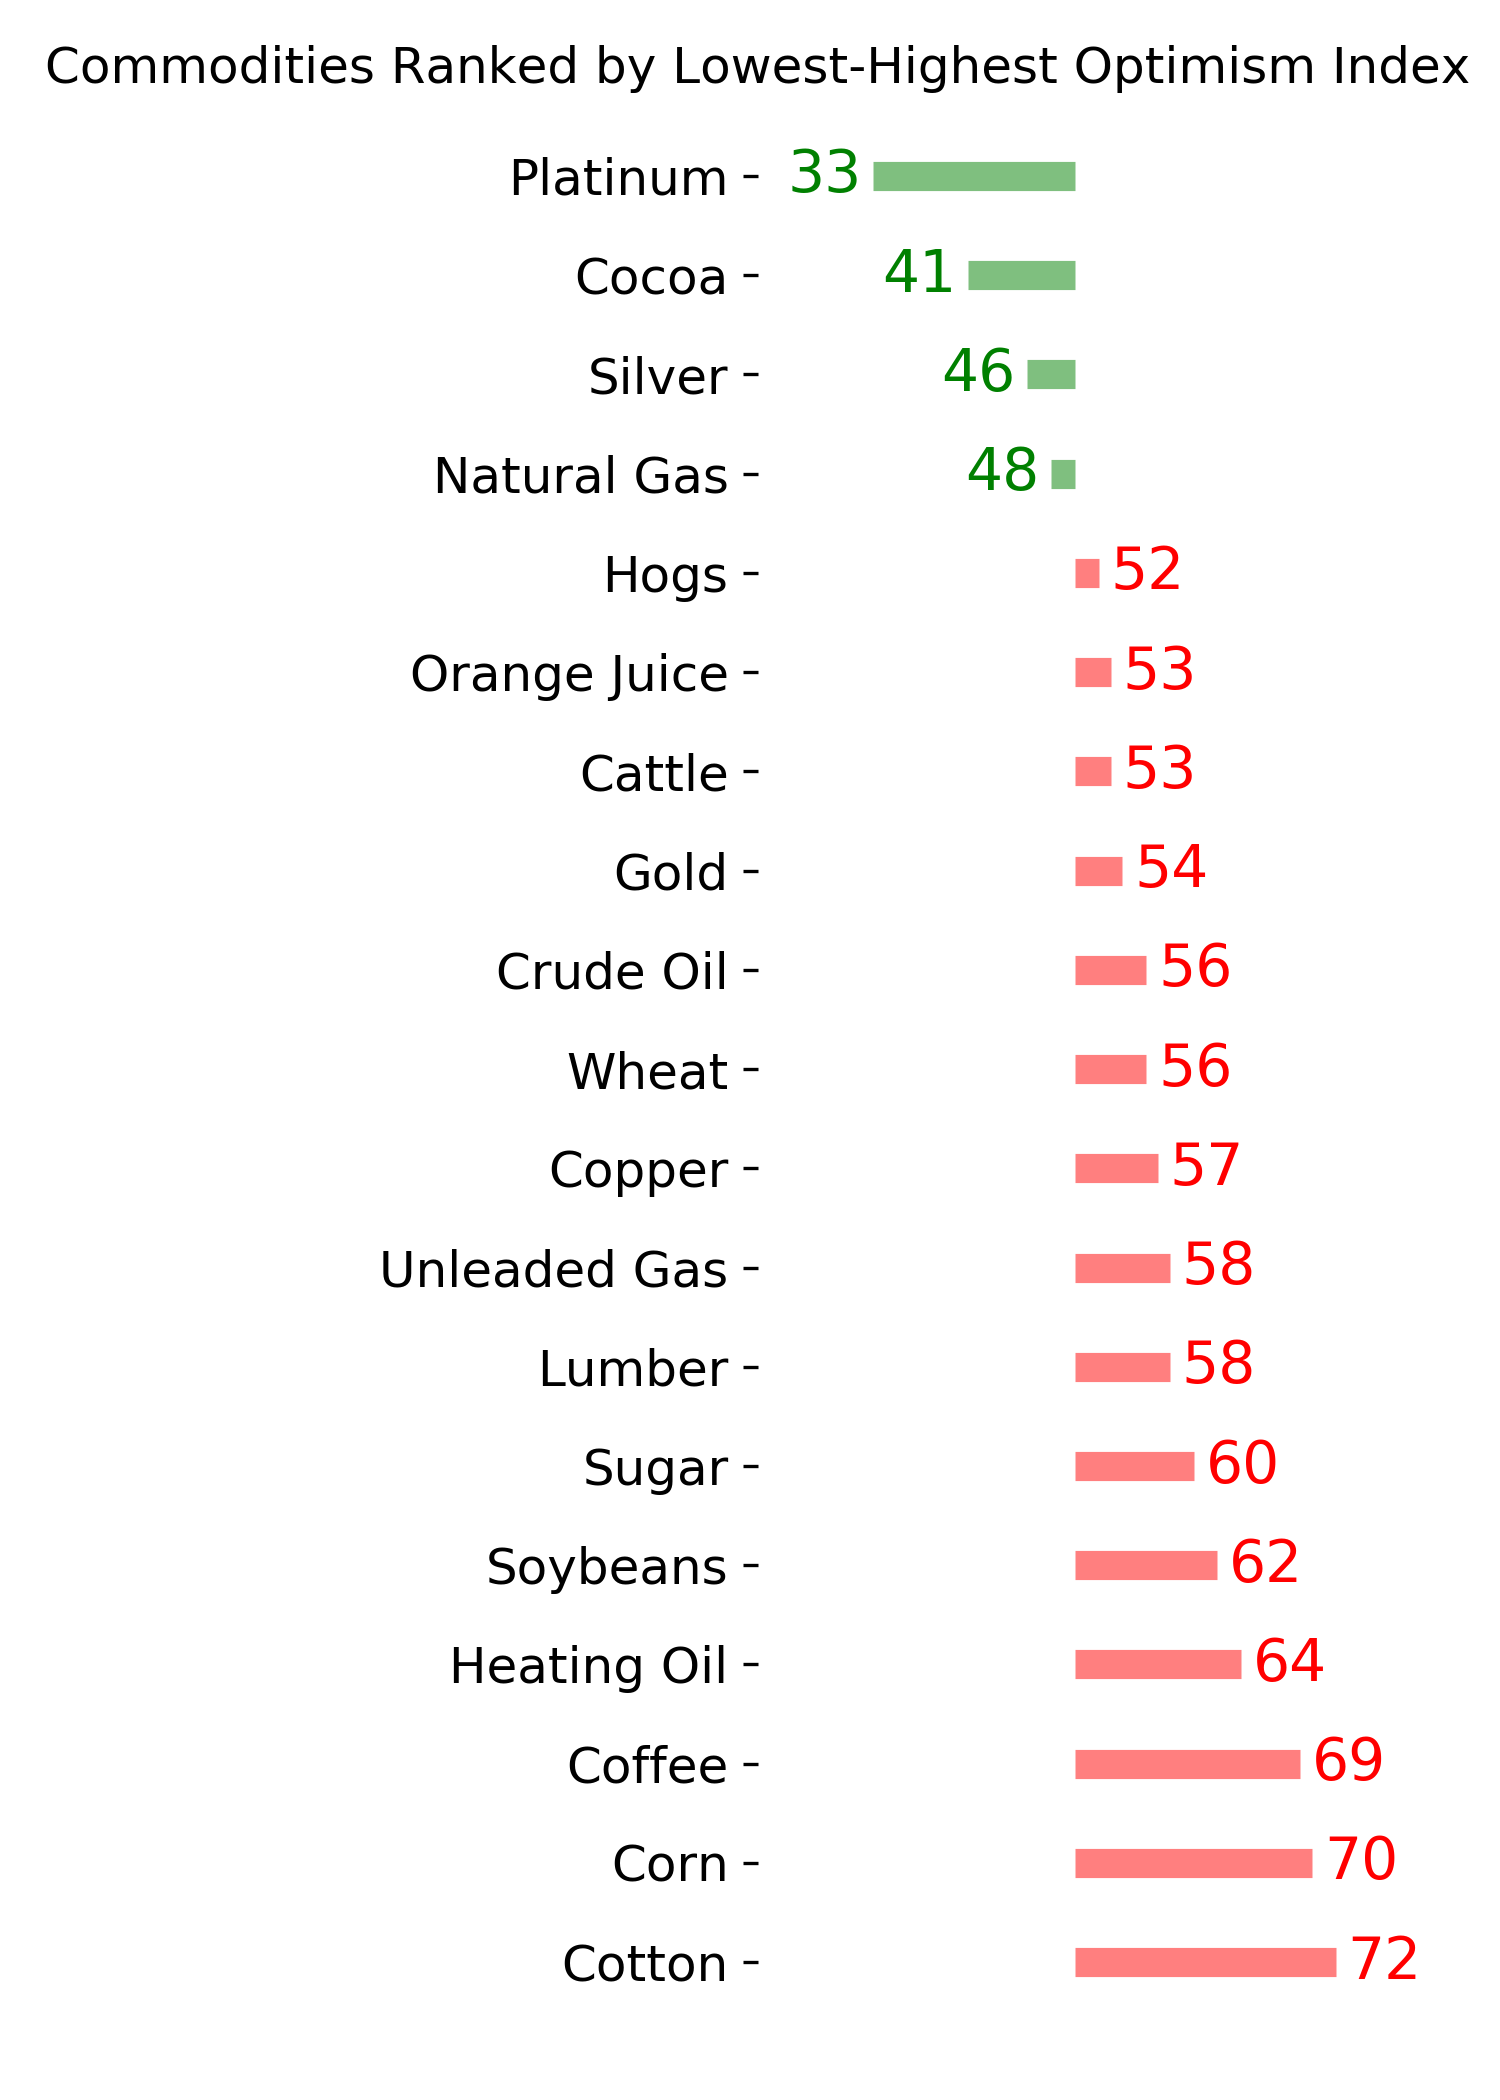
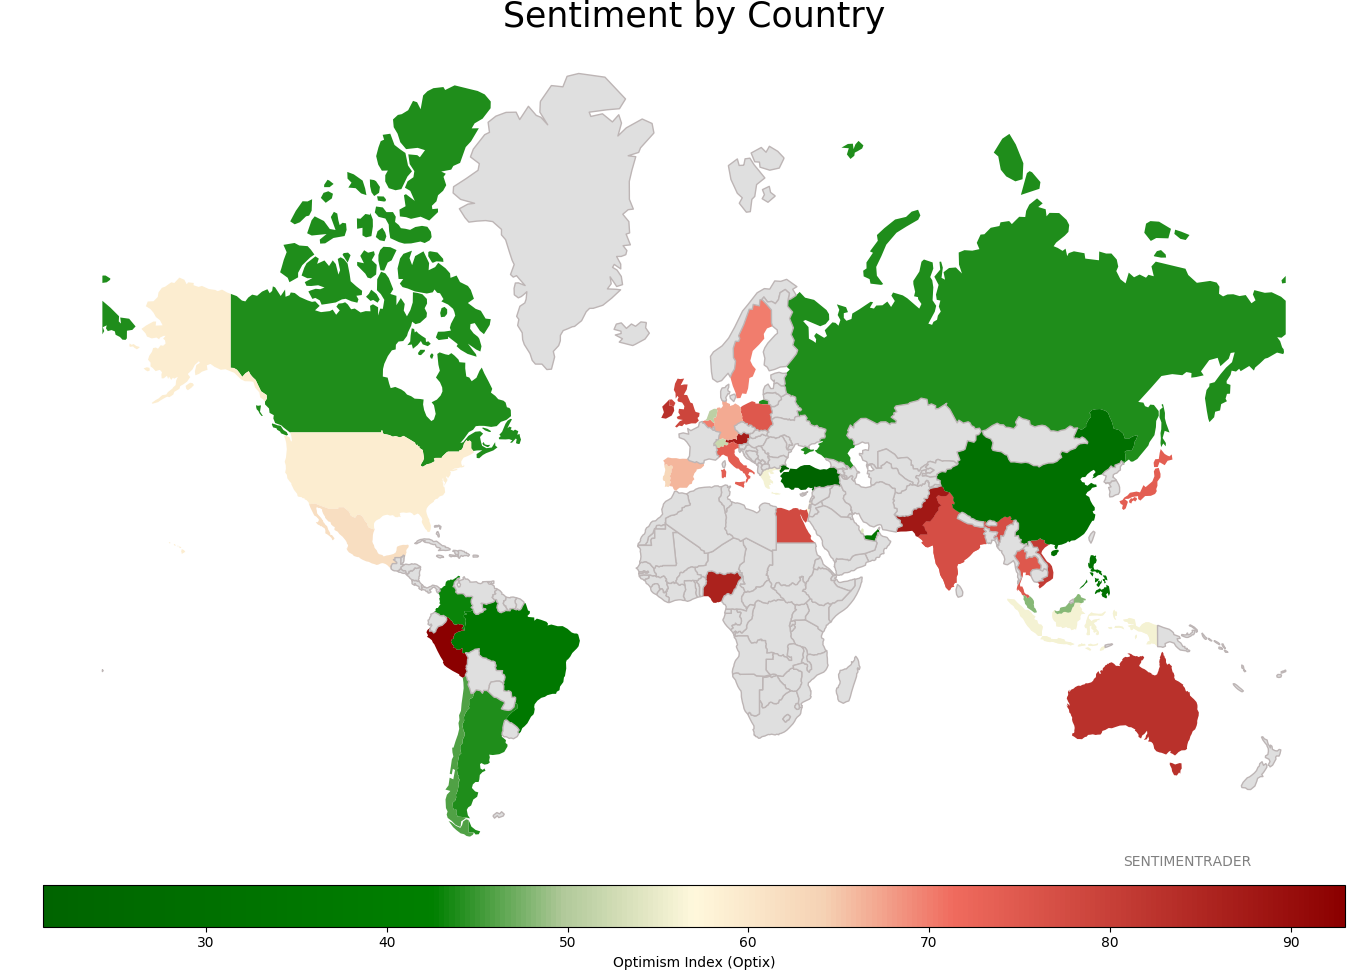
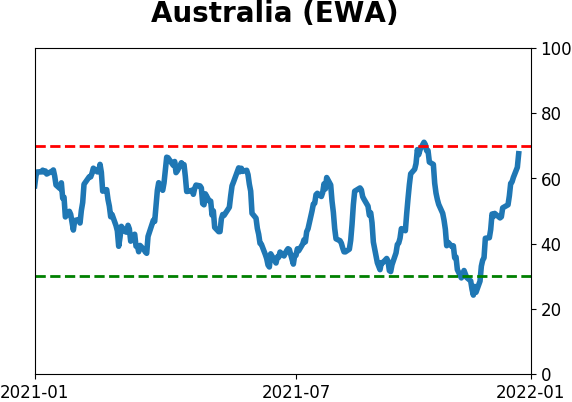
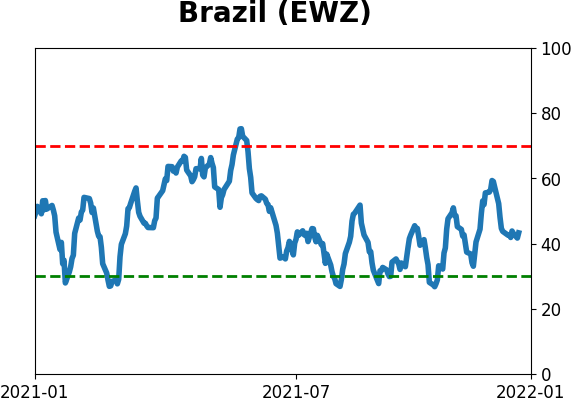
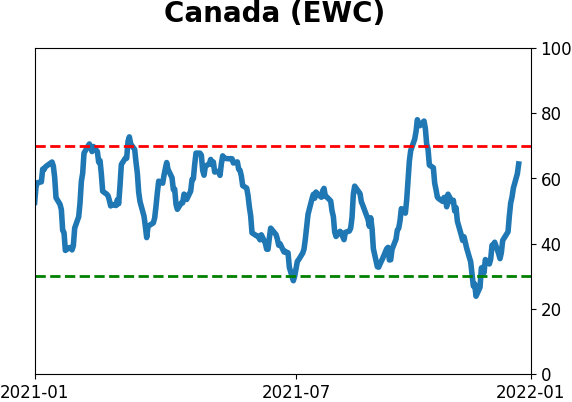
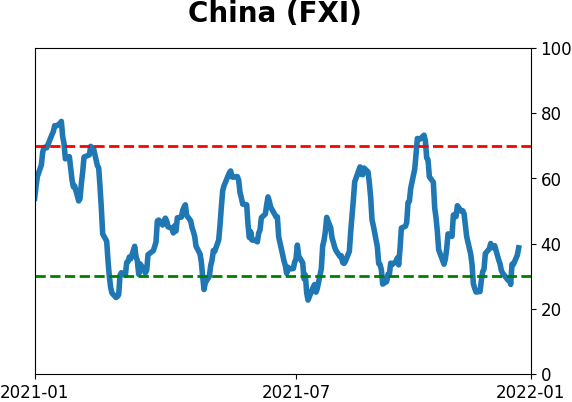
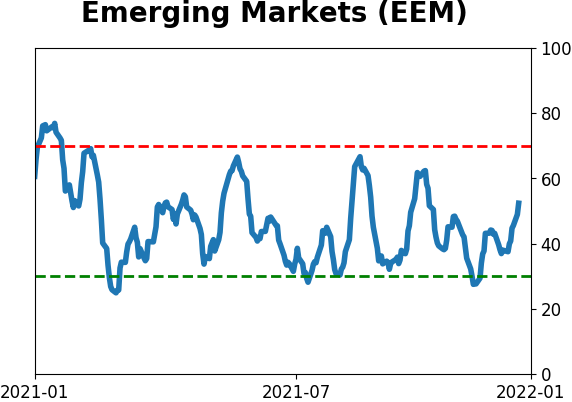
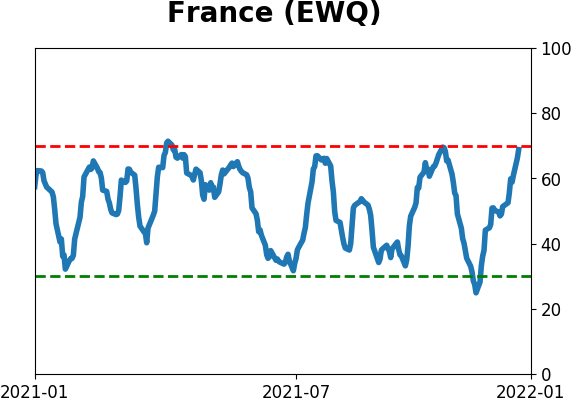
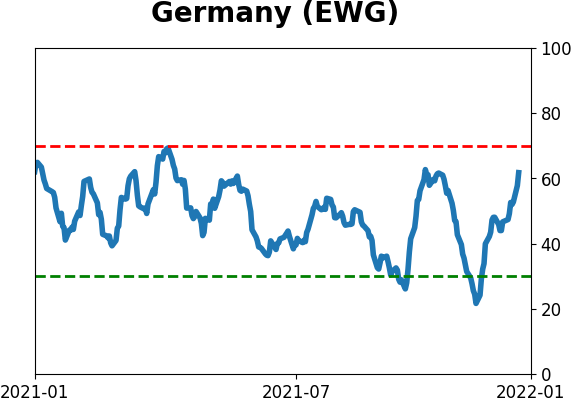
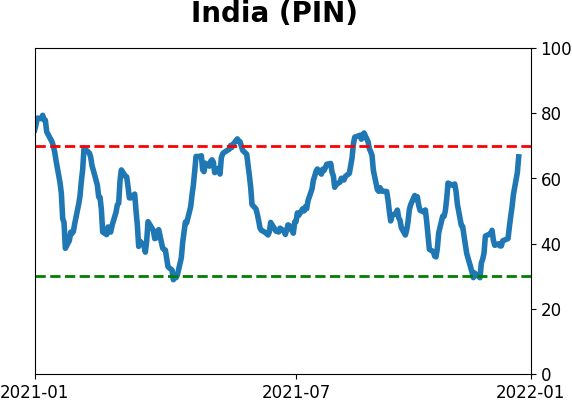
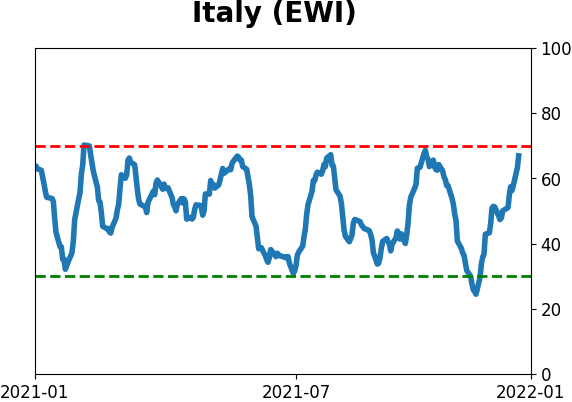
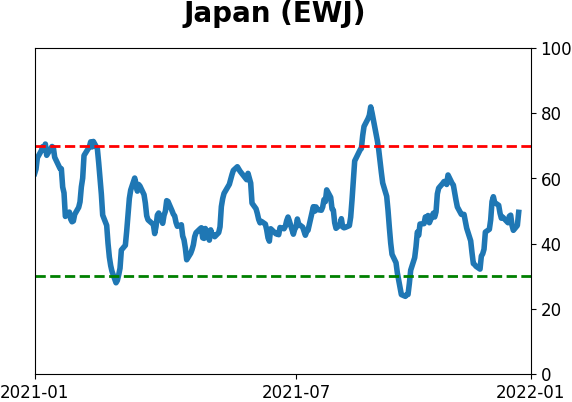
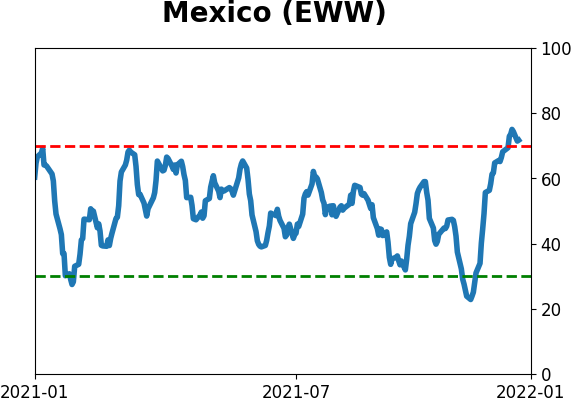
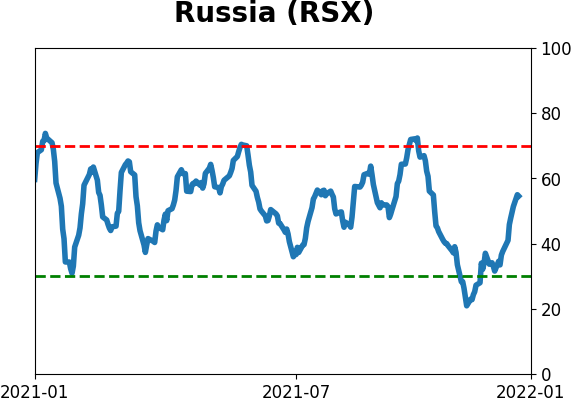
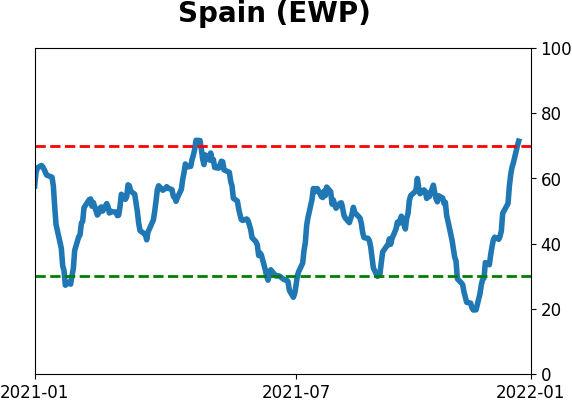
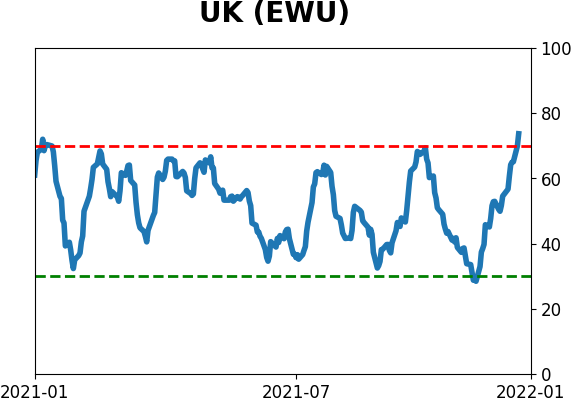
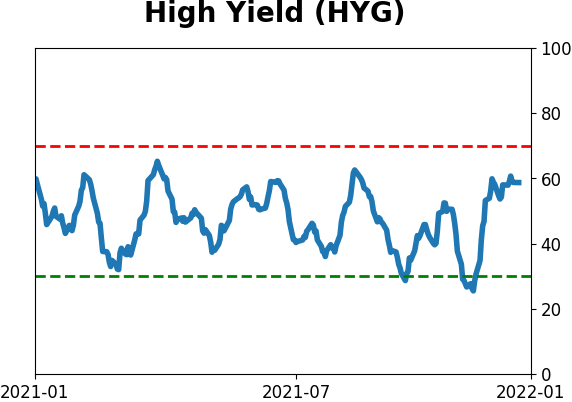
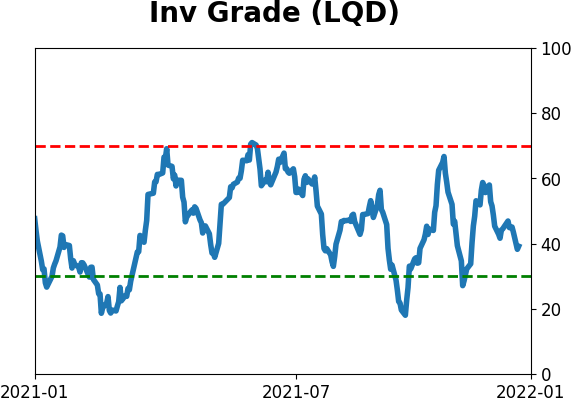
Sentiment Around The World
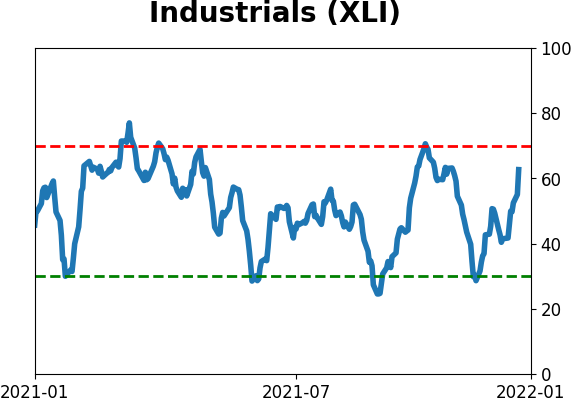
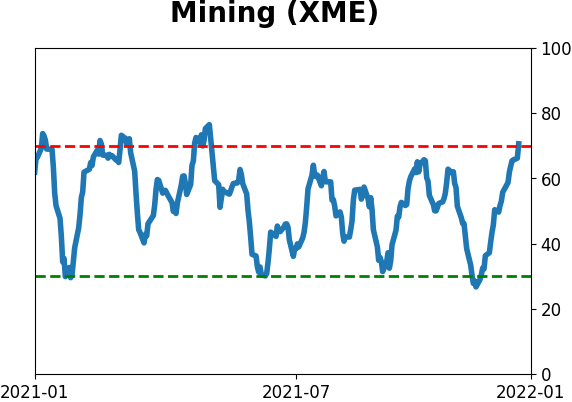
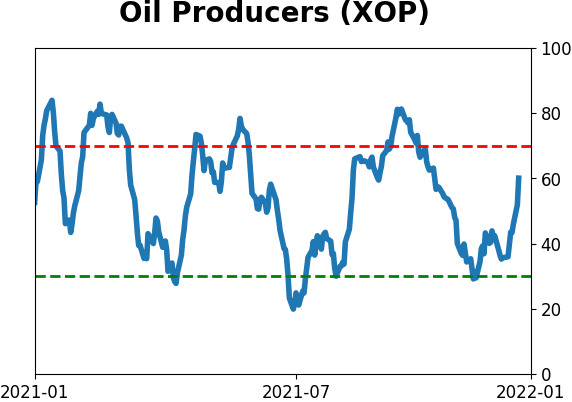
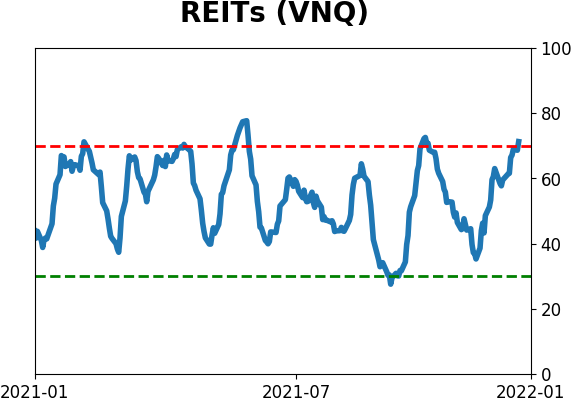
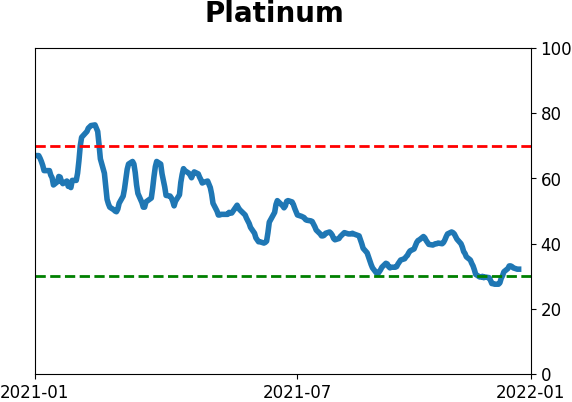
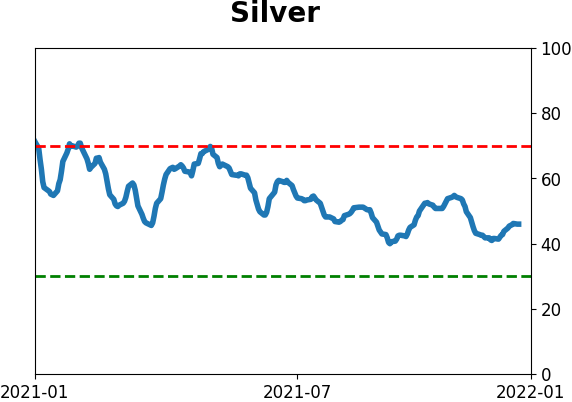
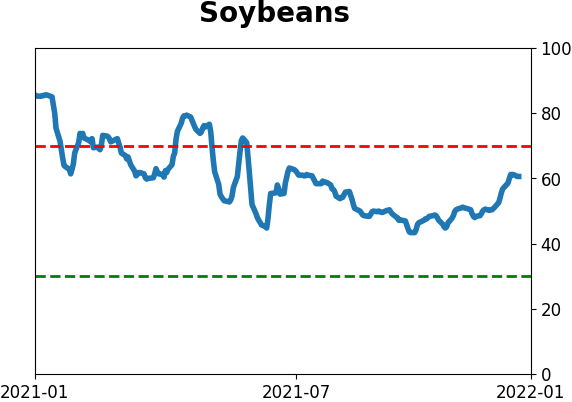
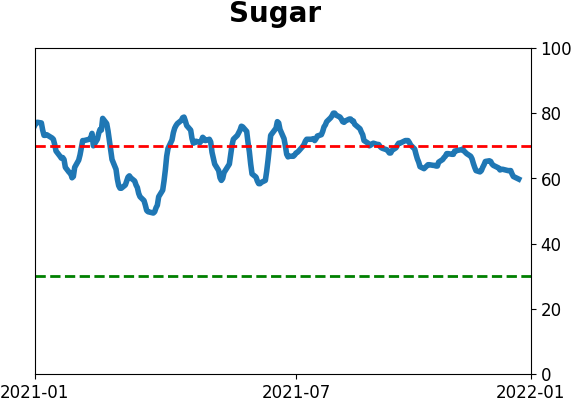
Optimism Index Thumbnails
|
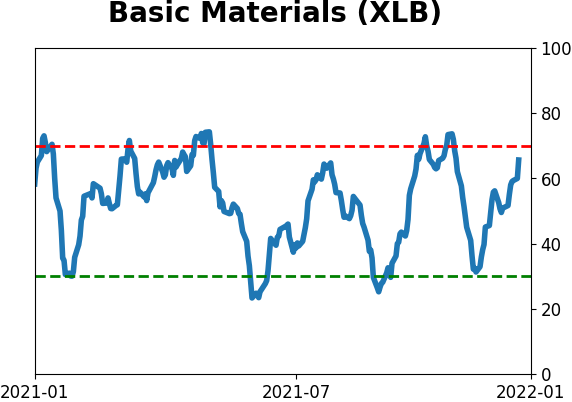
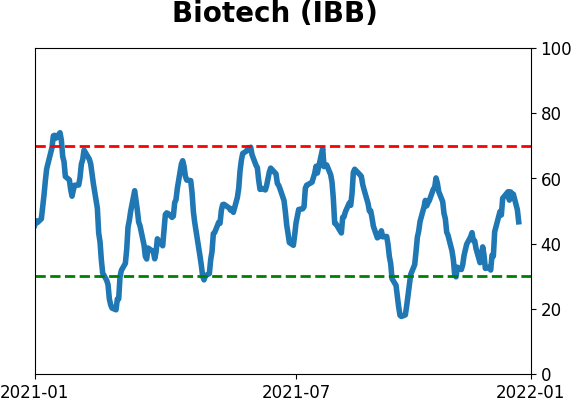
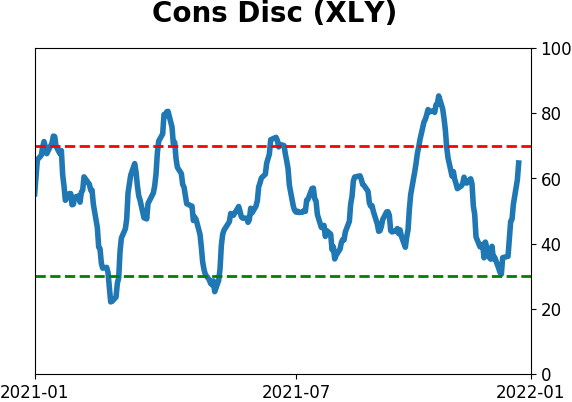
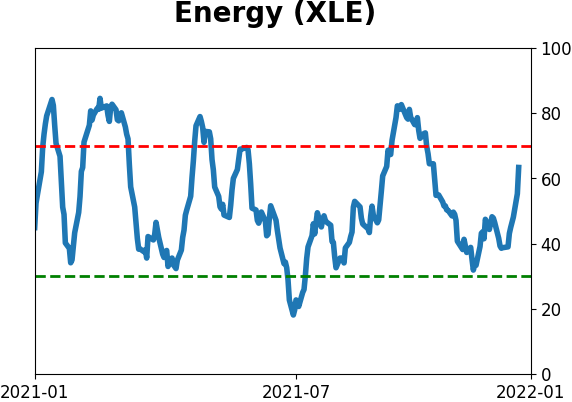
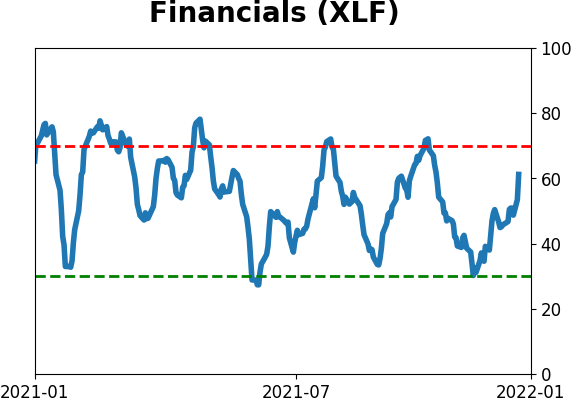
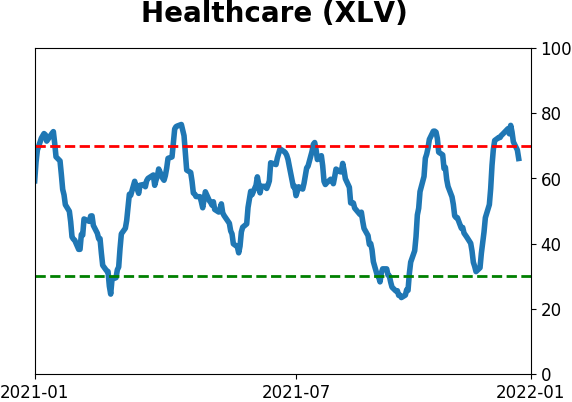
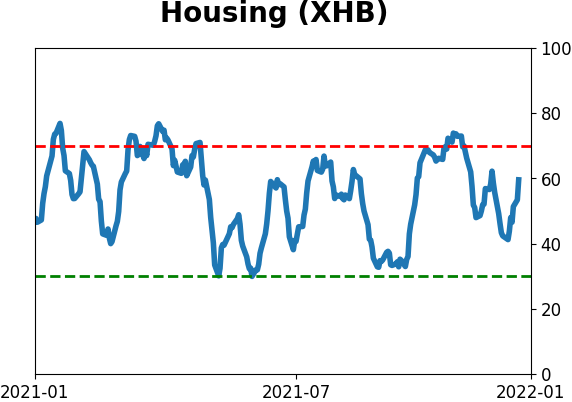
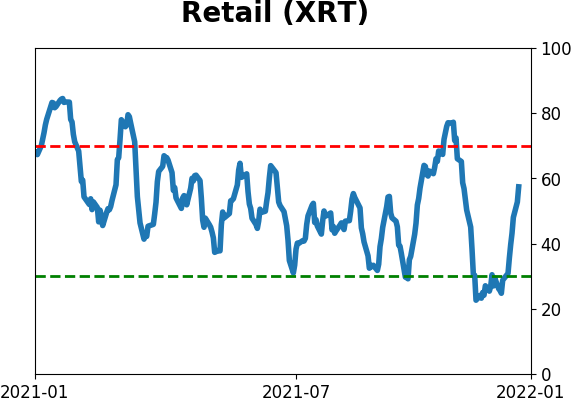
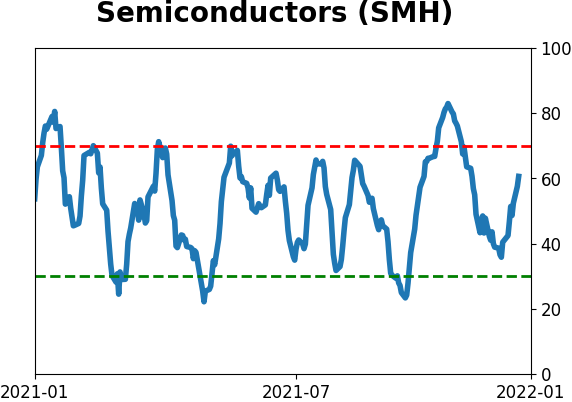
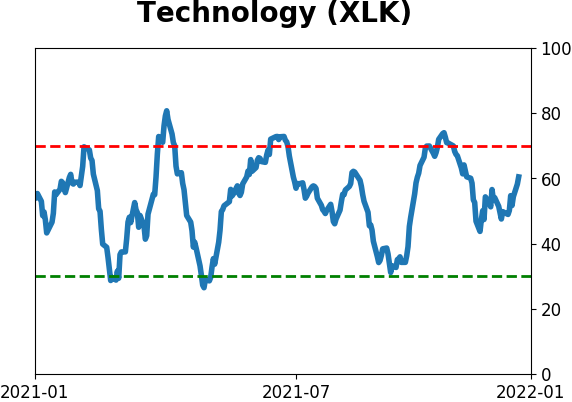
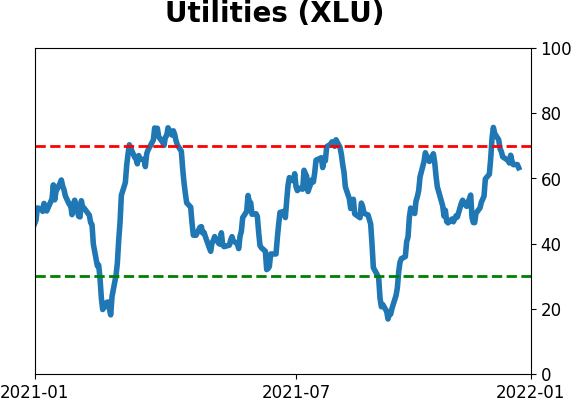
Sector ETF's - 10-Day Moving Average
|
|
|
Country ETF's - 10-Day Moving Average
|
|
|
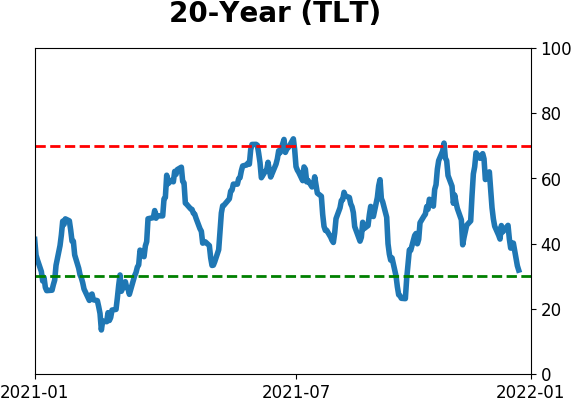
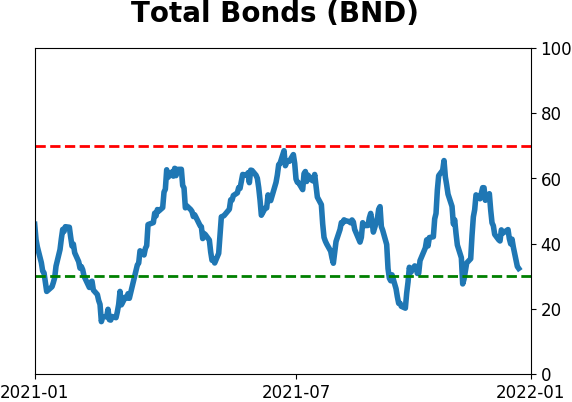
Bond ETF's - 10-Day Moving Average
|
|
|
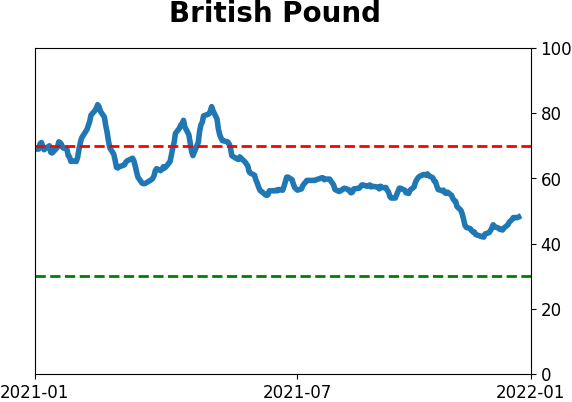
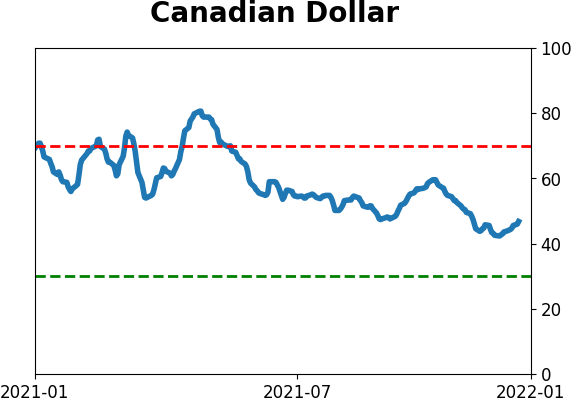
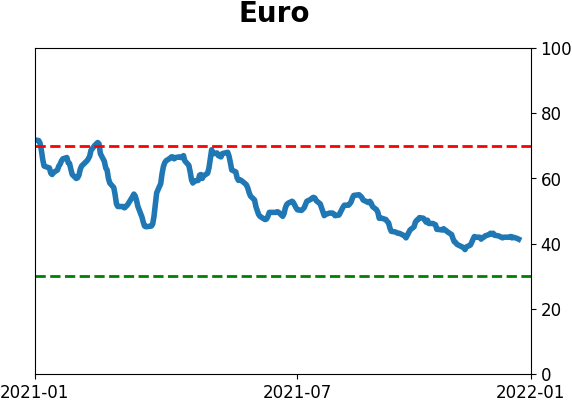
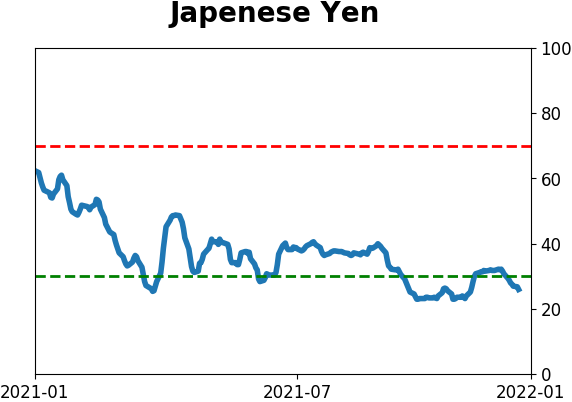
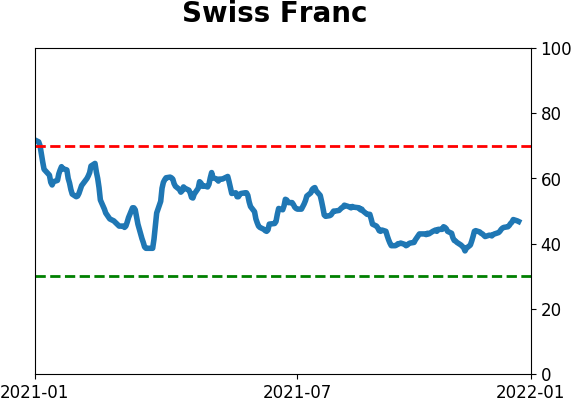
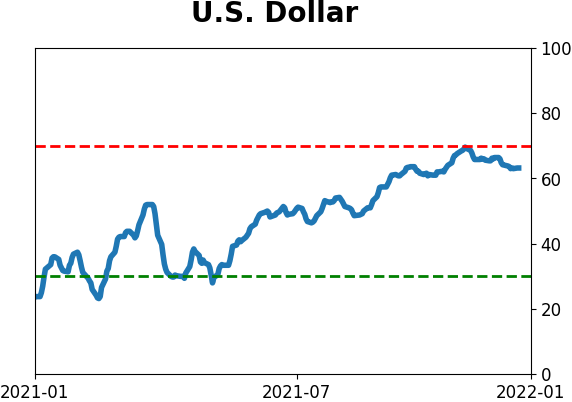
Currency ETF's - 5-Day Moving Average
|
|
|
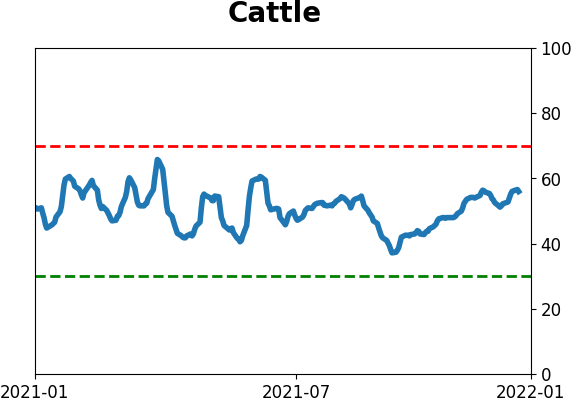
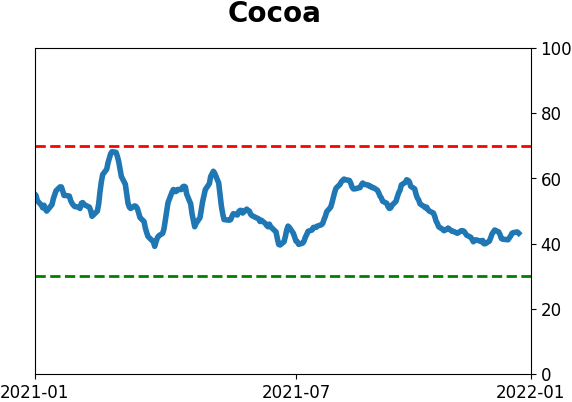
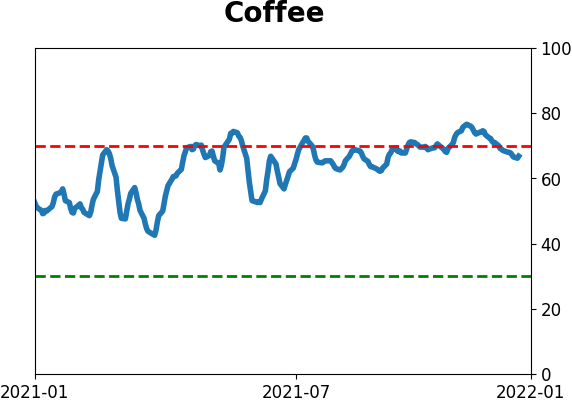
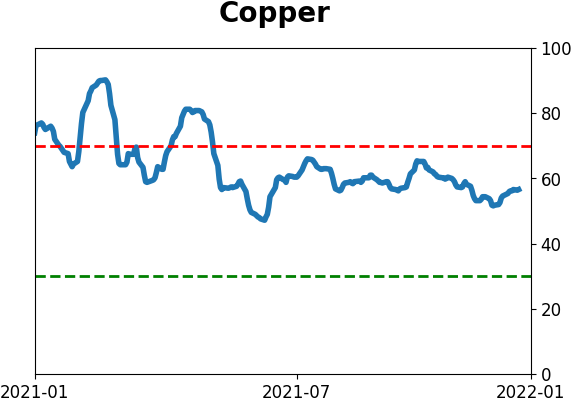
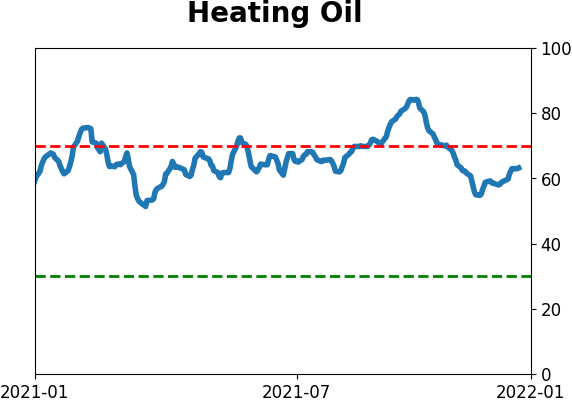
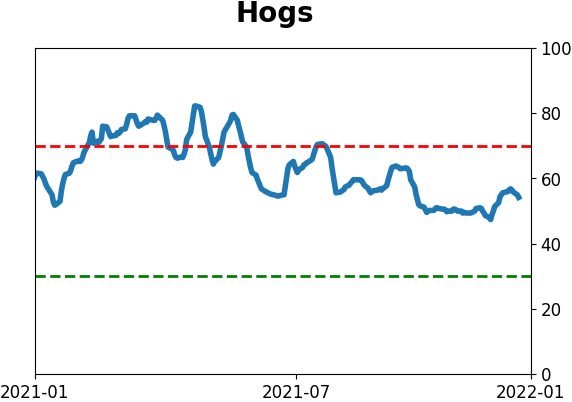
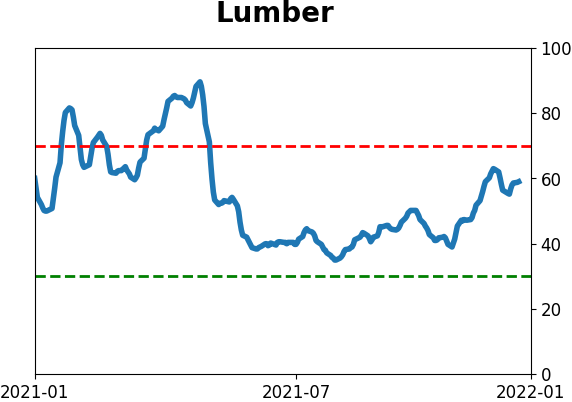
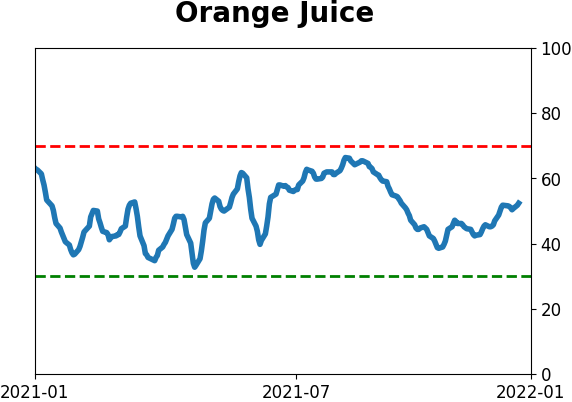
Commodity ETF's - 5-Day Moving Average
|
|