Headlines
|
|
Investors extrapolate big gains, with high Confidence:
Investors ended 2020 with some of the biggest confidence for more gains in more than 20 years. Other years that had the most similar path in the S&P 500 tended to see muted gains at best during the first couple months of a new year. Tech and energy stocks saw similar behavior after the most-correlated years.
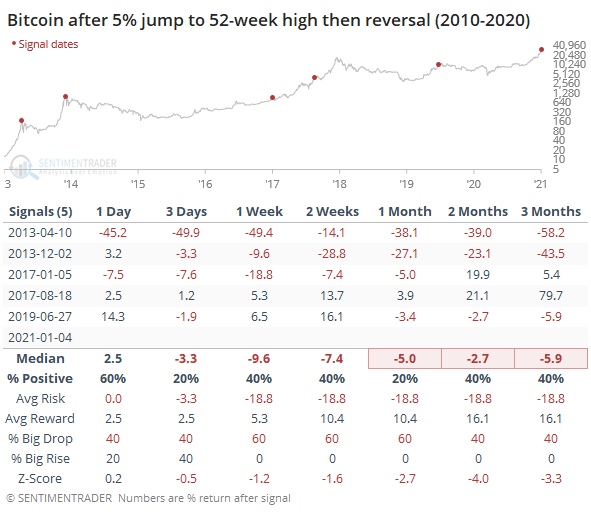
Bitcoin bust: After some holiday hype, bitcoin suffered a big reversal as traders returned for the New Year. After a one-day rally of more than 5% to touch a new high, bitcoin suffered a complete reversal of that gain on Monday. This is the kind of behavior that has preceded some tough slogging for the currency.
Bottom Line:
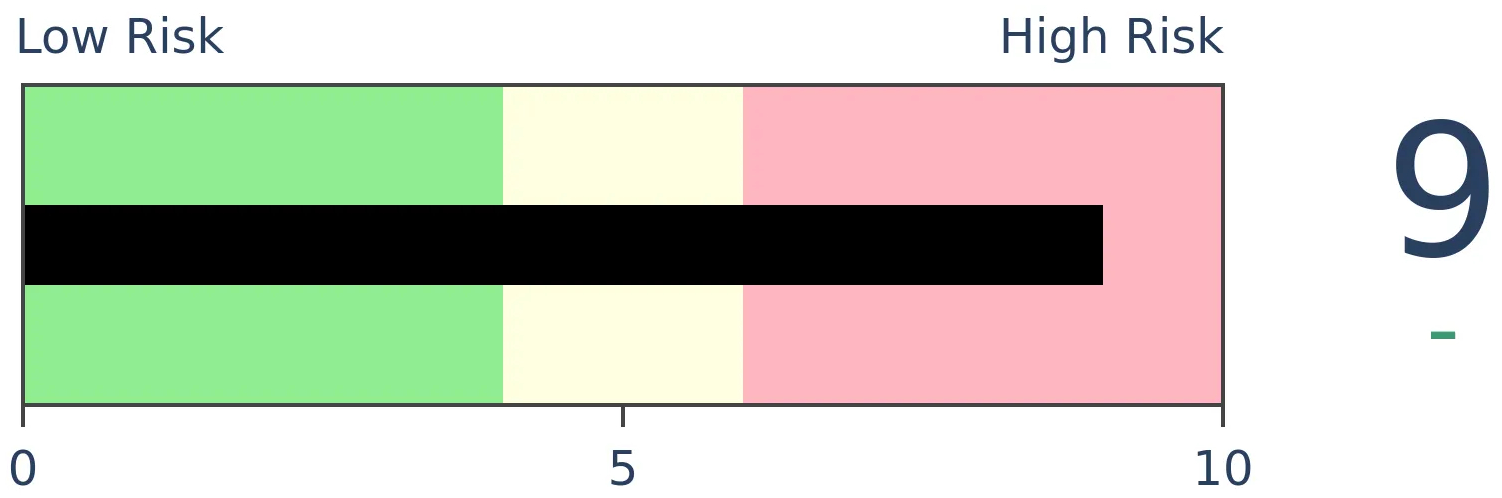
- The market environment is pristine, but with near-historic optimism, gains tend to be muted, with a high probability of being reversed at some point over the ensuing weeks.
|
Smart / Dumb Money Confidence
|
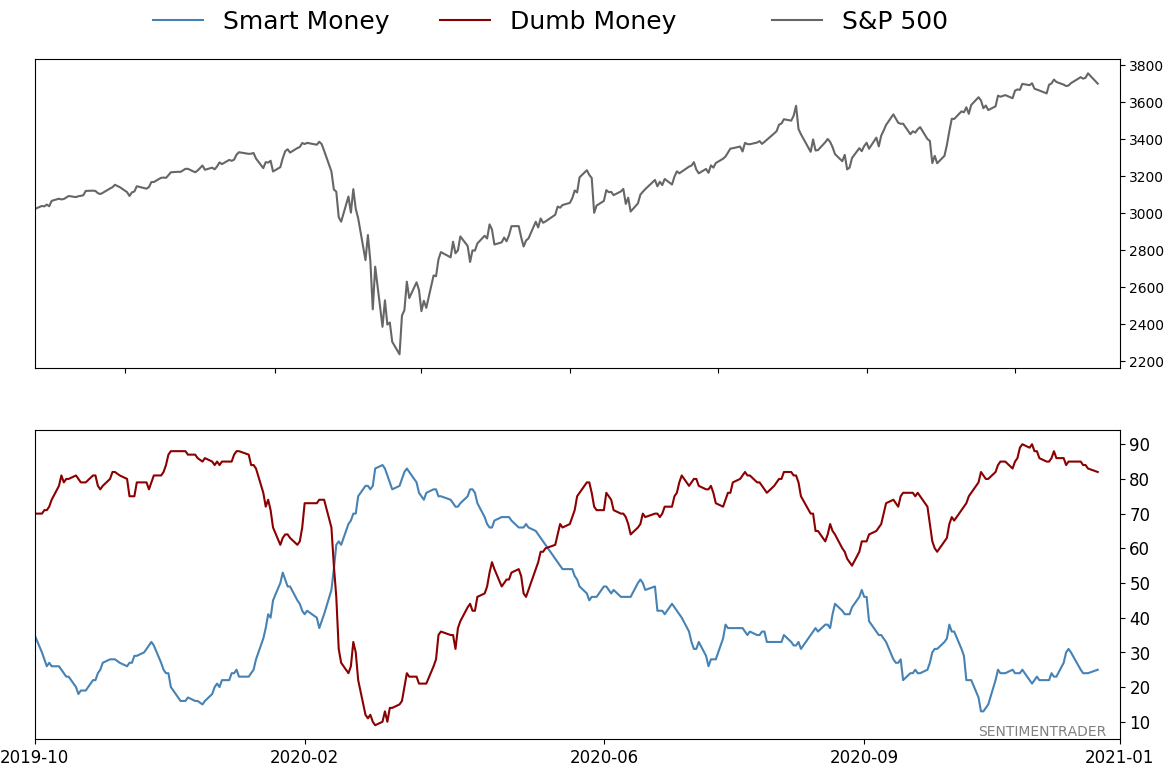
Smart Money Confidence: 25%
Dumb Money Confidence: 82%
|
|
Risk Levels
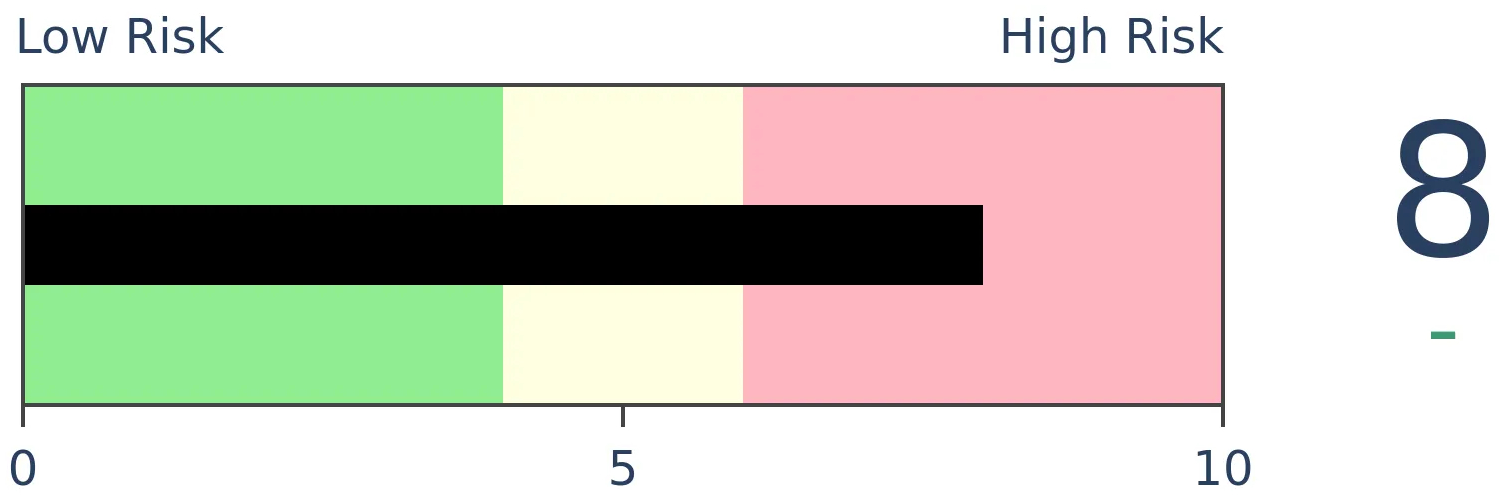
Stocks Short-Term
|
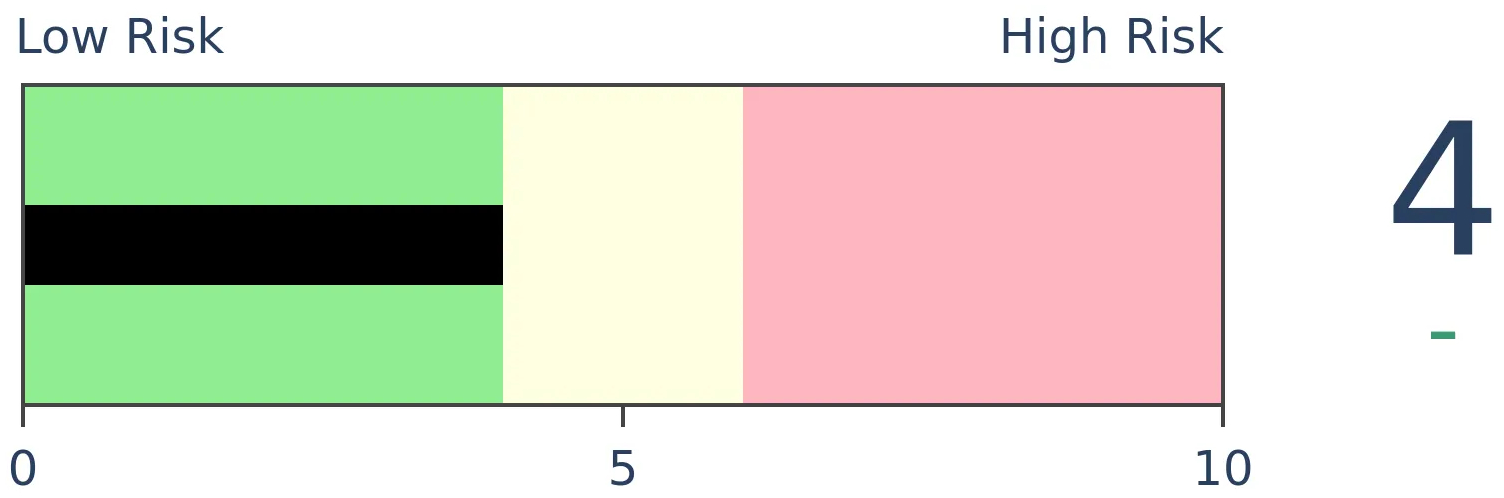
Stocks Medium-Term
|
|
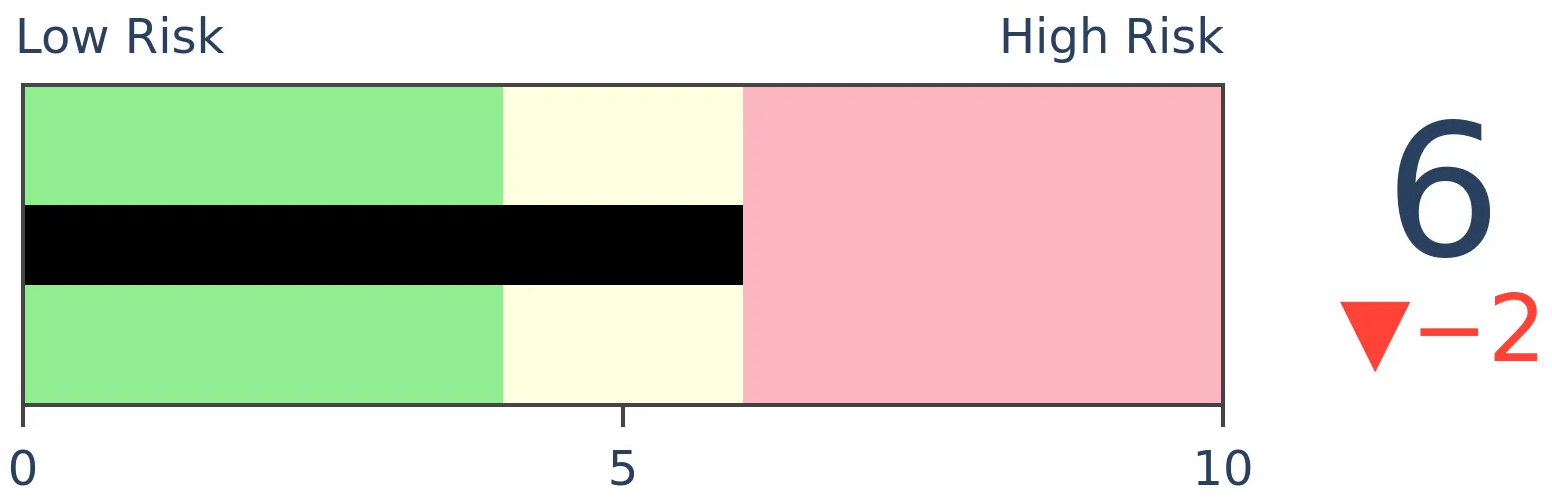
Bonds
|
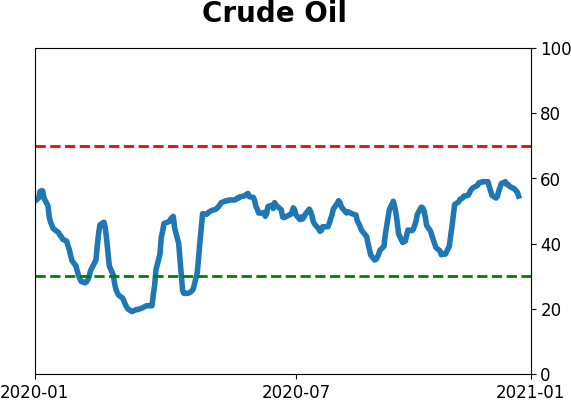
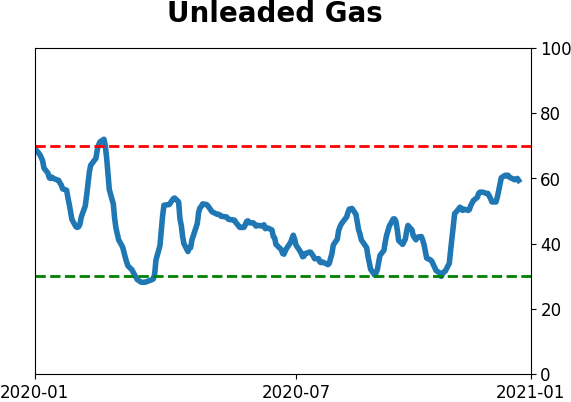
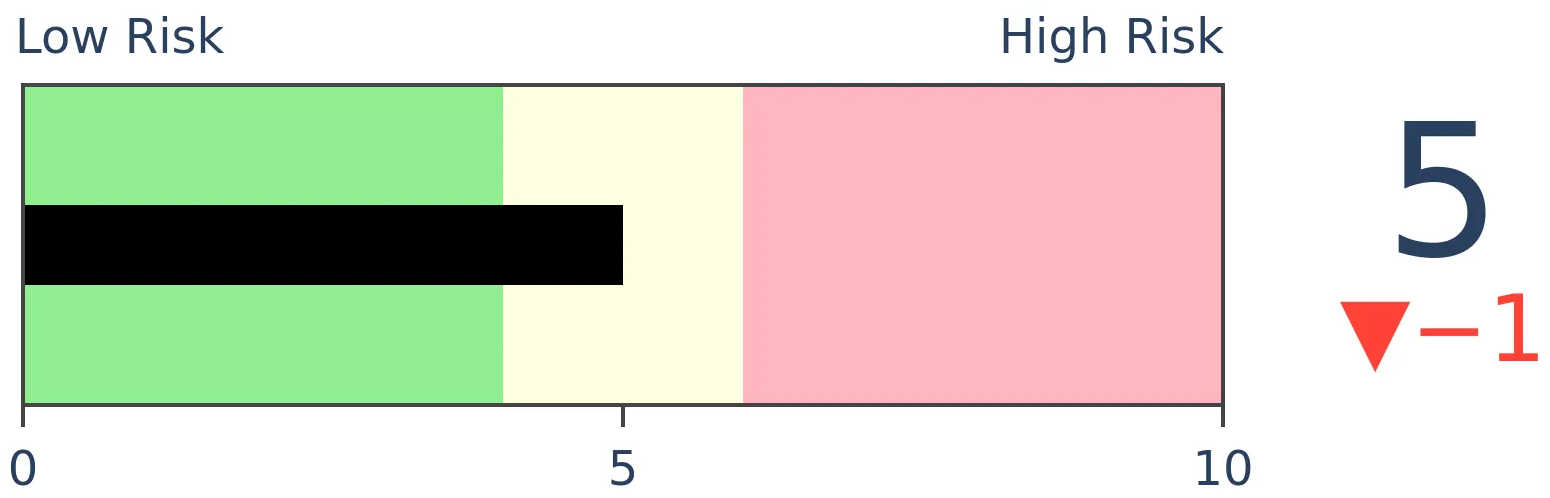
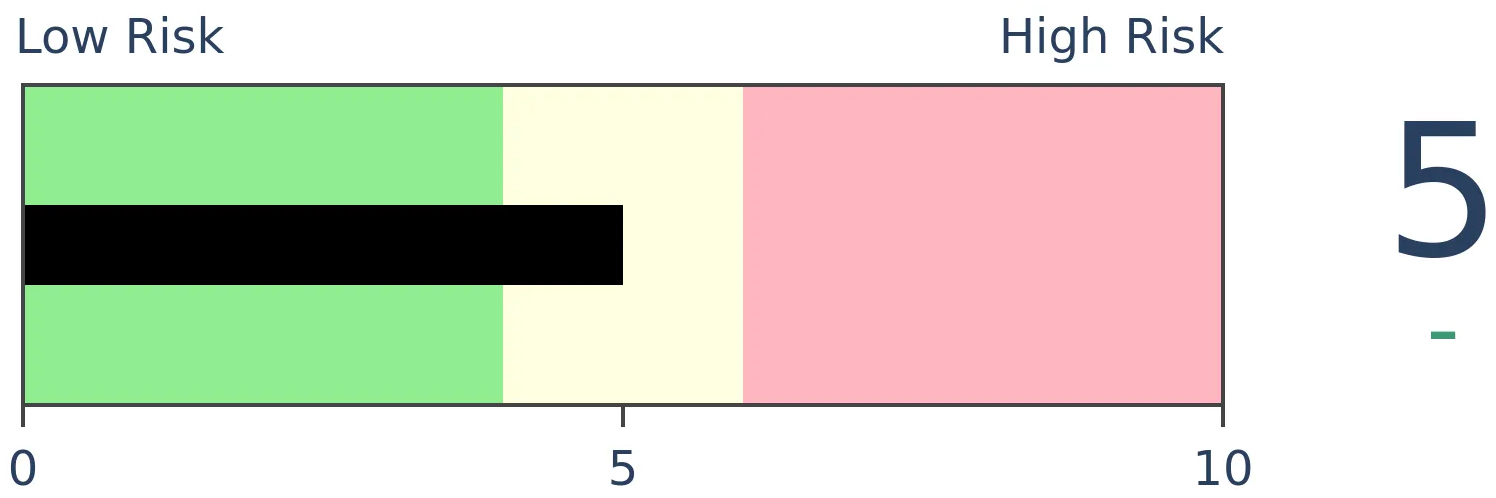
Crude Oil
|
|
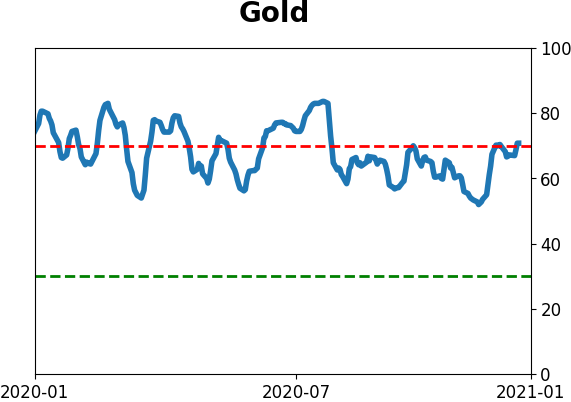
Gold
|
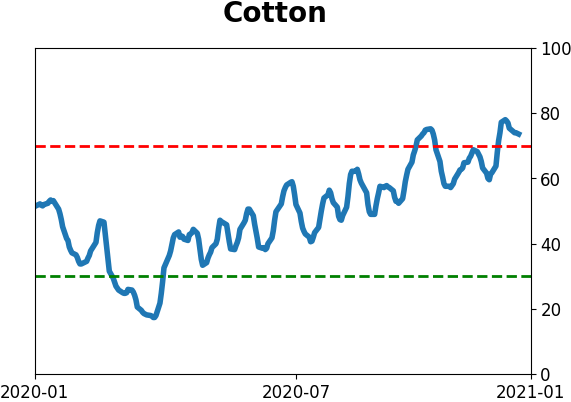
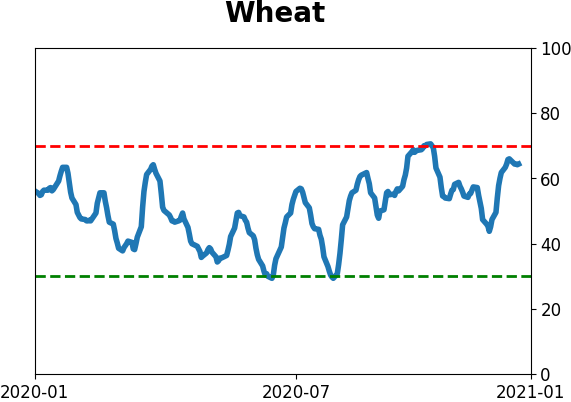
Agriculture
|
|
Research
BOTTOM LINE
Investors ended 2020 with some of the biggest confidence for more gains in more than 20 years. Other years that had the most similar path in the S&P 500 tended to see muted gains at best during the first couple months of a new year. Tech and energy stocks saw similar behavior after the most-correlated years.
FORECAST / TIMEFRAME
None
|
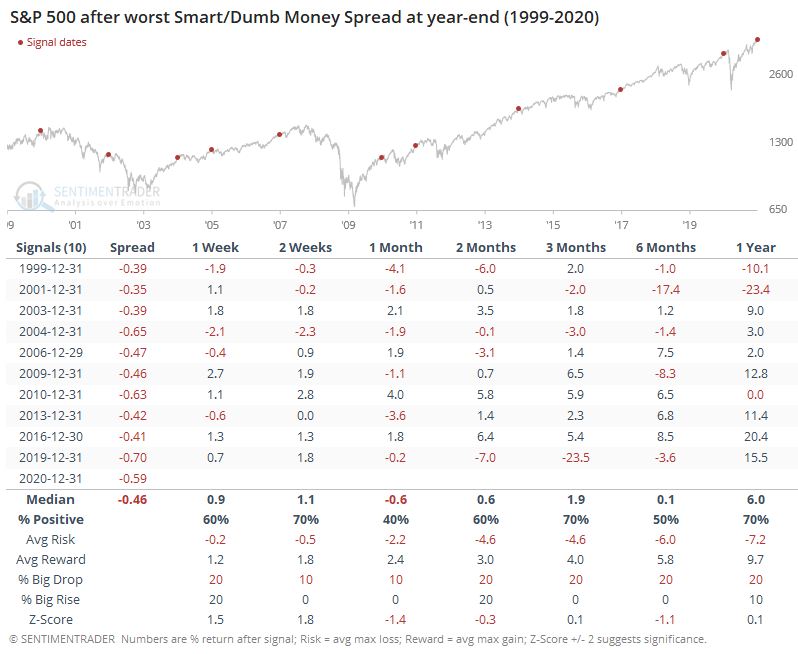
Even with a rally to close the year at new highs, and a consistently positive December, Dumb Money Confidence dipped from its record high, while Smart Money Confidence increased a bit. Though both measures eased from recent extremes, the protracted difference in sentiment means that we ended the year with one of the lowest spreads since we began calculating this 22 years ago.
Other times when a year ended with a very negative spread, the S&P 500 had a tendency to see a negative return, or a very small positive one, over the next 1-2 months. Out of the 10 years, 7 of them saw a negative return at some point between 1-3 months later. Out of the 3 exceptions, 2004 saw only modest gains, and 2011 saw all the gains erased in the months ahead. Only 2017 was the true exception, with large and sustained gains.
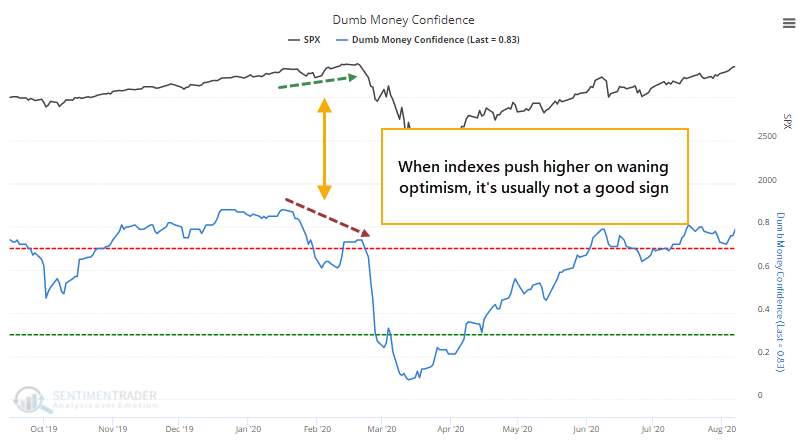
It seems like more and more armchair contrarians are being comforted by the decrease in extreme sentiment. But that's a false comfort - most often, sentiment will reach an extreme peak, and then stocks continue higher for a time, but with less enthusiasm. It's that push higher on less optimism that's the real worry.
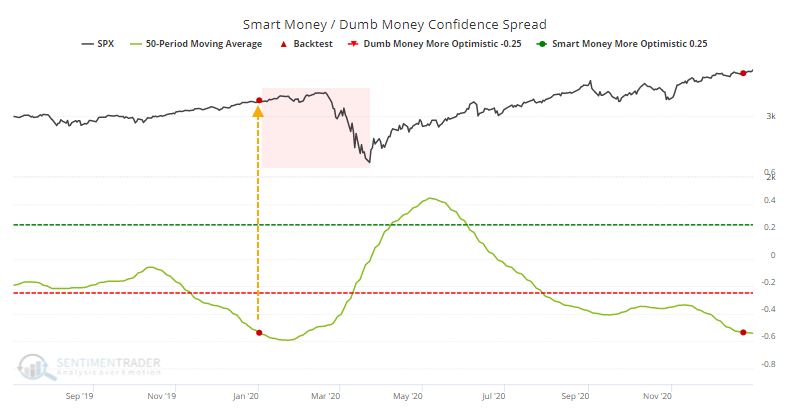
Bull markets are most sustainable when optimism is increasing, not decreasing, and we only need to look back to February of last year for a stark example.
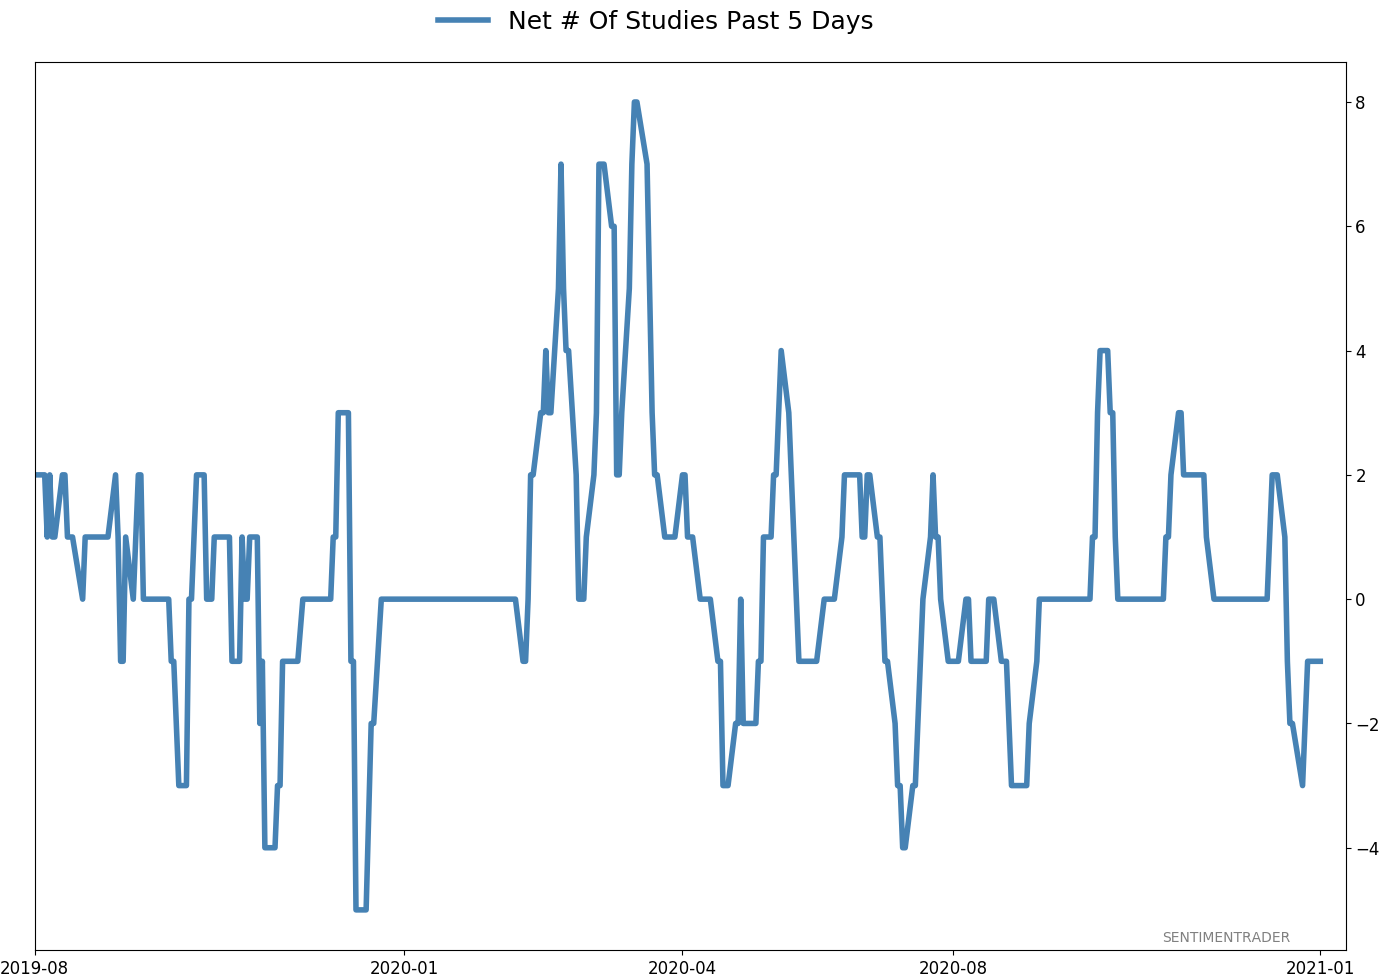
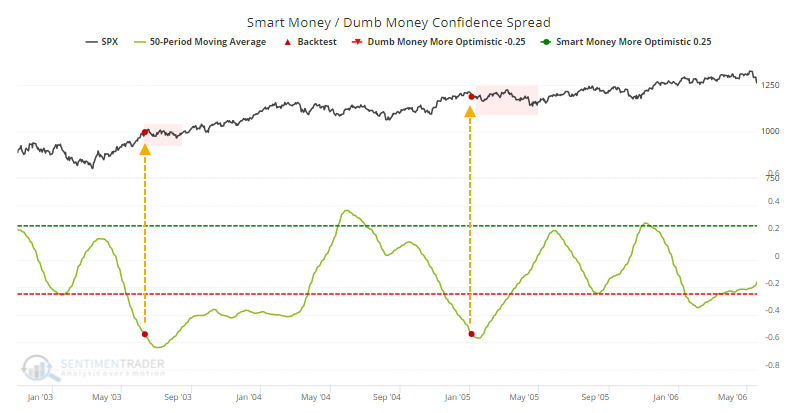
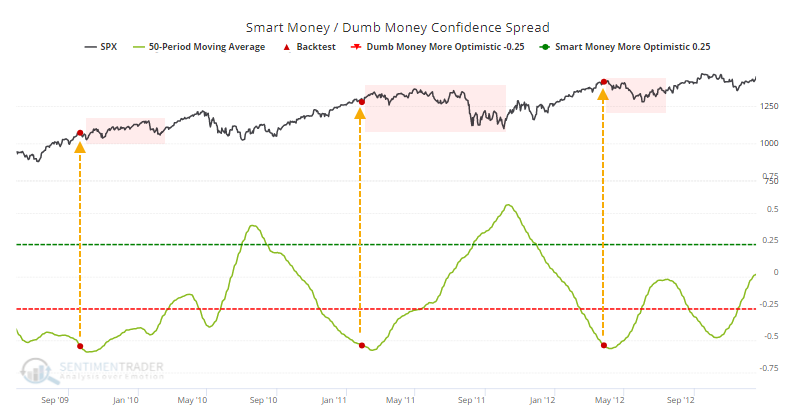
Even though sentiment eased a bit in the latter half of December, the spread in Confidence has been negative enough, for long enough, that the 50-day average dropped below -54% for one of only a handful of times since 1998. The Backtest Engine shows that the S&P struggled to hold gains going forward.
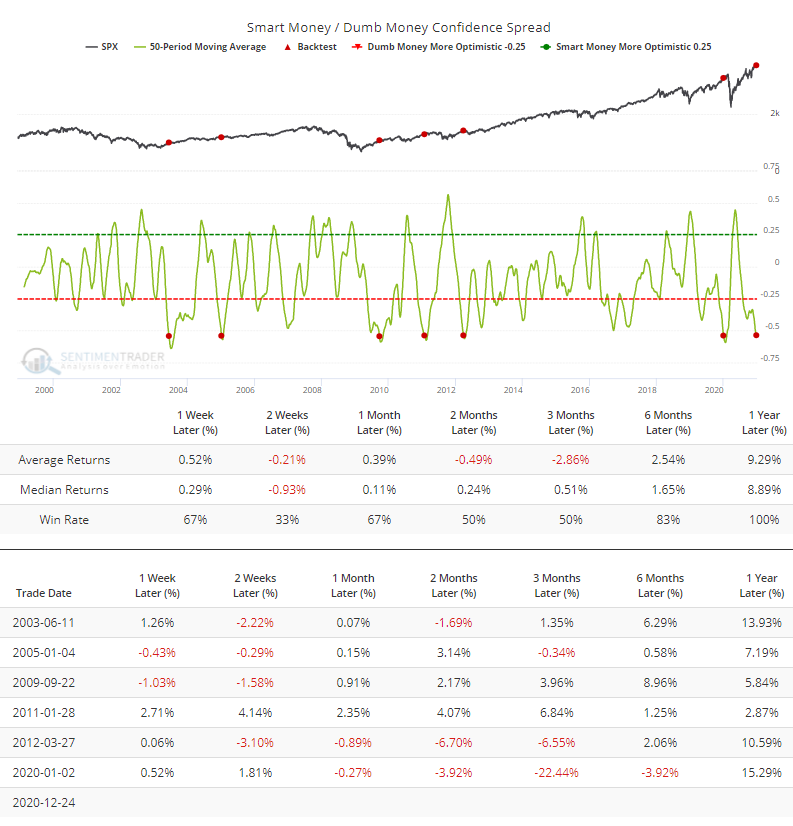
When we zoom in on the individual signals, we can see how choppy the price action tended to become soon after these extended extremes.
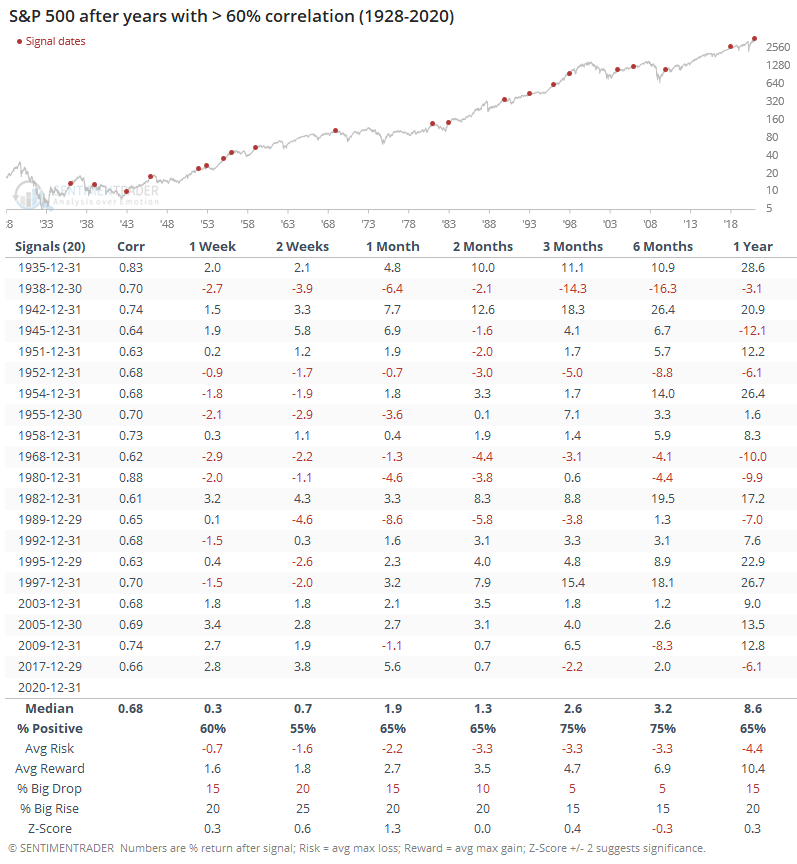
It's hard to blame investors for having such high confidence. The most-benchmarked index in the world had quite a year, with no other quite like it. Still, there were 20 other years since 1928 that had a correlation of greater than +0.60 (on a scale from -1.0 to +1.0).
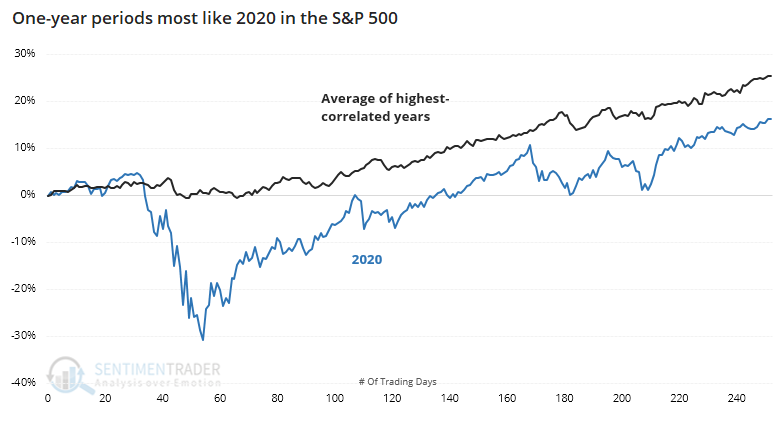
Individually, the 10 most recent ones are shown below. The magnitude of the moves last year were extreme, but the general path of the index was fairly close to several of them.
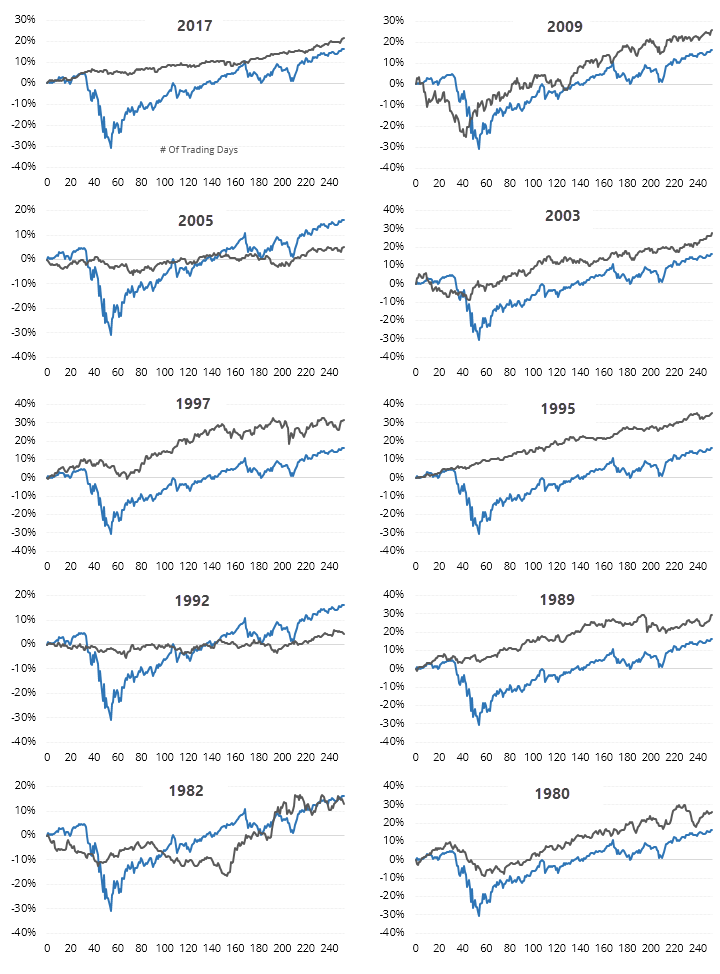
Going forward, those years showed modest positive returns, with a risk about equal to reward for the first two months. There was not a lot of consistency.
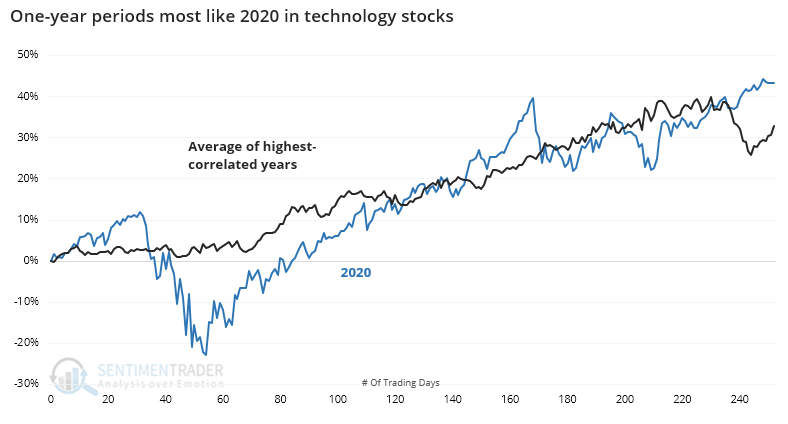
Among sectors, we saw the most extreme behavior in tech stocks. There were 15 other years that had a relatively high correlation to 2020, at least in the general path, but not in magnitude. As we saw last week, it's been rare for any sector in more than 90 years to see back-to-back years with 40% gains, and their next-year returns were not impressive.
We can see the 10 most recent years in the thumbnails below.
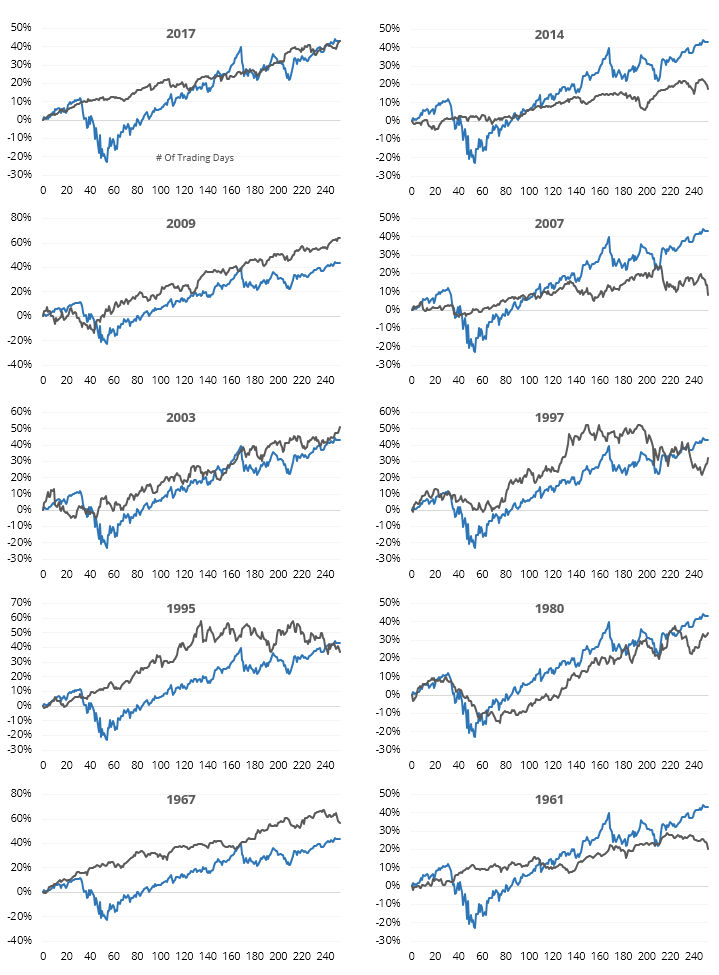
Going forward, tech stocks struggled during the next month. Risk was higher than reward up to a month later, with about double the chance of seeing a big drop versus a big rise (see this Knowledge Base article for definitions).
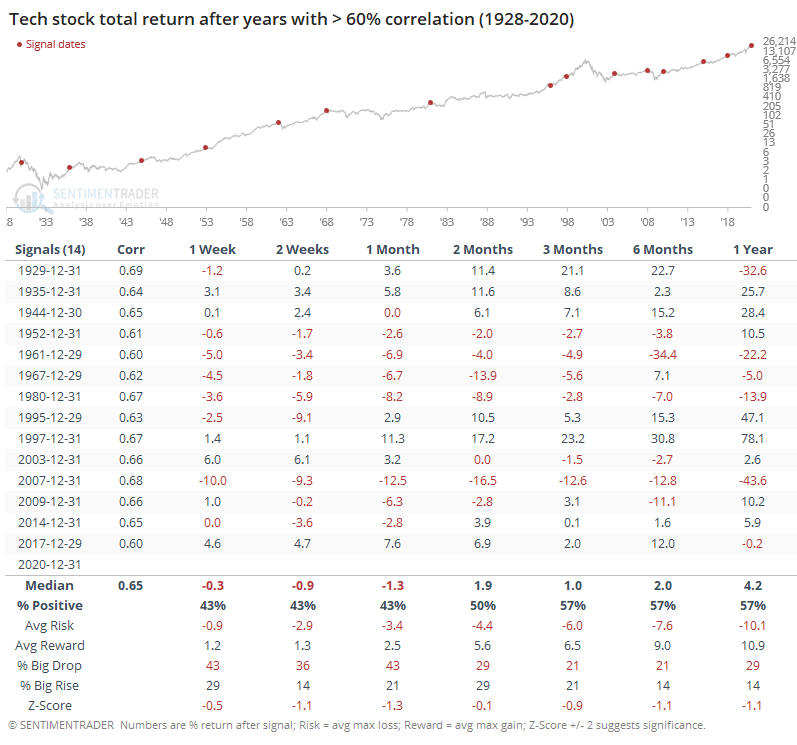
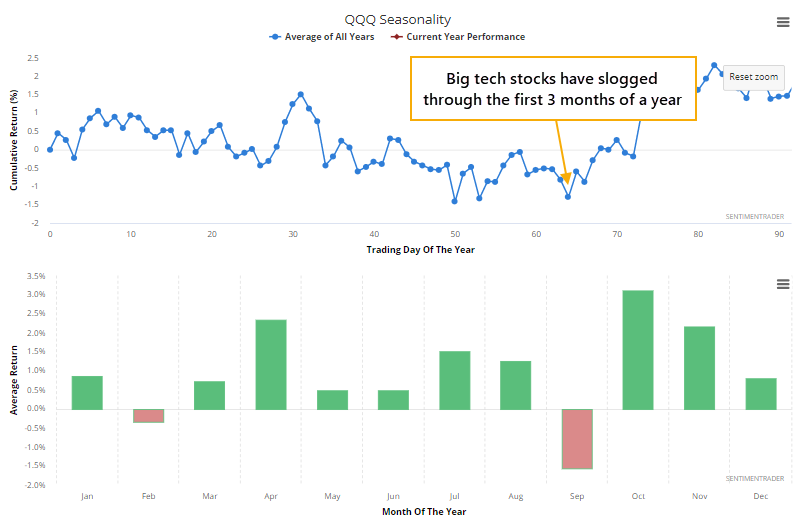
Even in non-correlated years, QQQ Seasonality shows modestly negative returns during the first few months of the year. And if the big tech stocks in that fund see similar behavior, they will likely depress the whole sector.
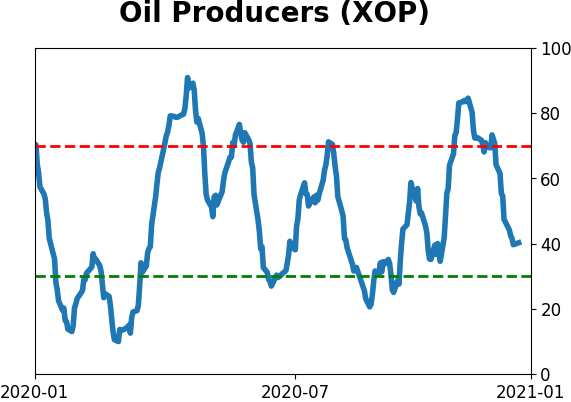
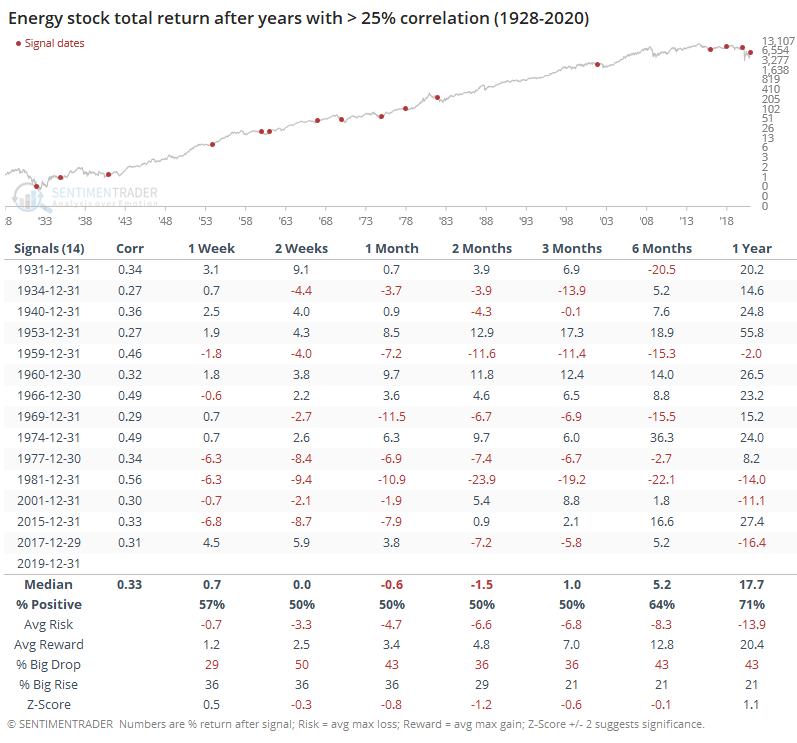
At the other end of the spectrum, energy stocks had the worst year of any sector. The worst stretch of any sector ever, really, so there were no years that had a high positive correlation to 2020. There were 15 of them that showed a correlation above +0.25, which is relatively weak.
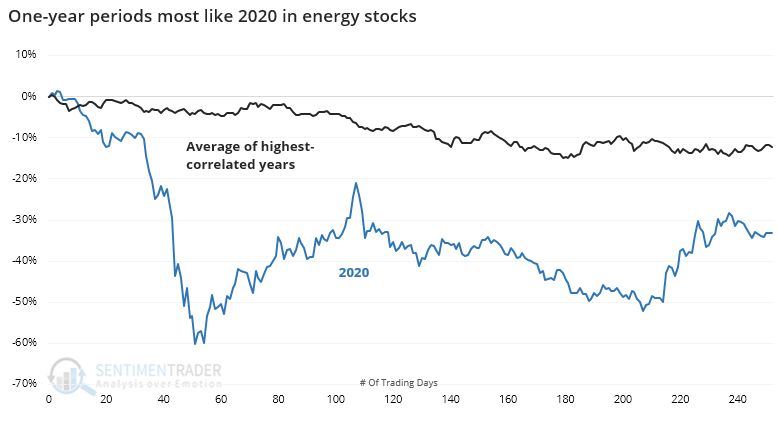
Individually, this is what they looked like. The magnitude of the losses in 2020 surpassed any other, so the only ones that qualified showed a modest correlation to the path that 2020 took.
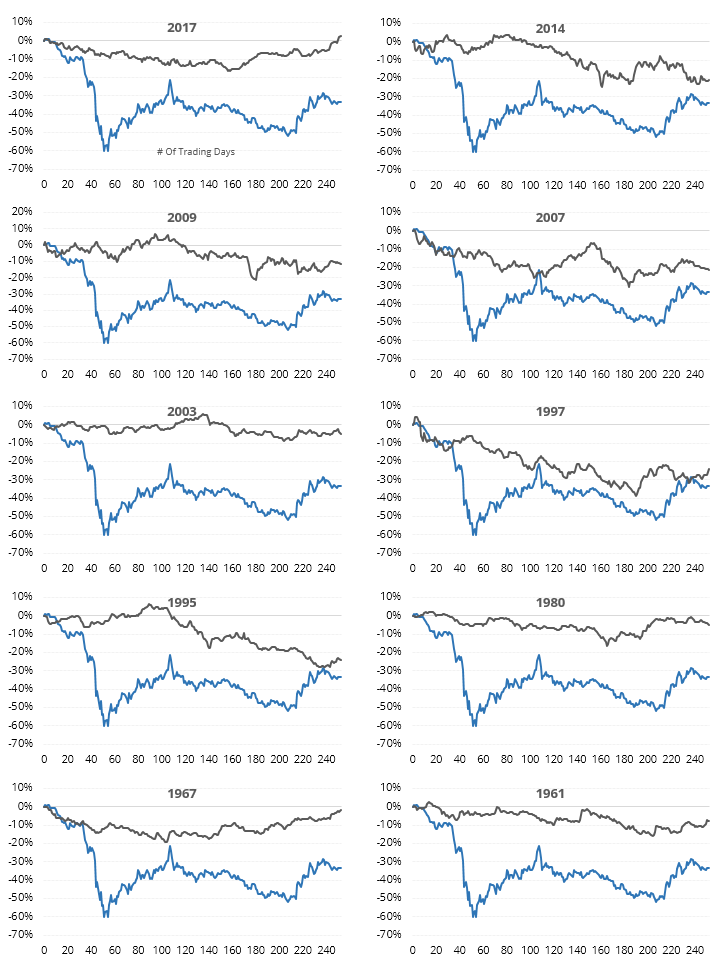
Going forward, energy stocks had some trouble with negative momentum during the first 1-2 months of the new year but most were able to reverse course longer-term.
Investors love to extrapolate, which is why trend following is so popular. And most of the time, it works, as long as one can stick with the strategy during the multiple false starts that trigger during choppy conditions. Based on how investors have typically behaved under conditions like we're seeing now, those types of choppy conditions are more likely than not, raising the risk for trend-following strategies.
Active Studies
| Time Frame | Bullish | Bearish | | Short-Term | 0 | 0 | | Medium-Term | 2 | 1 | | Long-Term | 14 | 2 |
|
Indicators at Extremes
Portfolio
| Position | Description | Weight % | Added / Reduced | Date | | Stocks | 10.4% VWO, 9.1% XLE, 8.5% RSP, 6.6% PSCE | 34.5 | Reduced 6.7% | 2020-12-14 | | Bonds | 10% BND, 10% SCHP, 10% ANGL | 28.4 | Reduced 0.1% | 2020-10-02 | | Commodities | GCC | 2.4 | Reduced 2.1%
| 2020-09-04 | | Precious Metals | GDX | 8.9 | Added 4.8% | 2020-12-01 | | Special Situations | | 0.0 | Reduced 5% | 2020-10-02 | | Cash | | 25.8 | | |
|
Updates (Changes made today are underlined)
Quite a few of the studies that have been triggering for stocks have showed a poor risk/reward skew over a short- to medium-term time frame, even though many of them have also been quite positive over medium- to long-term time frames. We're in a very favorable seasonal window, so it would be somewhat odd to see a substantial pullback in the next few weeks. Leave it to 2020 to do just that, I suppose, but the calendar is a point in bulls' favor. Even so, record-high-and-declining sentiment, coupled with early signs of a reversal were enough that I reduced my S&P 500 position a bit. I fully expect that the energy funds will suffer some losses in the coming weeks, but as I noted when buying them, they're intended as long-term positions and almost by definition they're going to be volatile. RETURN YTD: 0.7% 2020: 8.1%, 2019: 12.6%, 2018: 0.6%, 2017: 3.8%, 2016: 17.1%, 2015: 9.2%, 2014: 14.5%, 2013: 2.2%, 2012: 10.8%, 2011: 16.5%, 2010: 15.3%, 2009: 23.9%, 2008: 16.2%, 2007: 7.8%
|
|
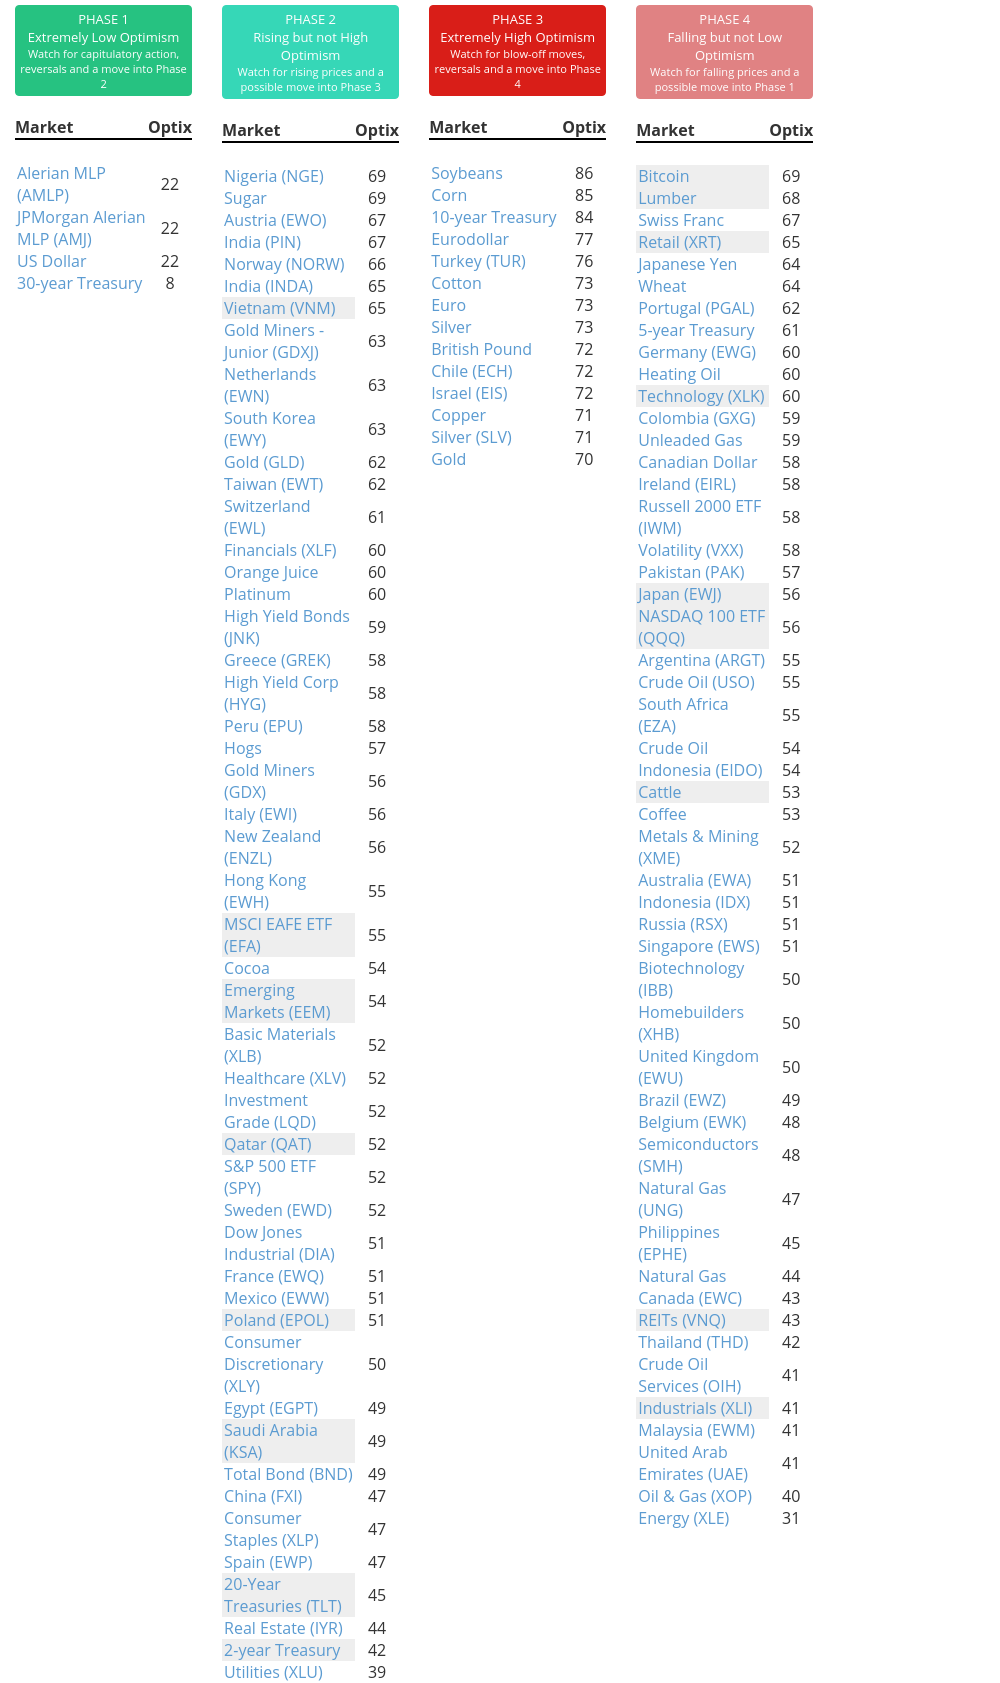
Phase Table
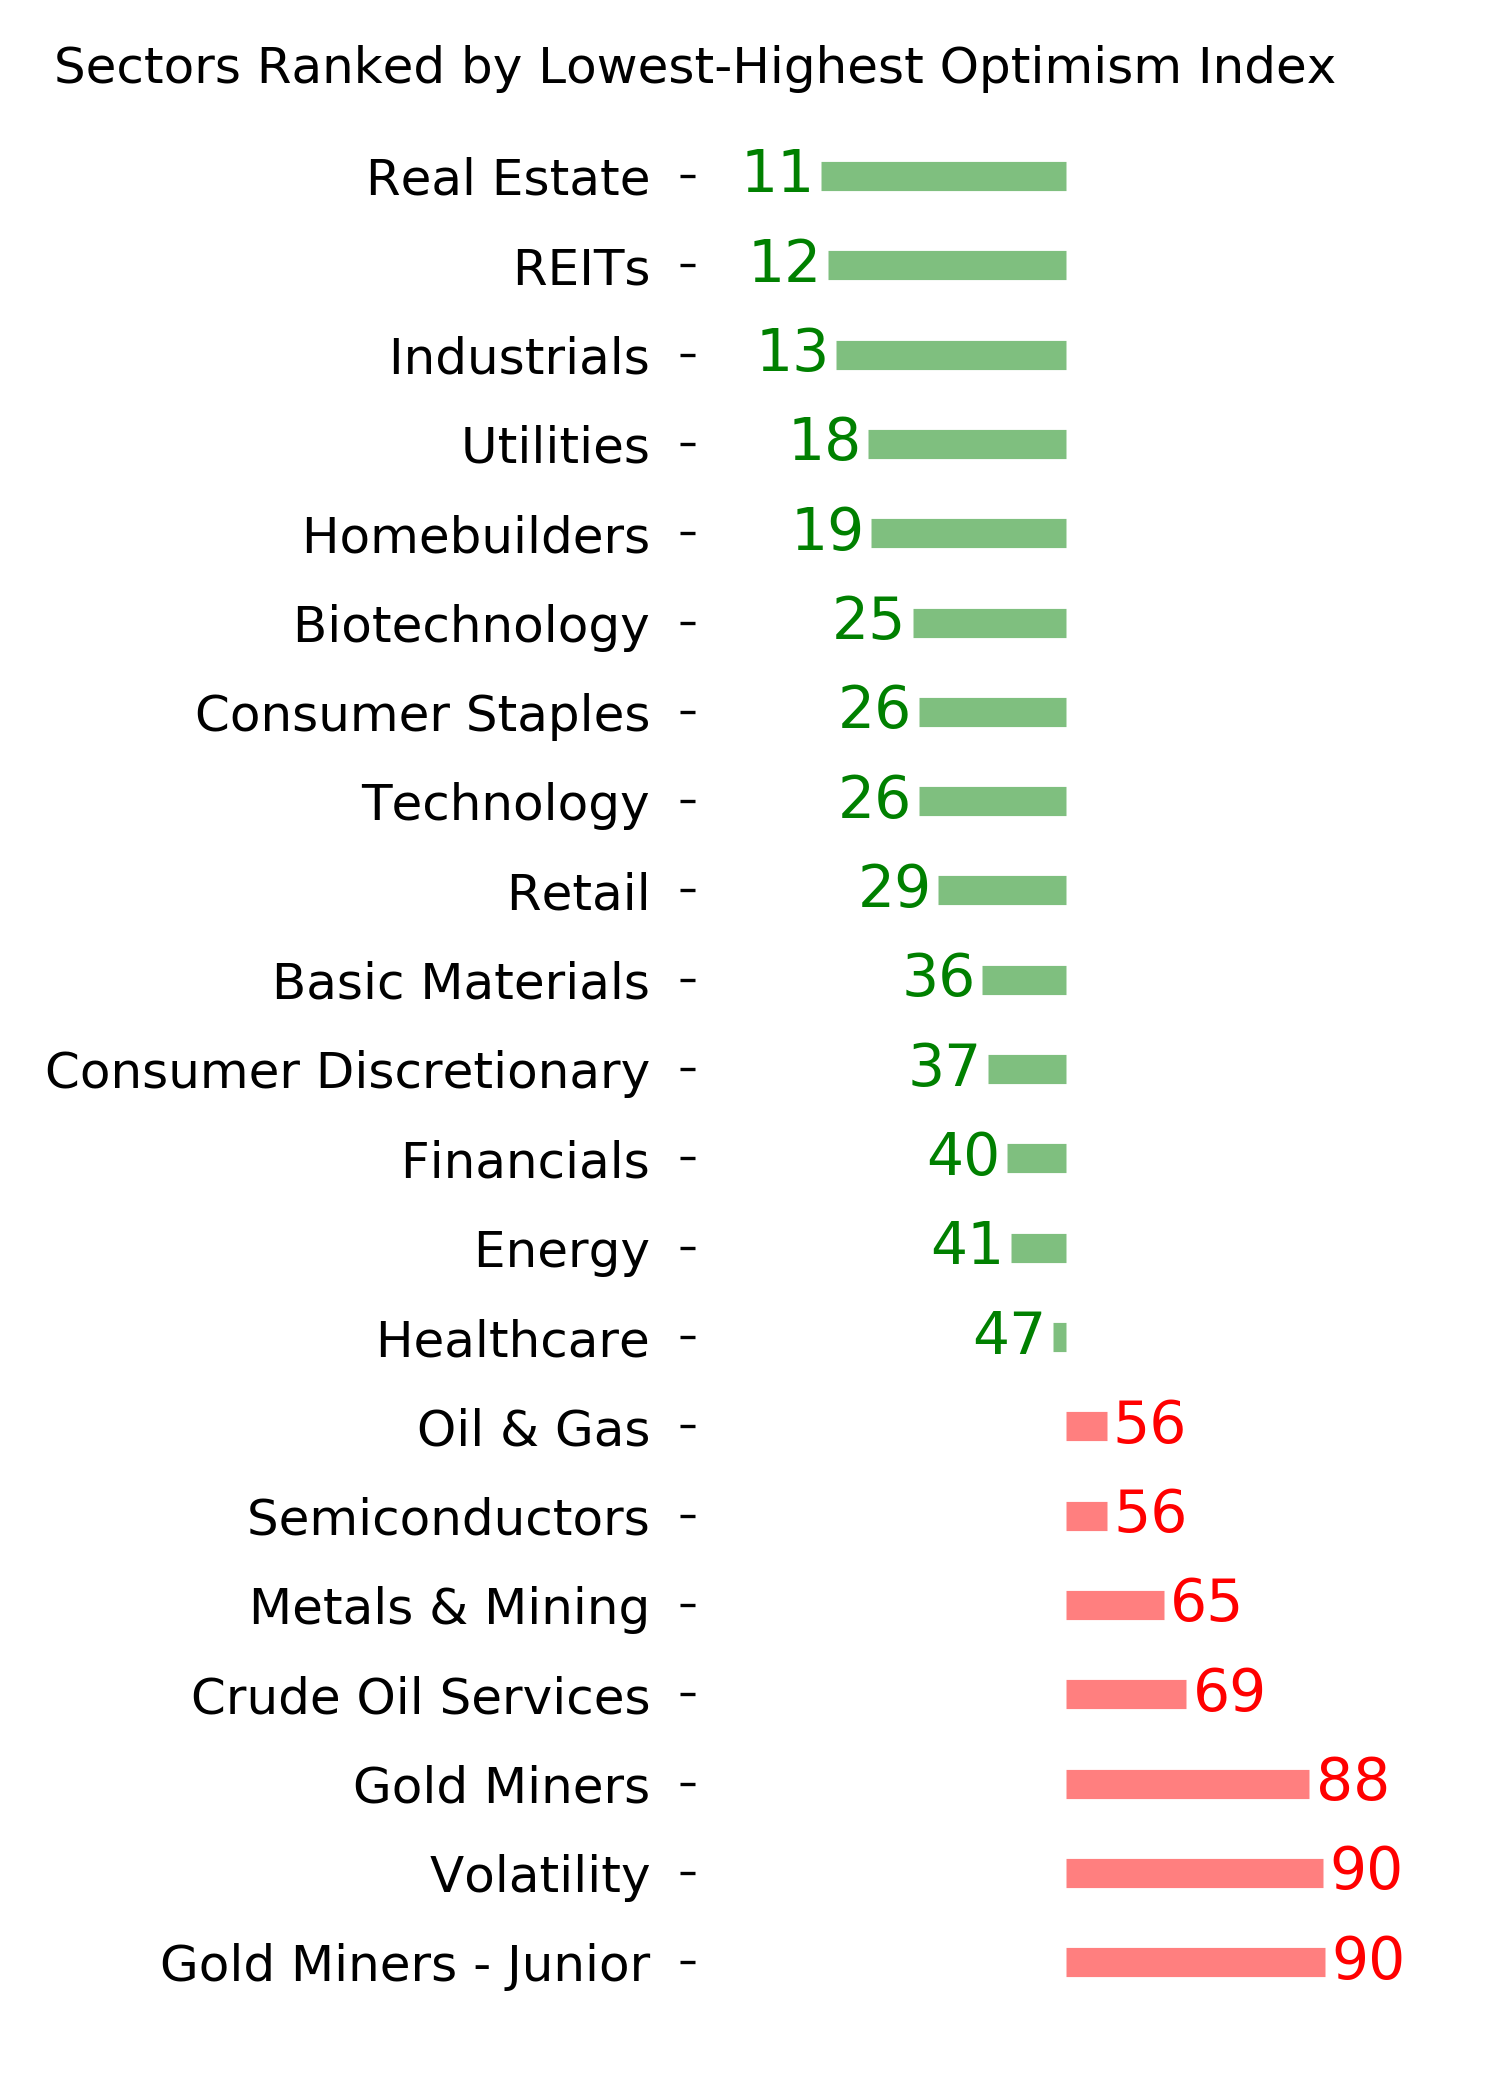
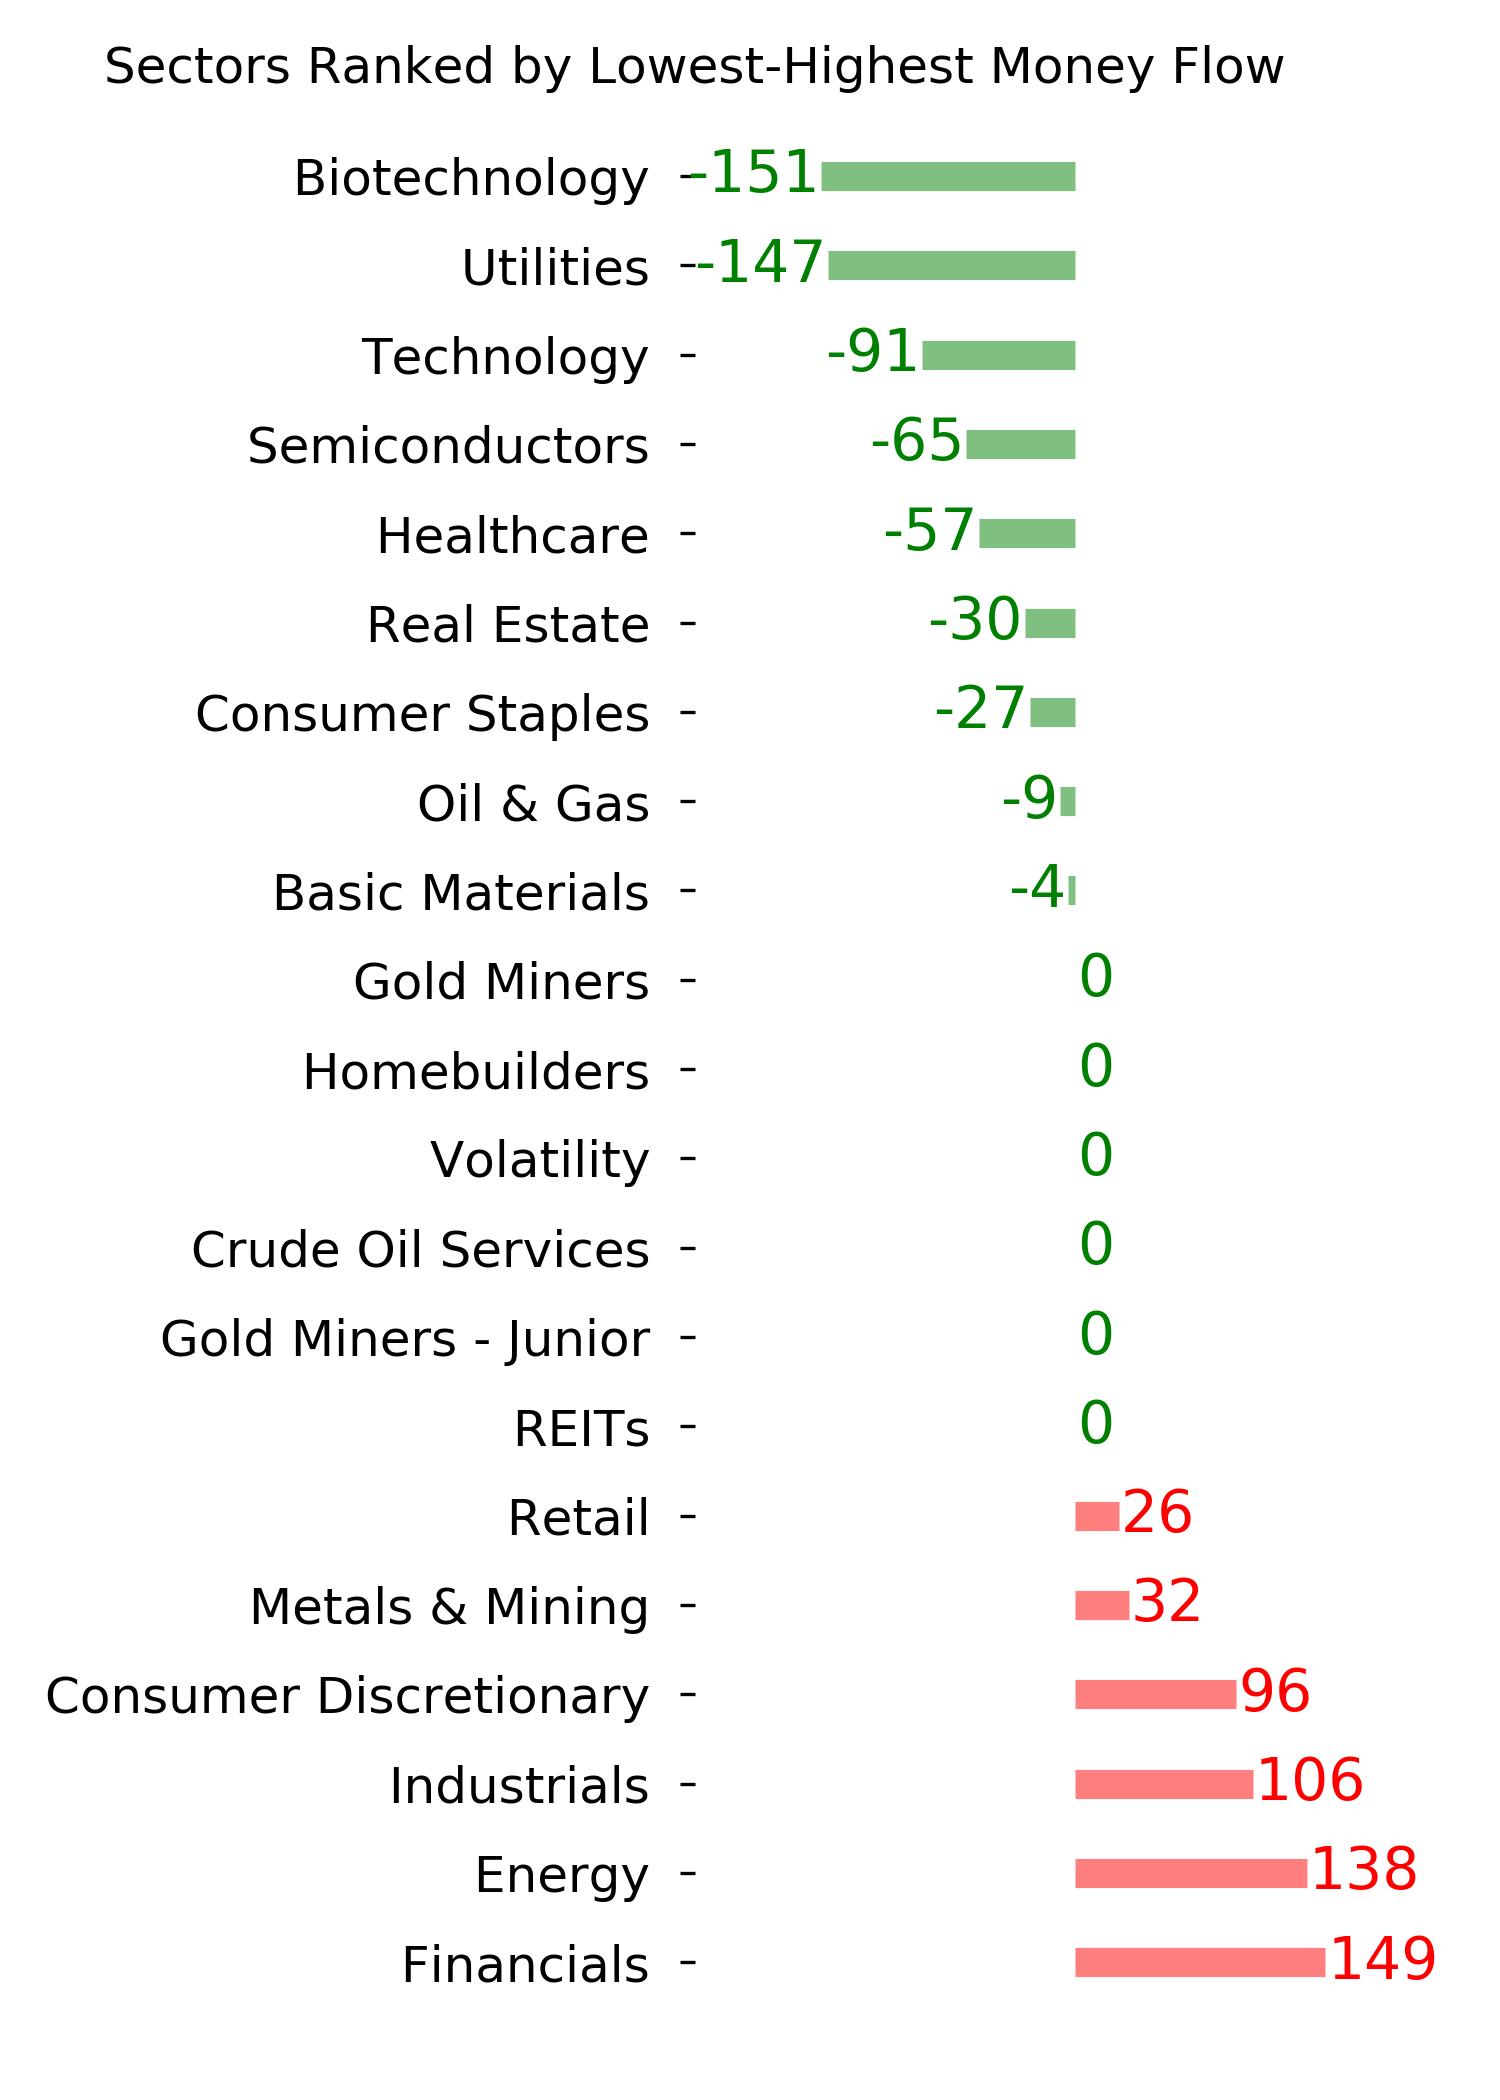
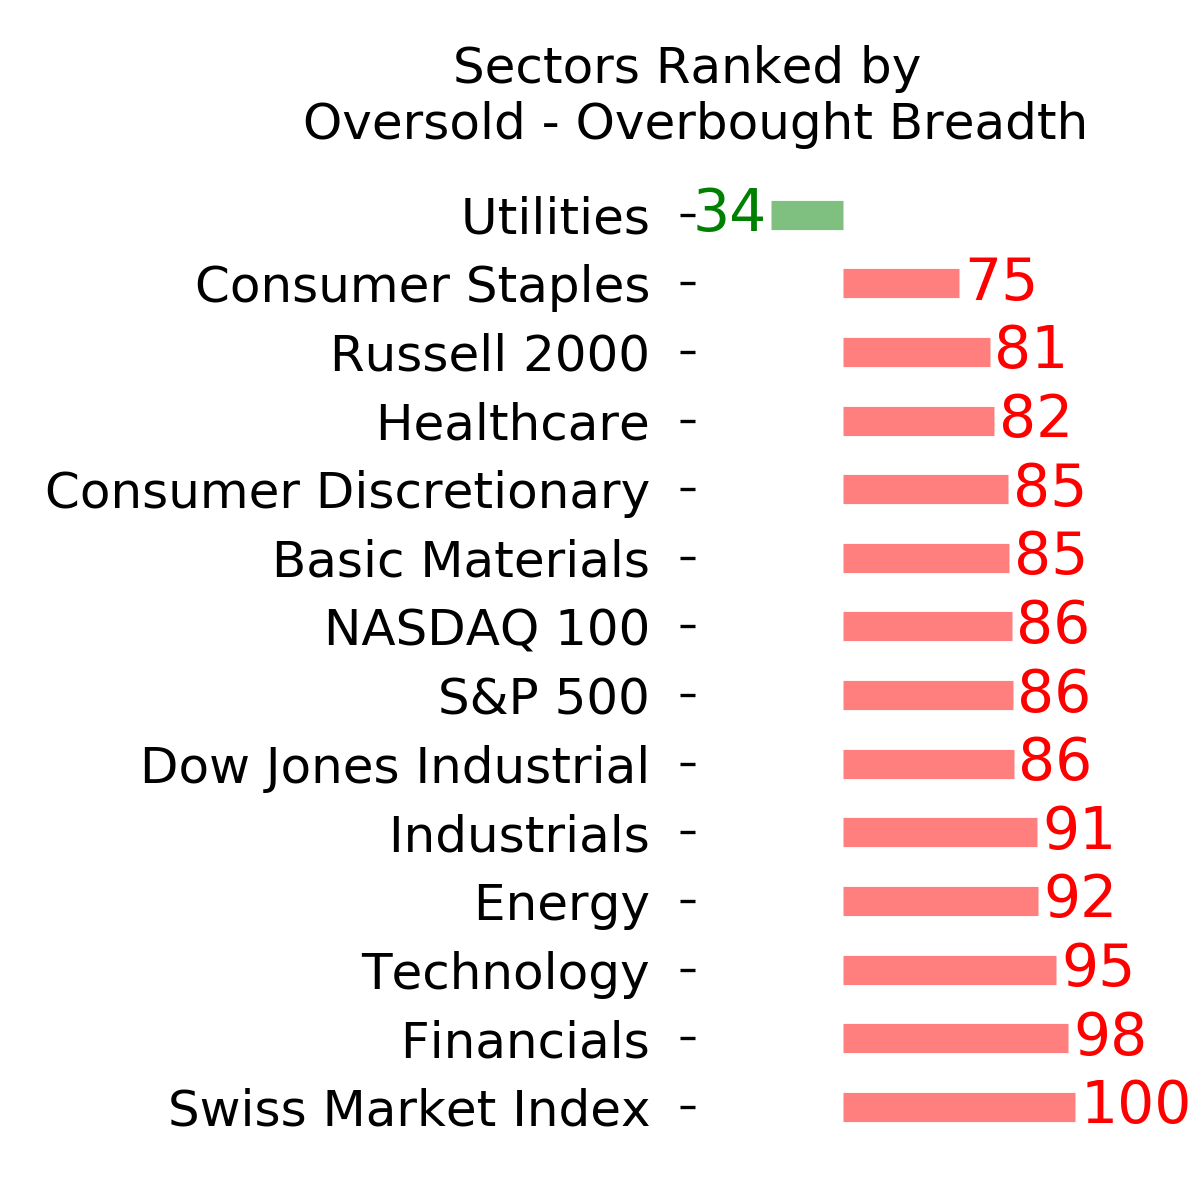
Ranks
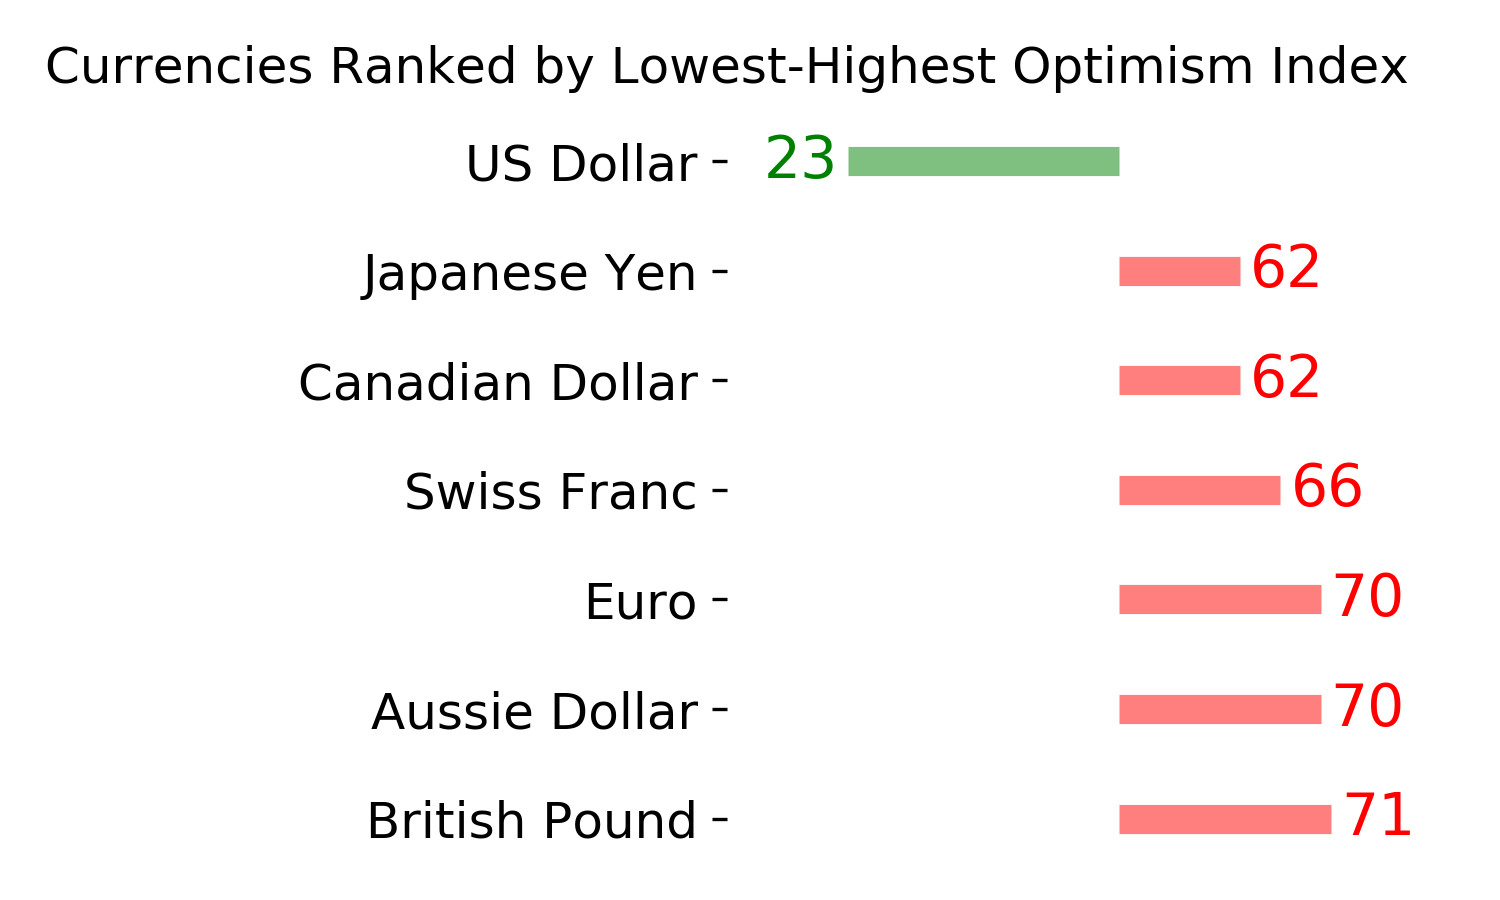
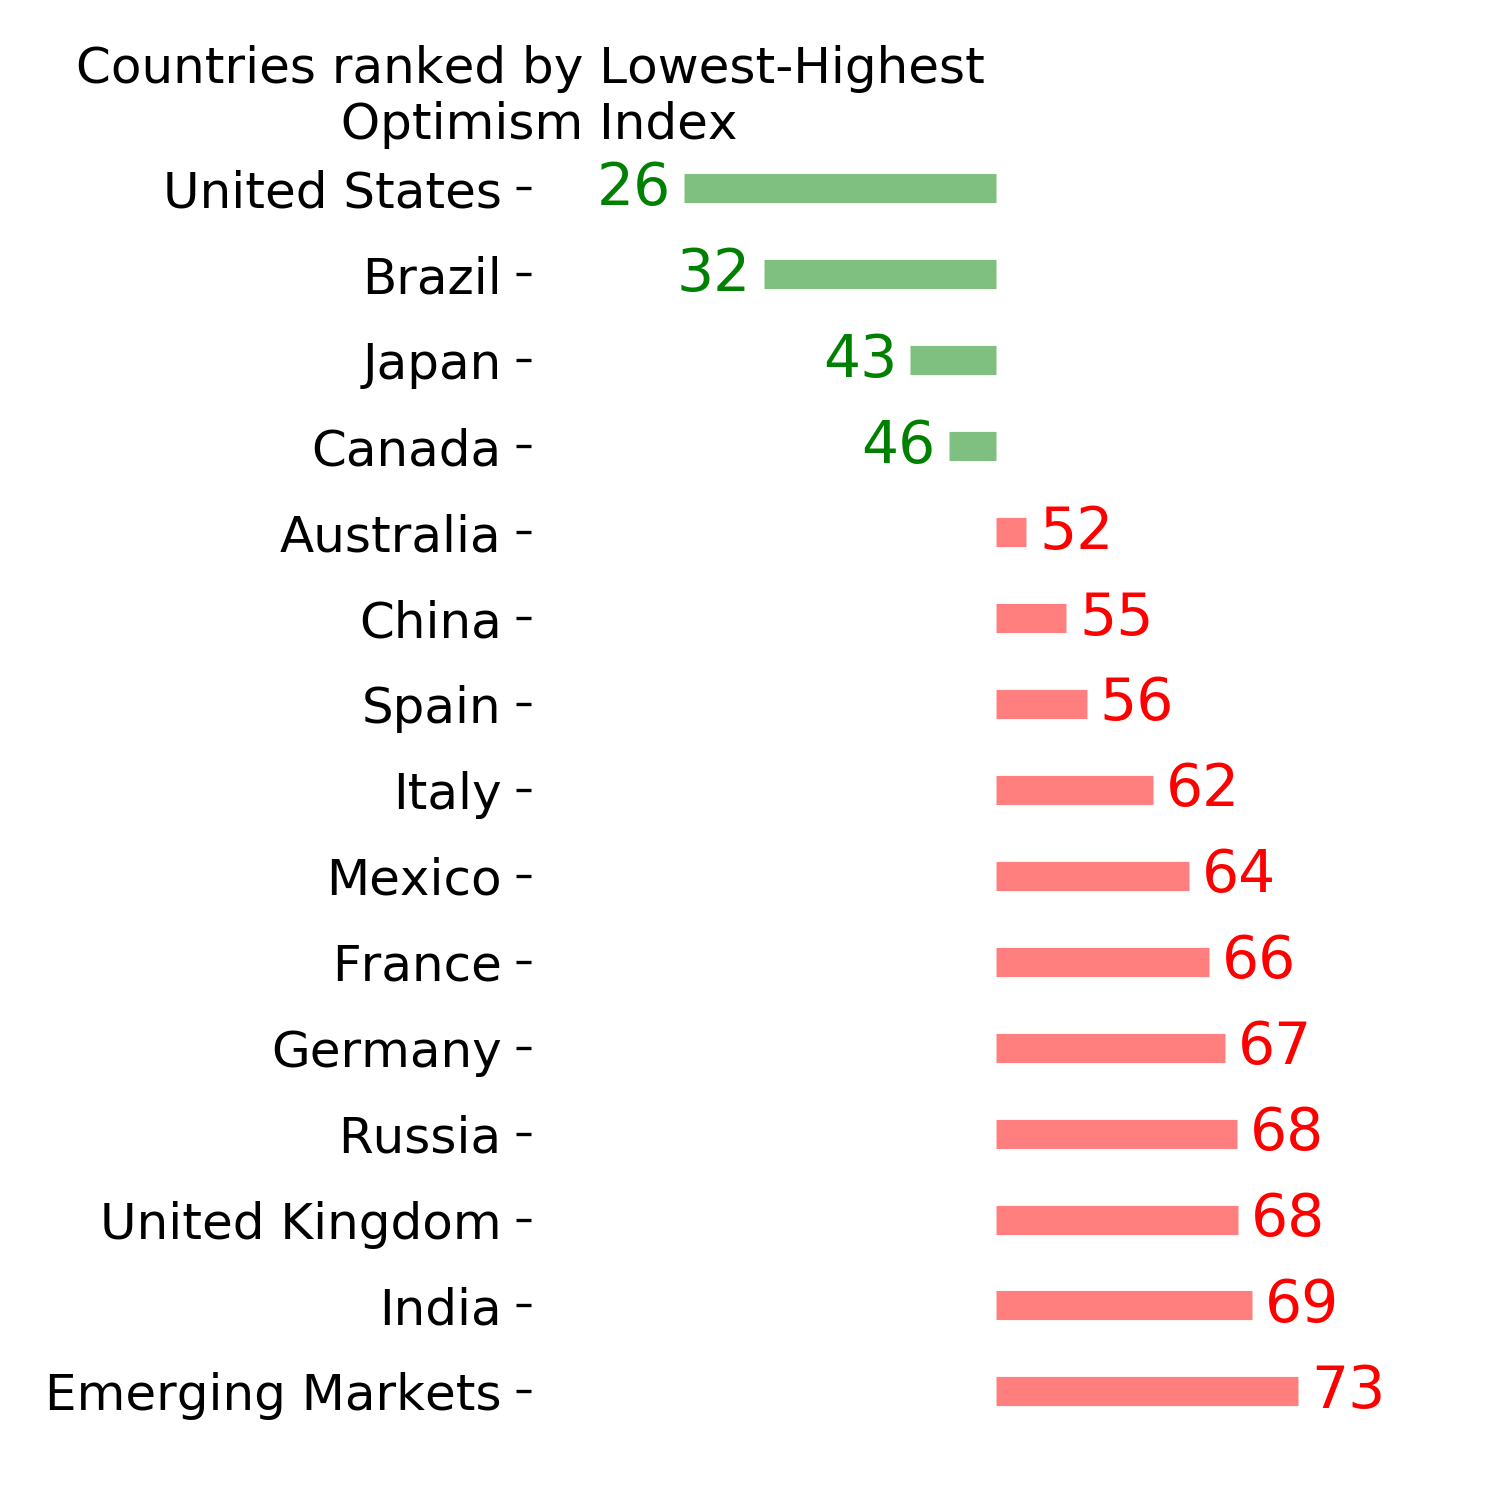
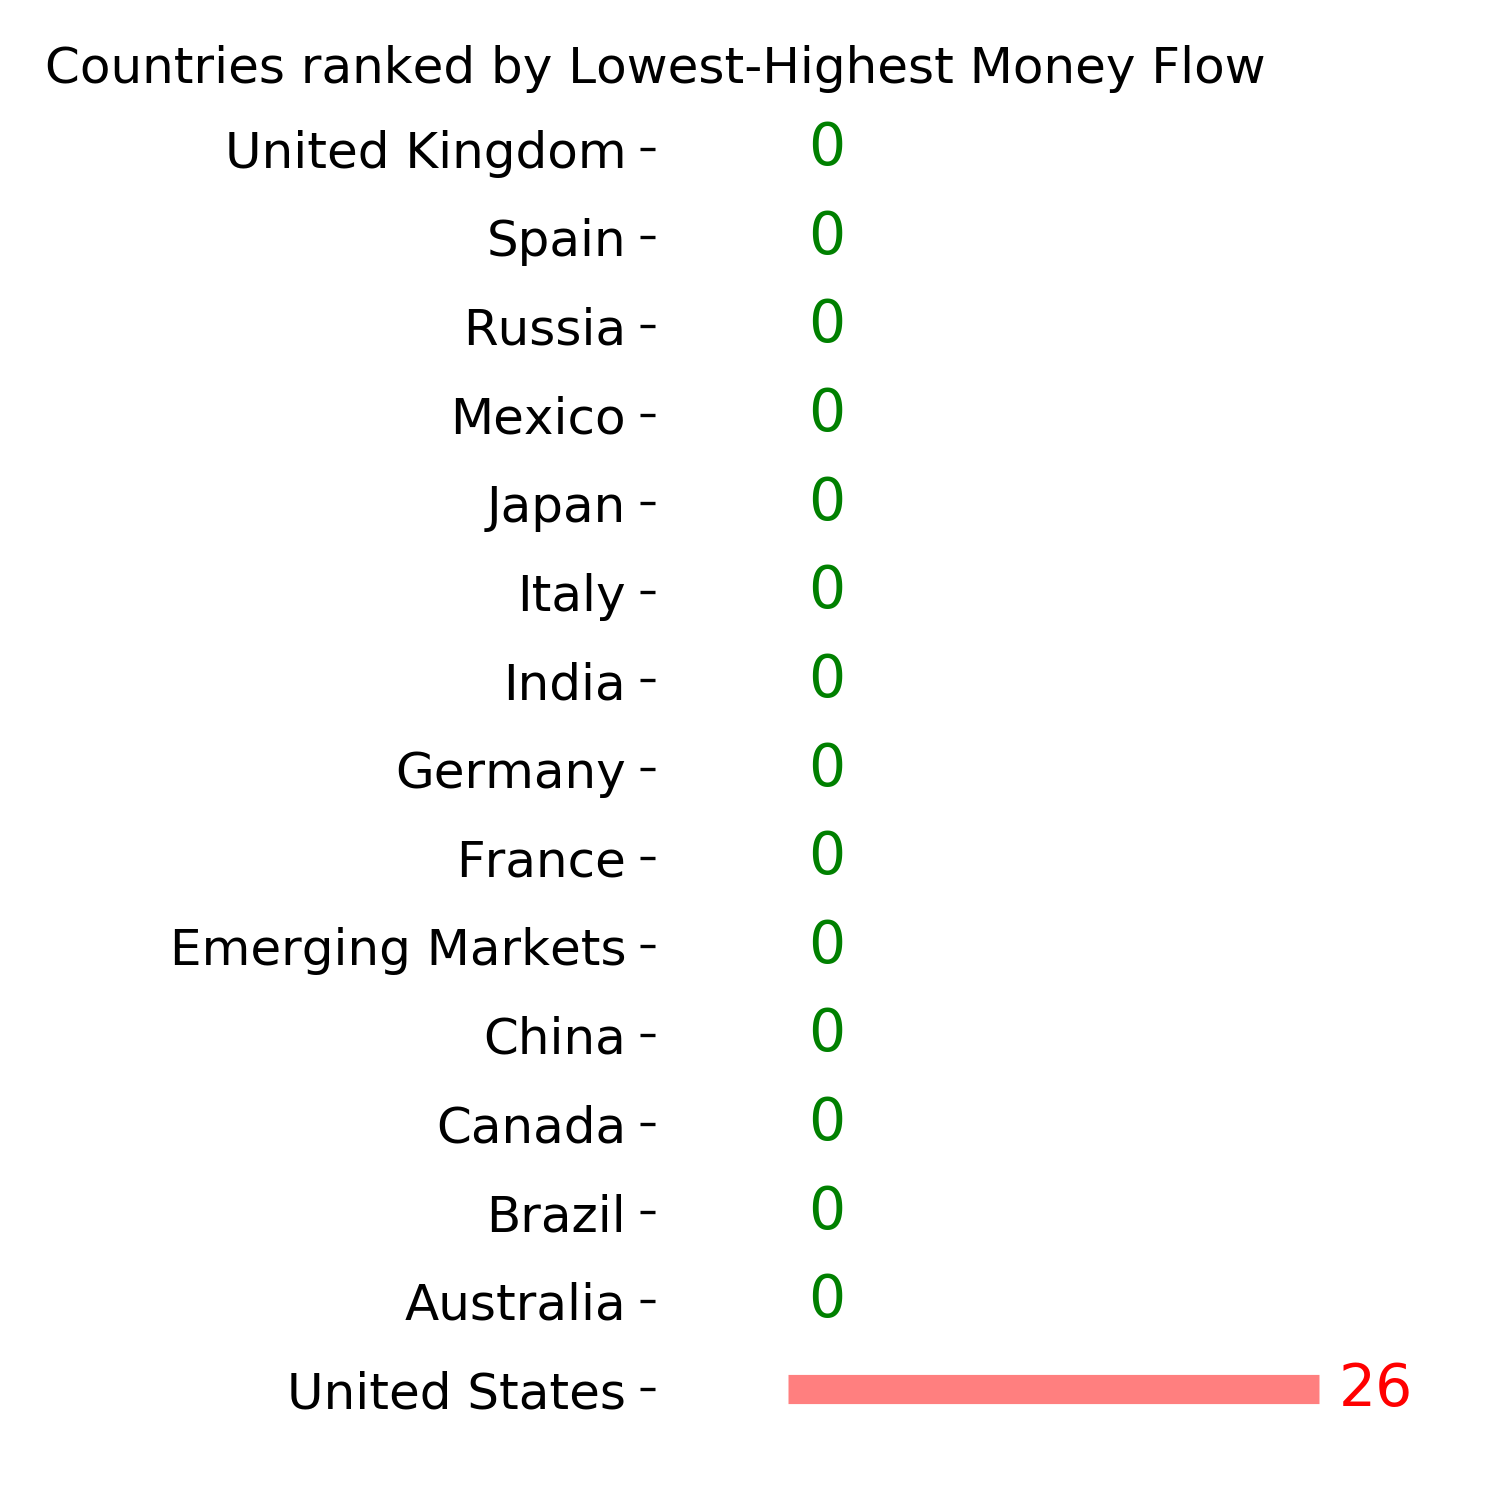
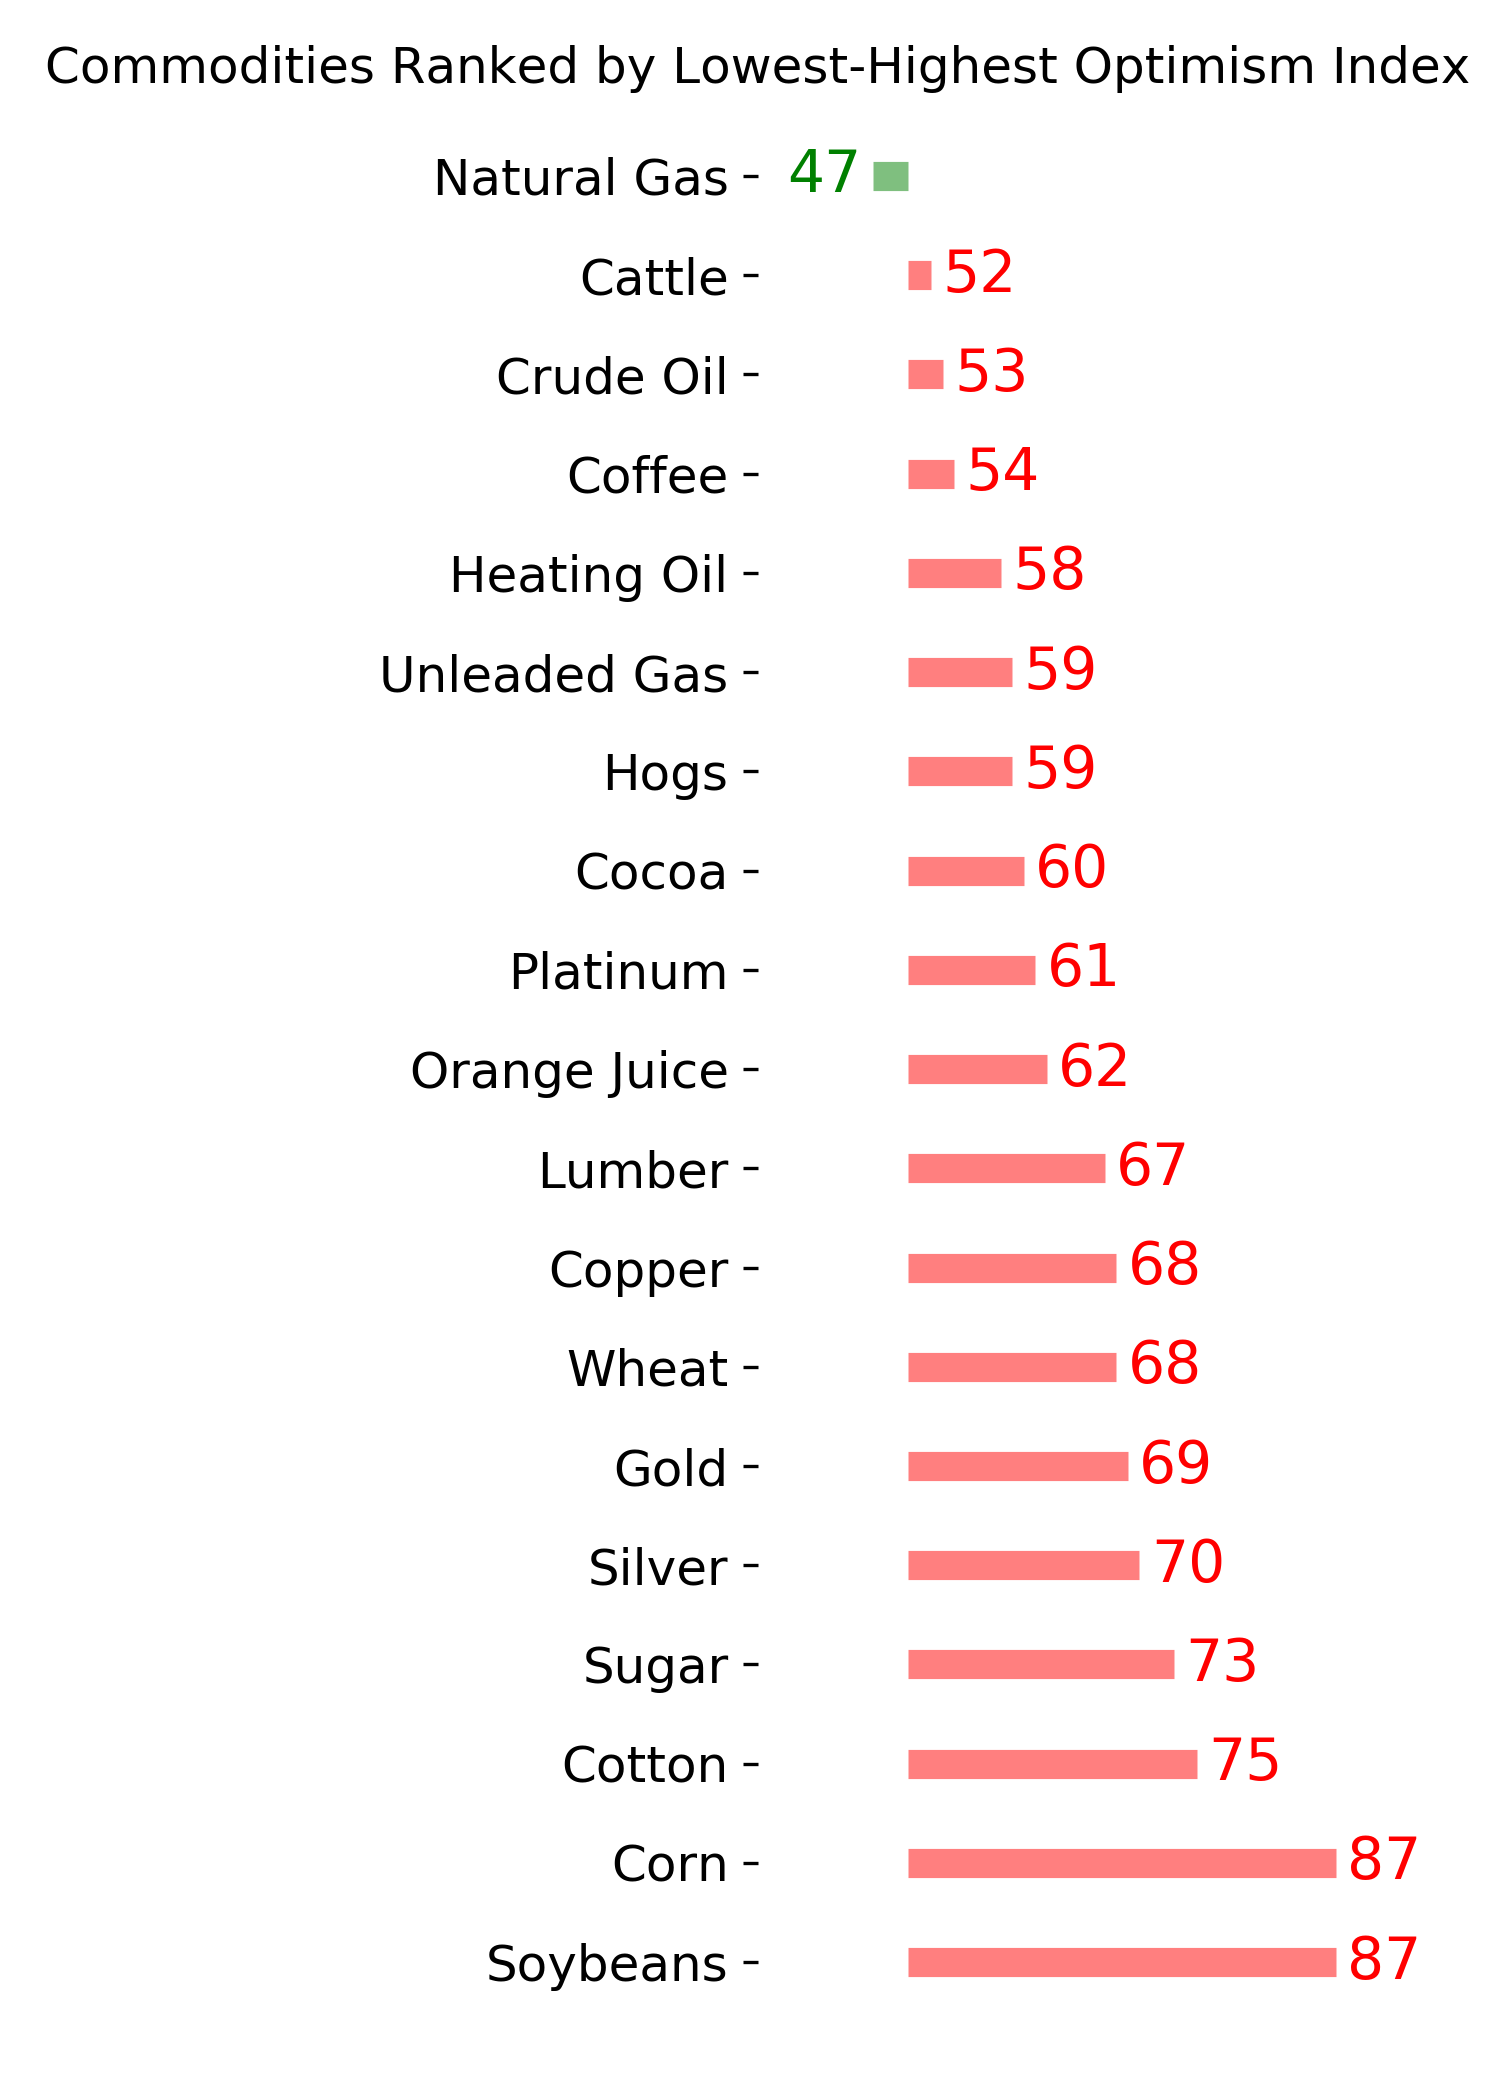
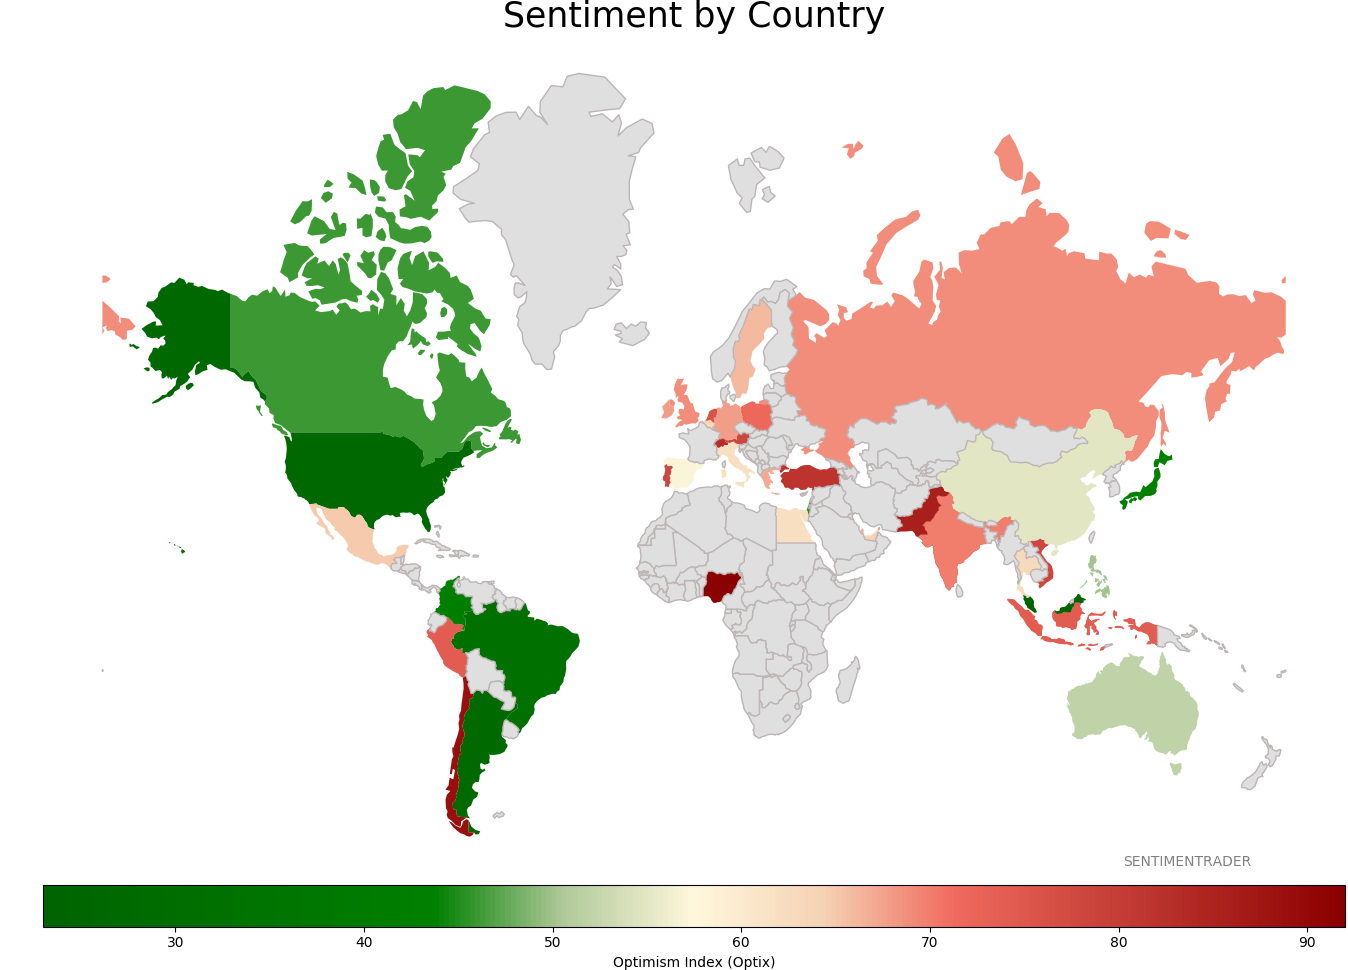
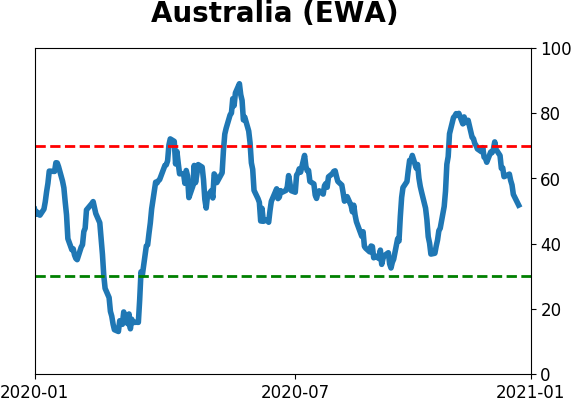
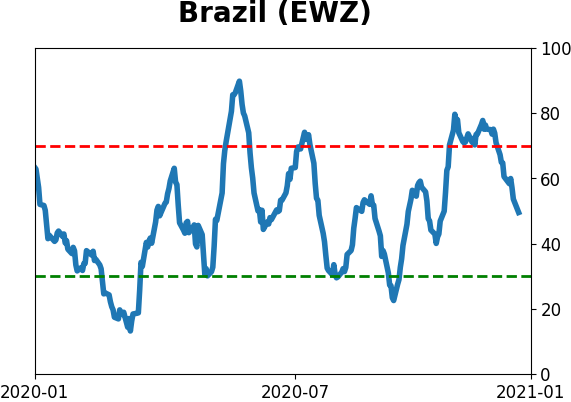
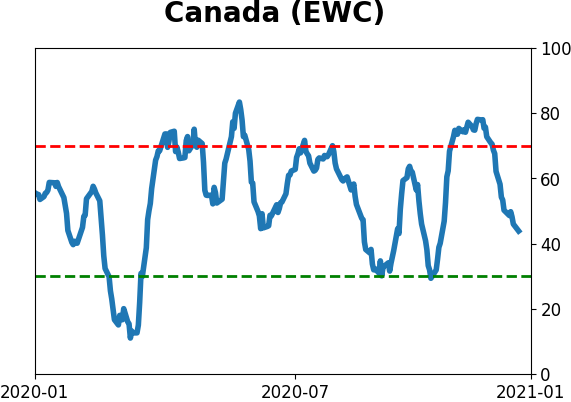
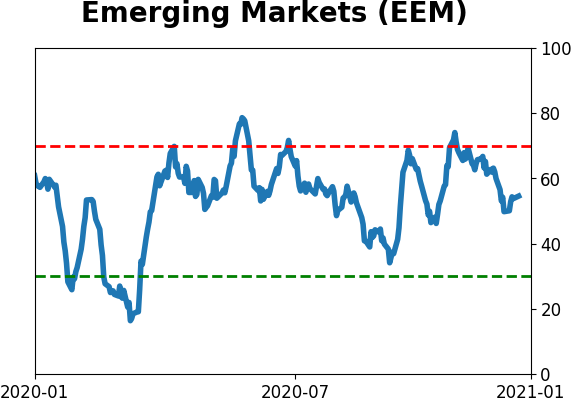
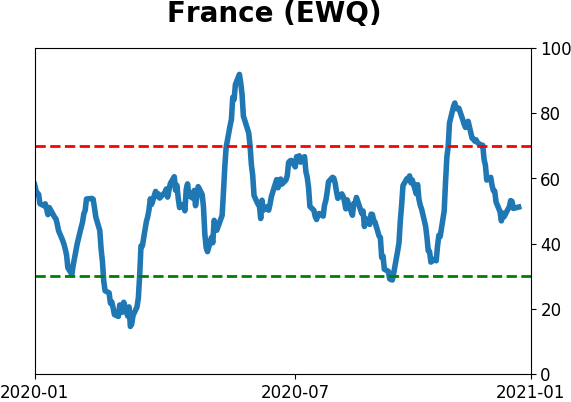
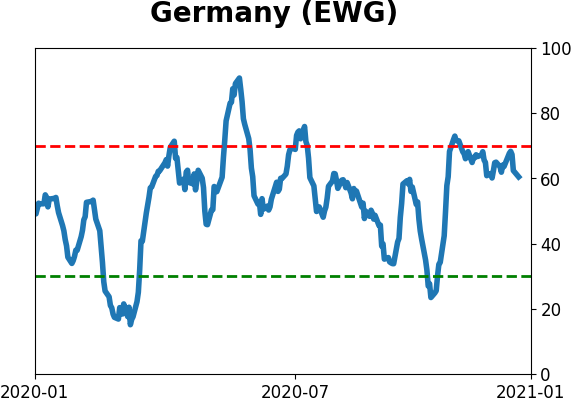
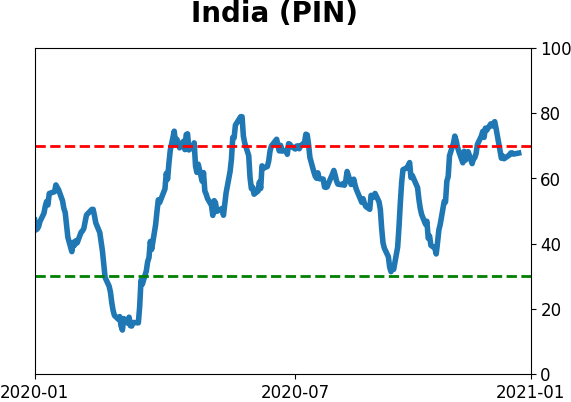
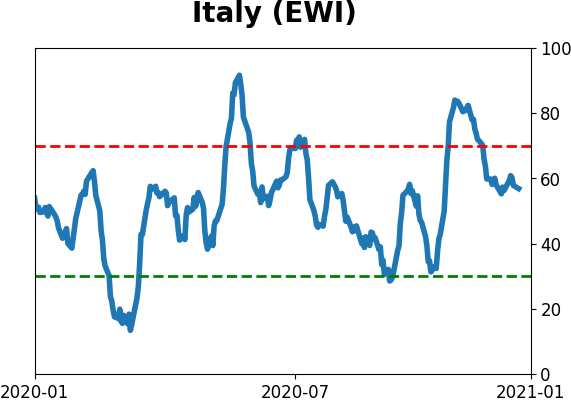
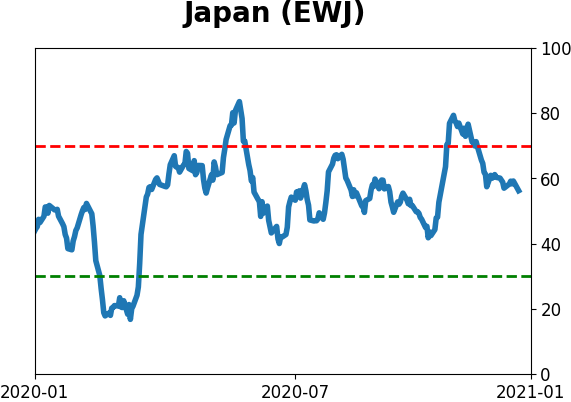
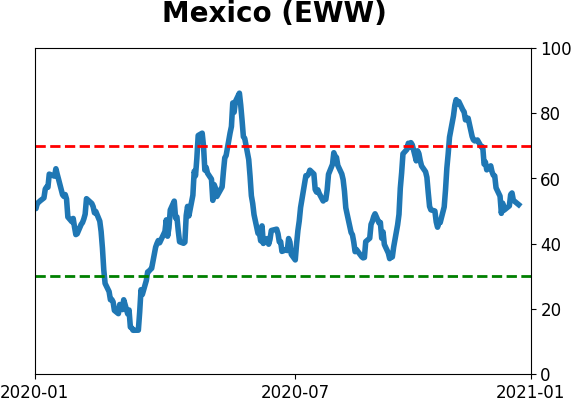
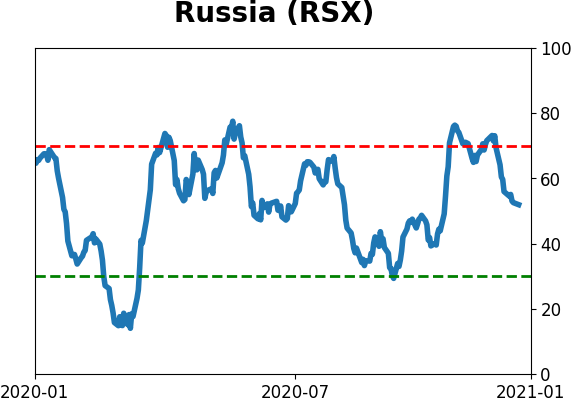
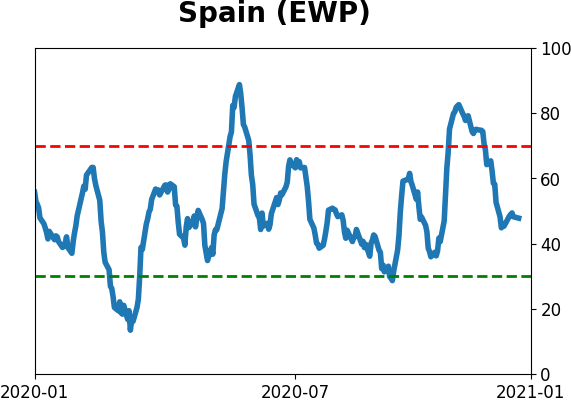
Sentiment Around The World
Optimism Index Thumbnails
|
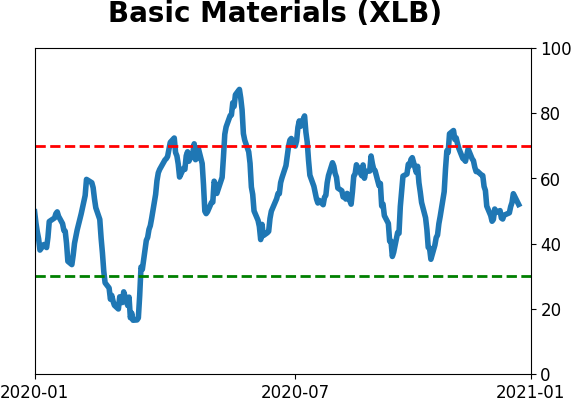
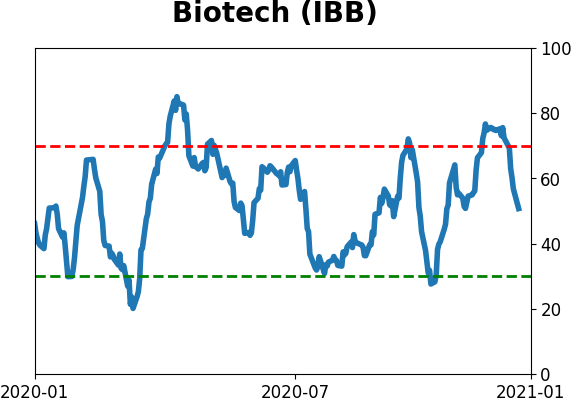
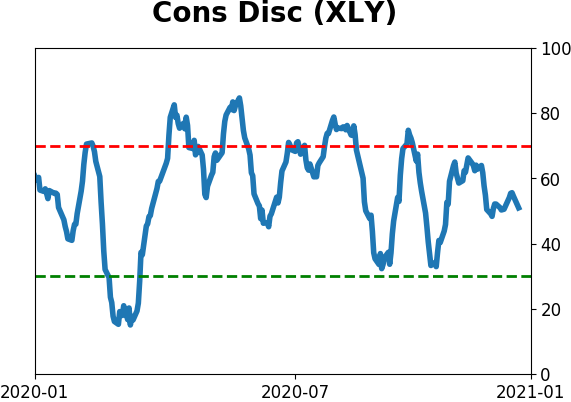
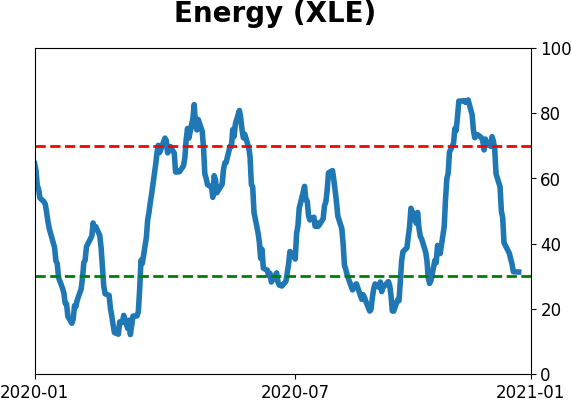
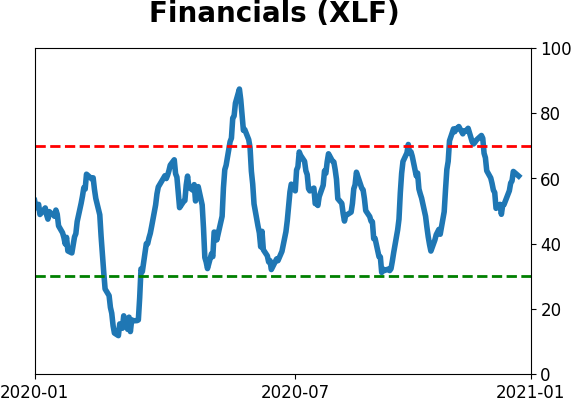
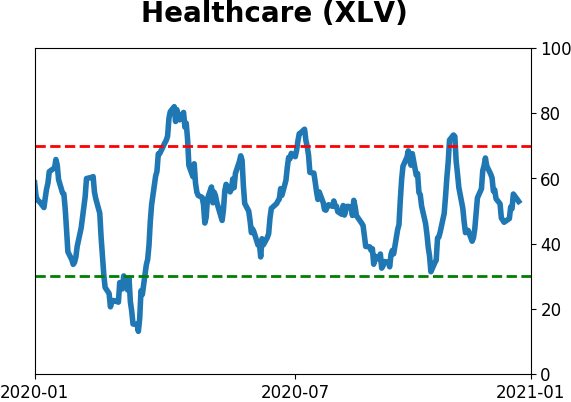
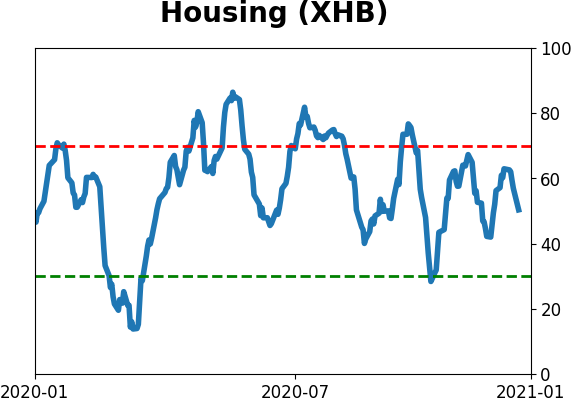
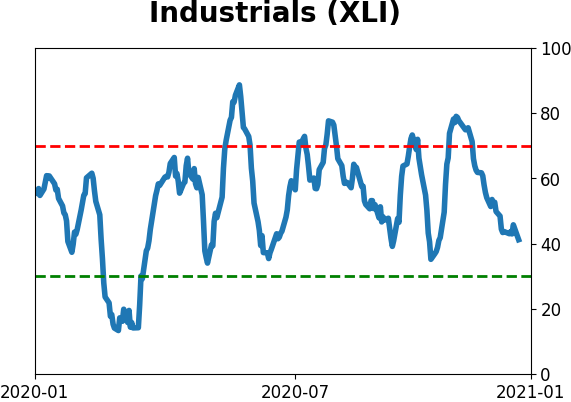
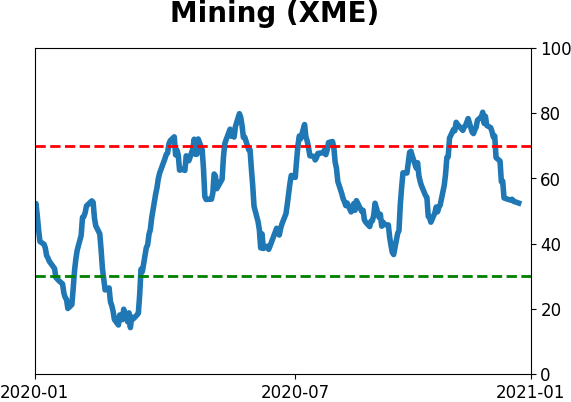
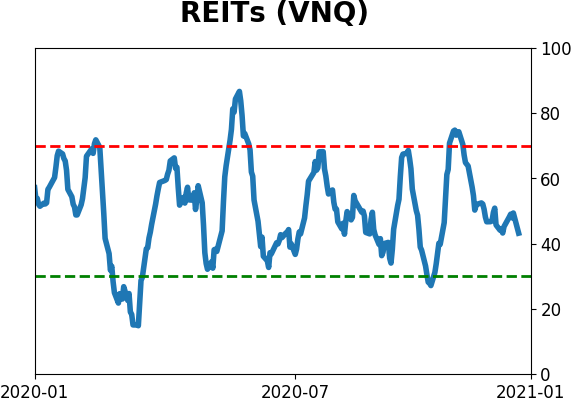
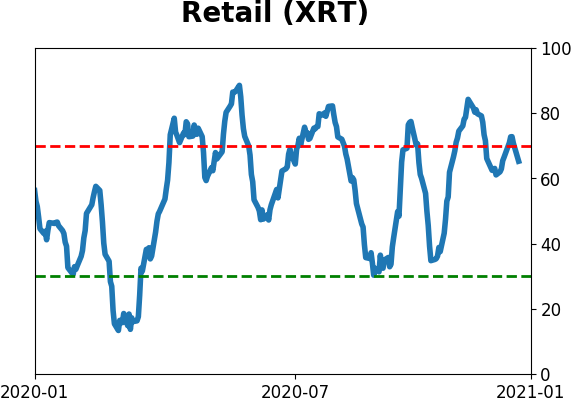
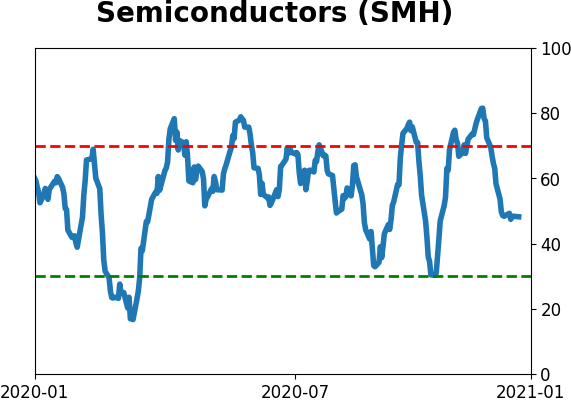
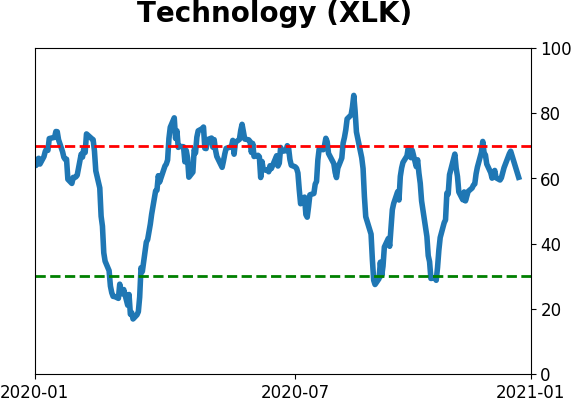
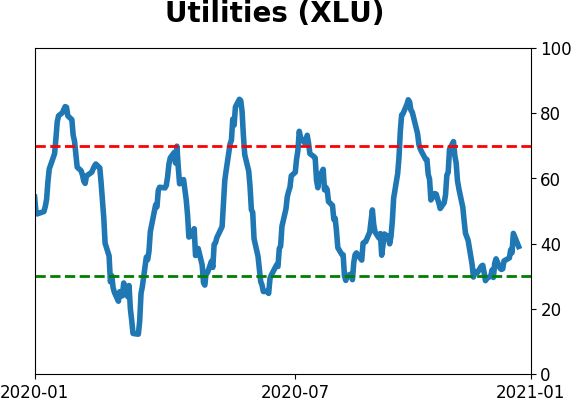
Sector ETF's - 10-Day Moving Average
|
|
|
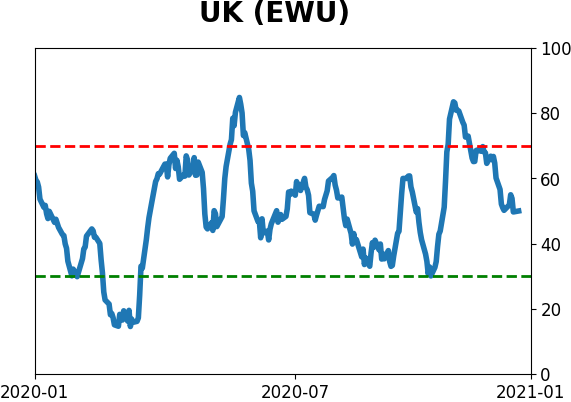
Country ETF's - 10-Day Moving Average
|
|
|
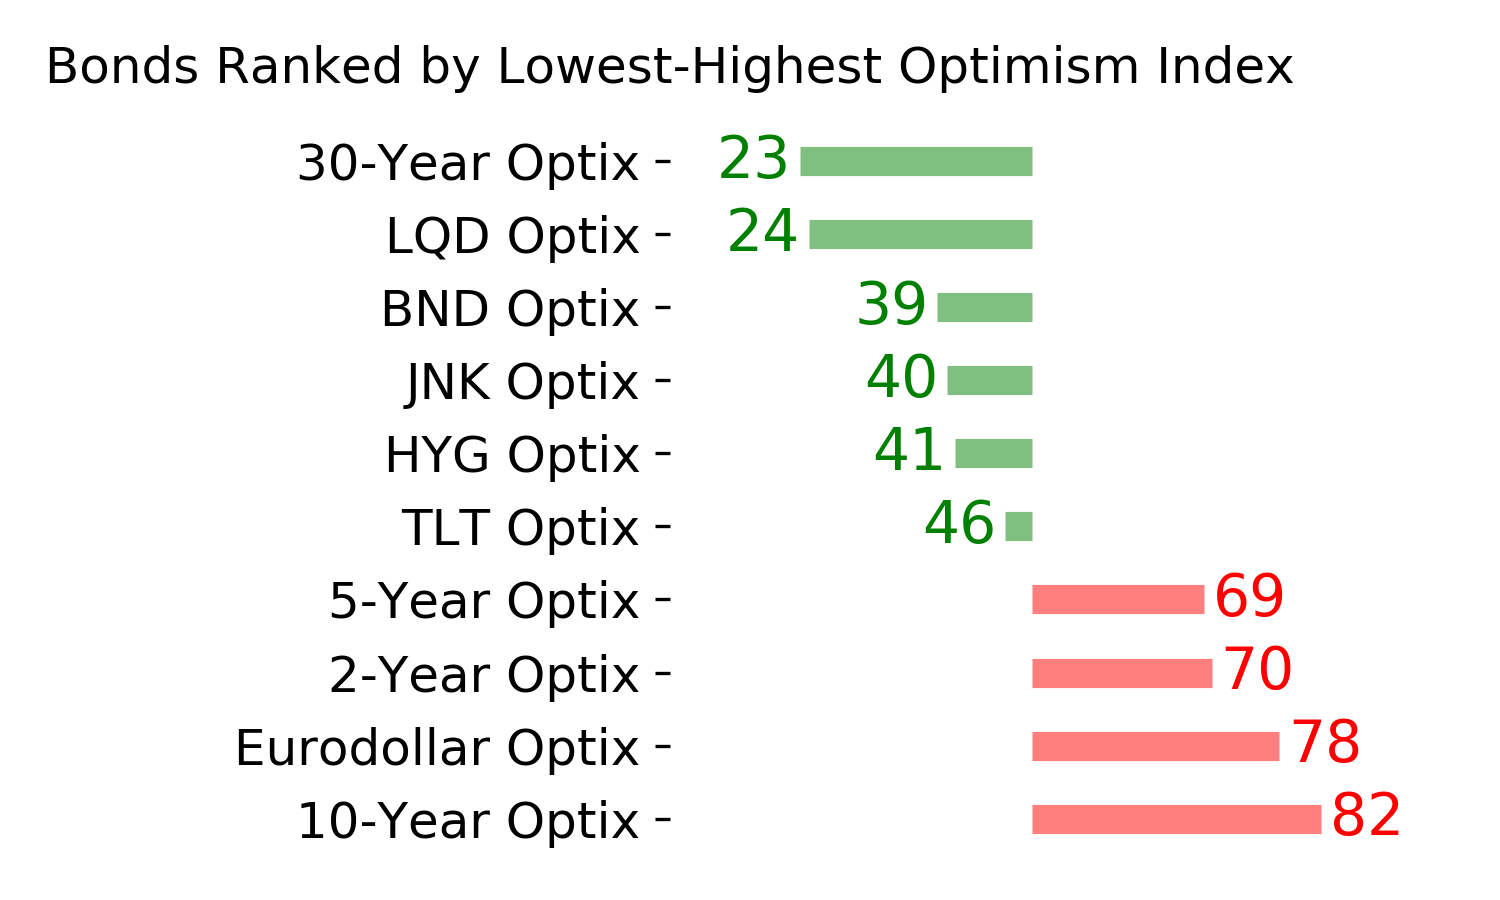
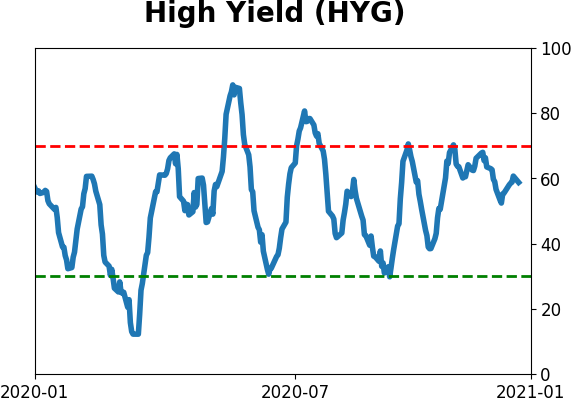
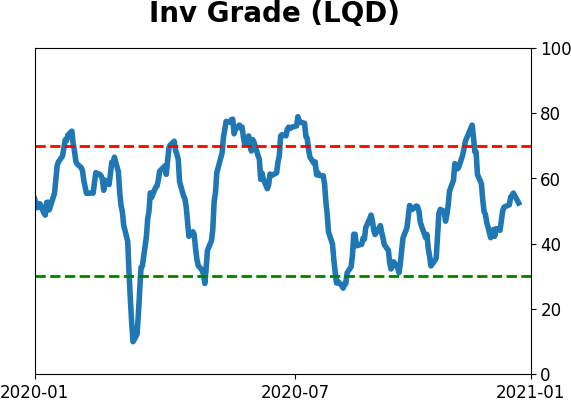
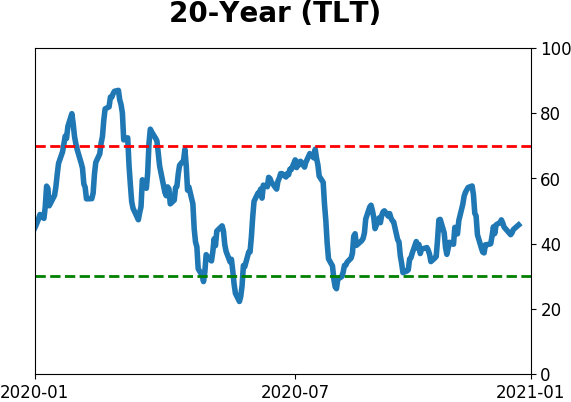
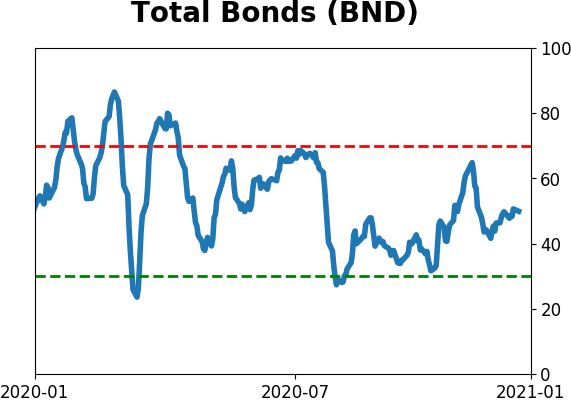
Bond ETF's - 10-Day Moving Average
|
|
|
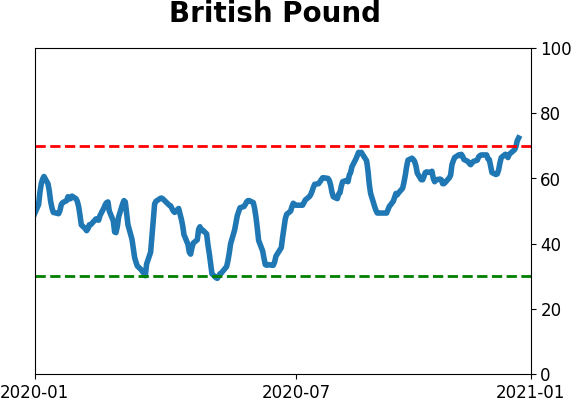
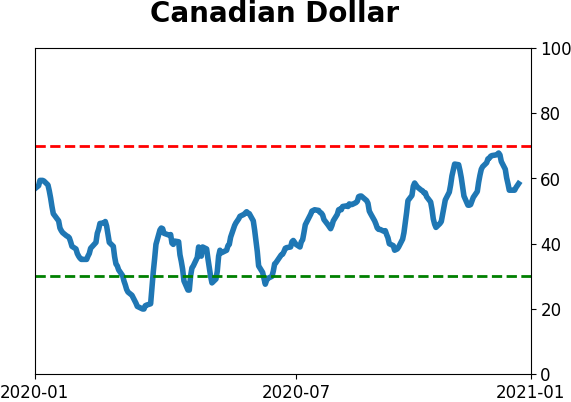
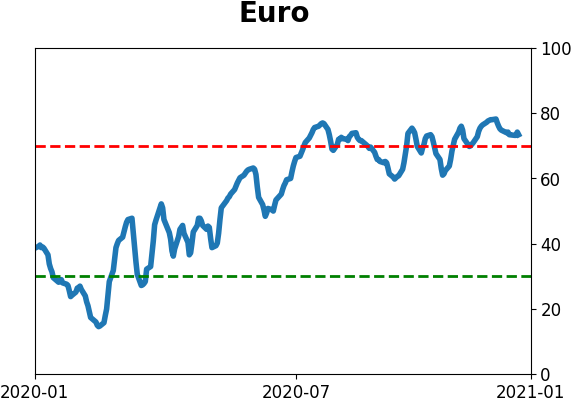
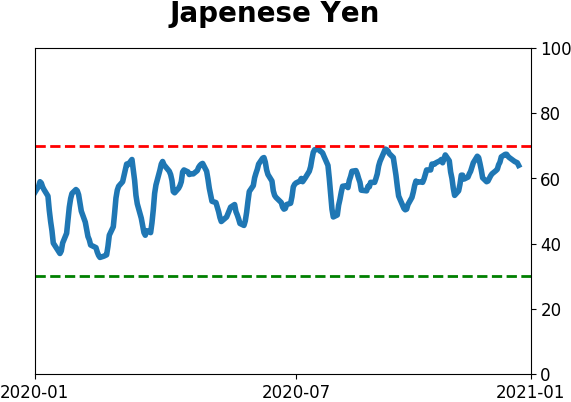
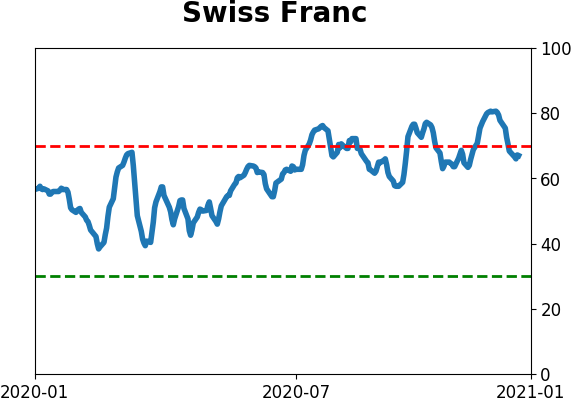
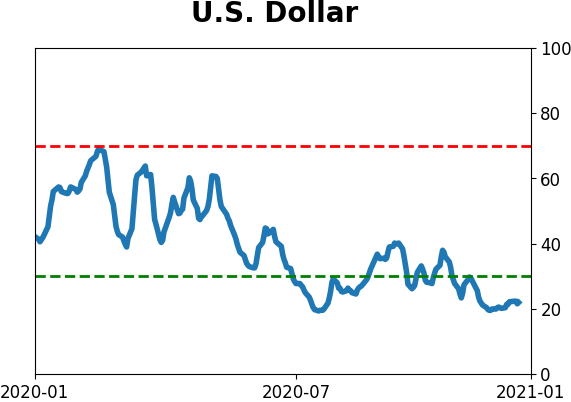
Currency ETF's - 5-Day Moving Average
|
|
|
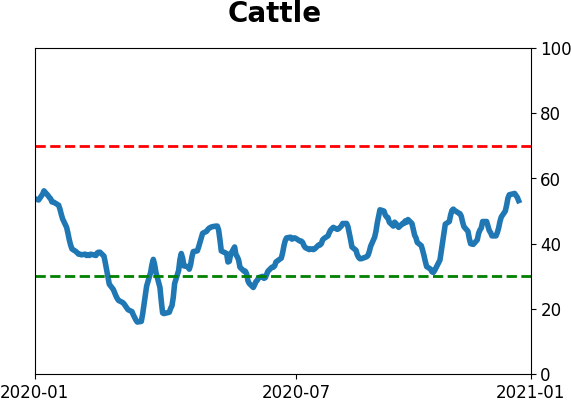
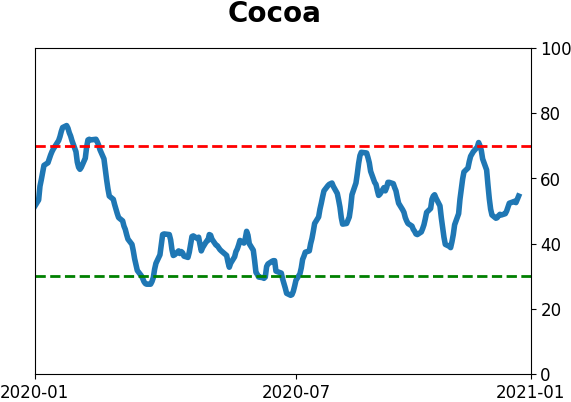
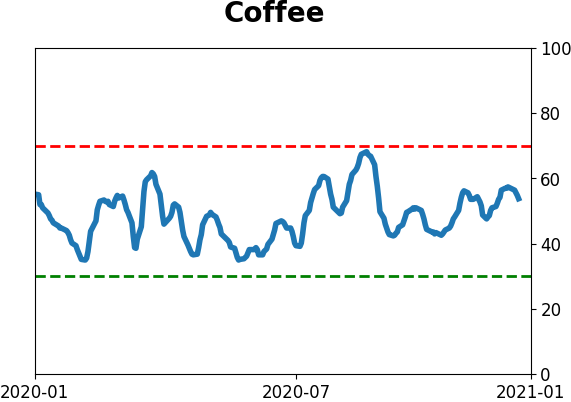
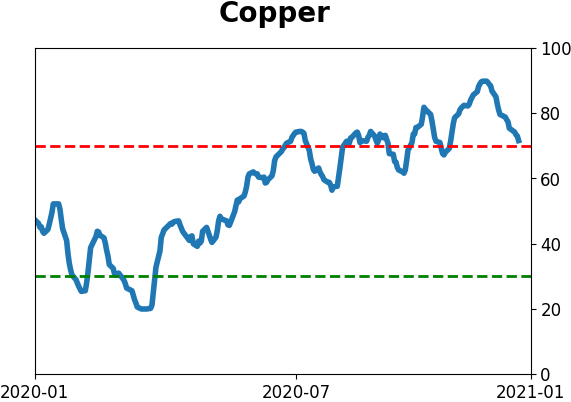
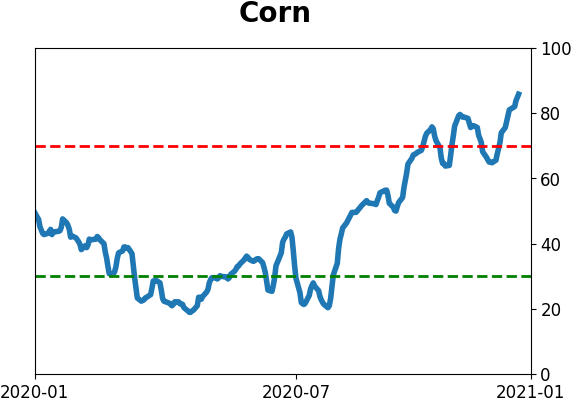
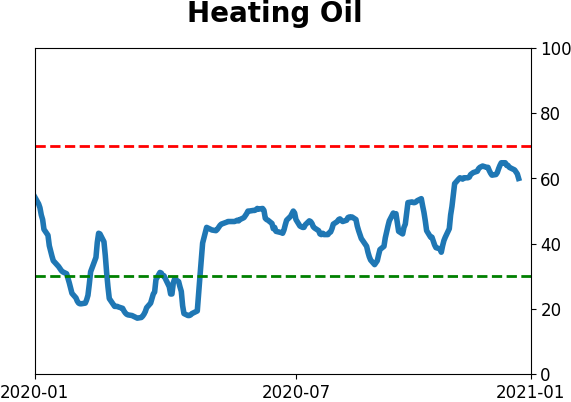
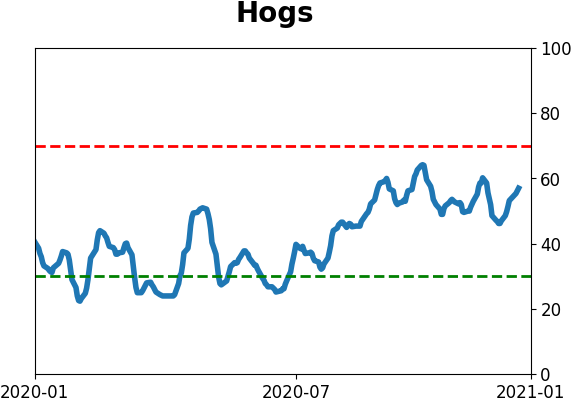
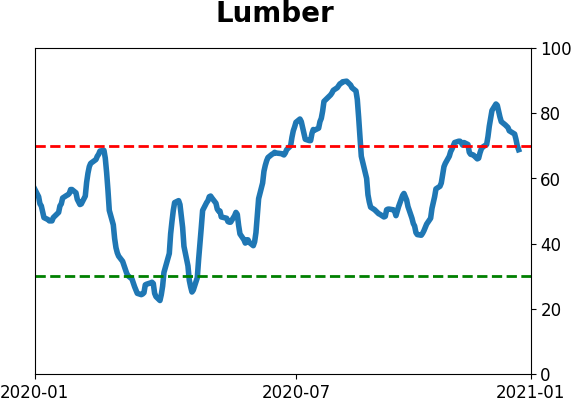
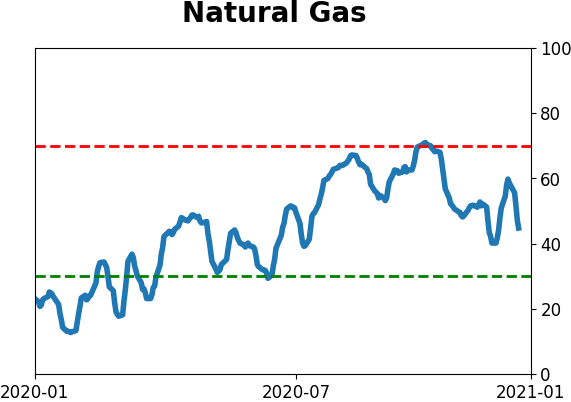
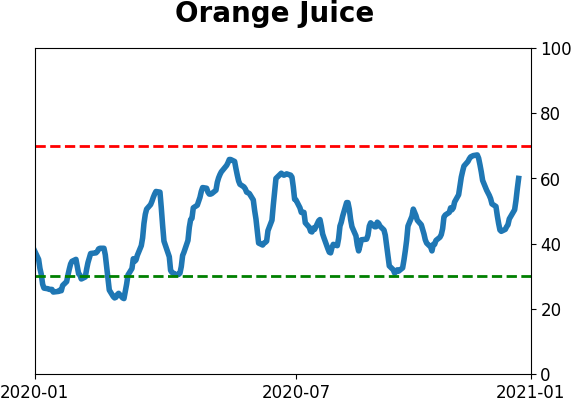
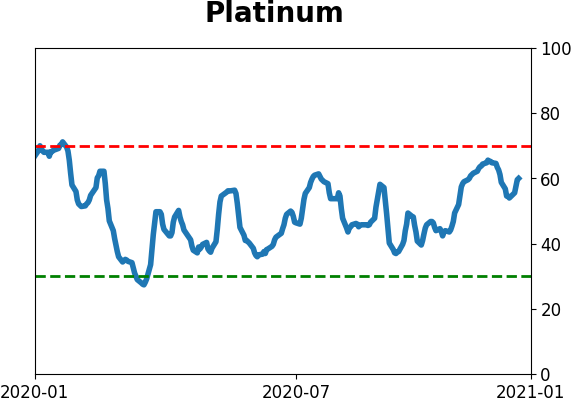
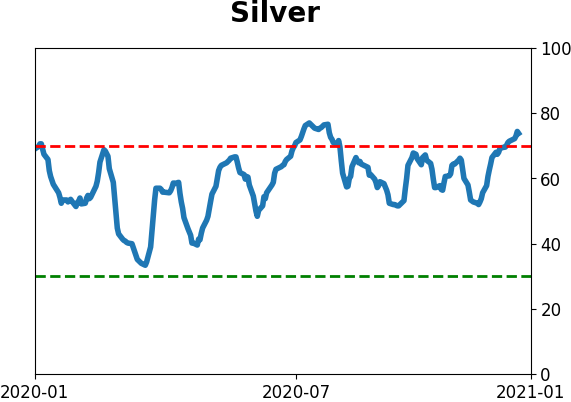
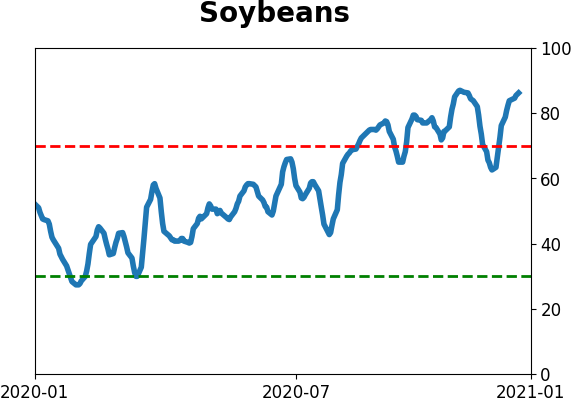
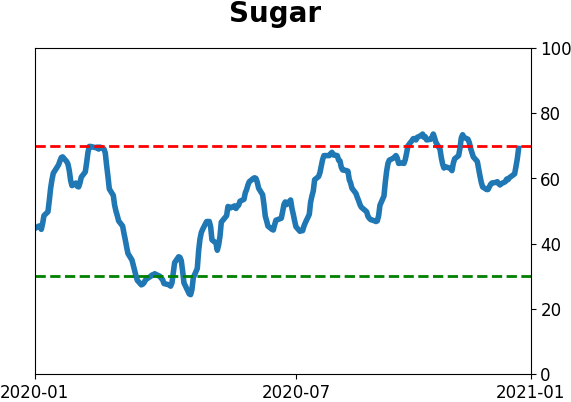
Commodity ETF's - 5-Day Moving Average
|
|