Data &
Technology
Research
Reports
Report Solutions
Reports Library
Actionable
Strategies
Free
Resources
Simple Backtest Calculator
Simple Seasonality Calculator
The Kelly Criterion Calculator
Sentiment Geo Map
Public Research Reports
Free Webinar
Pricing
Company
About
Meet Our Team
In the News
Testimonials
Client Success Stories
Contact
Log inLoginSign up
< BACK TO ALL REPORTS

Cyclical stocks are outperforming again

Jason Goepfert
2020-06-10
Driven by some of the most popular big tech firms, cyclical stocks just made a new high relative to defensive stocks for the first time in several months. Other times when cyclical stocks made a fresh relative high versus defensive stocks, it was good for the broader market, though the ratio is high enough now to be concerning on a long time frame.

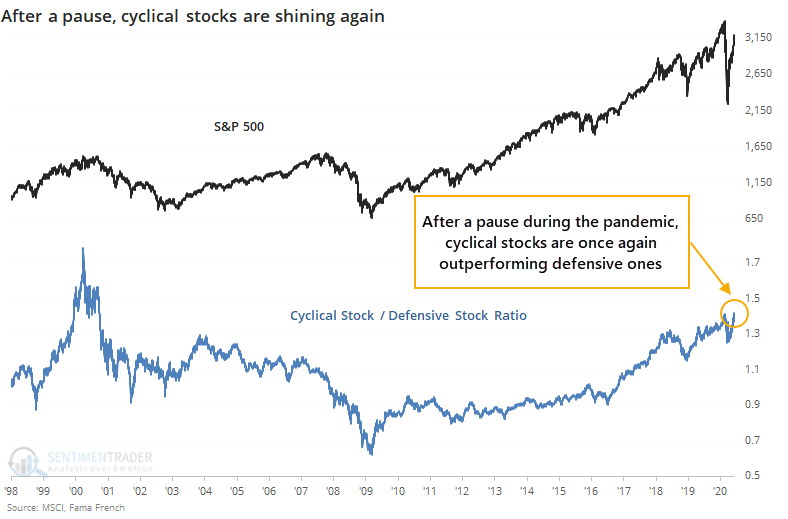
During the height of the pandemic panic, investors dumped stocks that were deemed most exposed to economic growth, favoring ones that are typically considered defensive.

Now that risk-on appetite is firmly in control, cyclical stocks are back in fashion. The ratio between them and defensive stocks just captured a new high for the first time in months.

Cyclical stocks are being driven by the usual culprits like Apple, Amazon, Microsoft, but also include JP Morgan, Visa, and Home Depot. Defensive stocks include Johnson & Johnson, Procter & Gamble, and UnitedHealth - companies making products that consumers tend to need no matter what the economy does.

Over a very long time frame, the ratio has gone much further, but even now it could be considered high. Extreme levels in the ratio tended to coincide with peaks in the S&P 500.

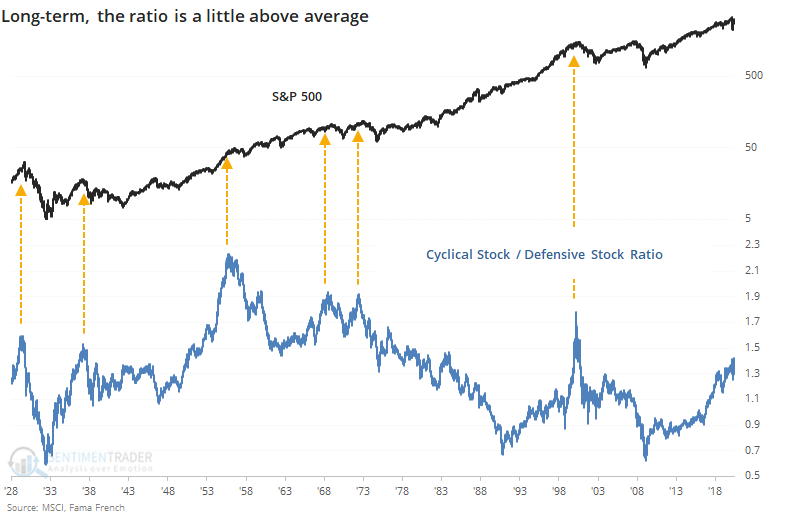
The problem is identifying when those peaks actually occurred in real-time, but using something like a 200-day average of the ratio was a decent trend identifier. Regardless, it doesn't matter right now since the ratio just hit a decade-high, so clearly it hasn't rolled over yet.

This evidence of risk-on behavior was mostly a good sign for the S&P.

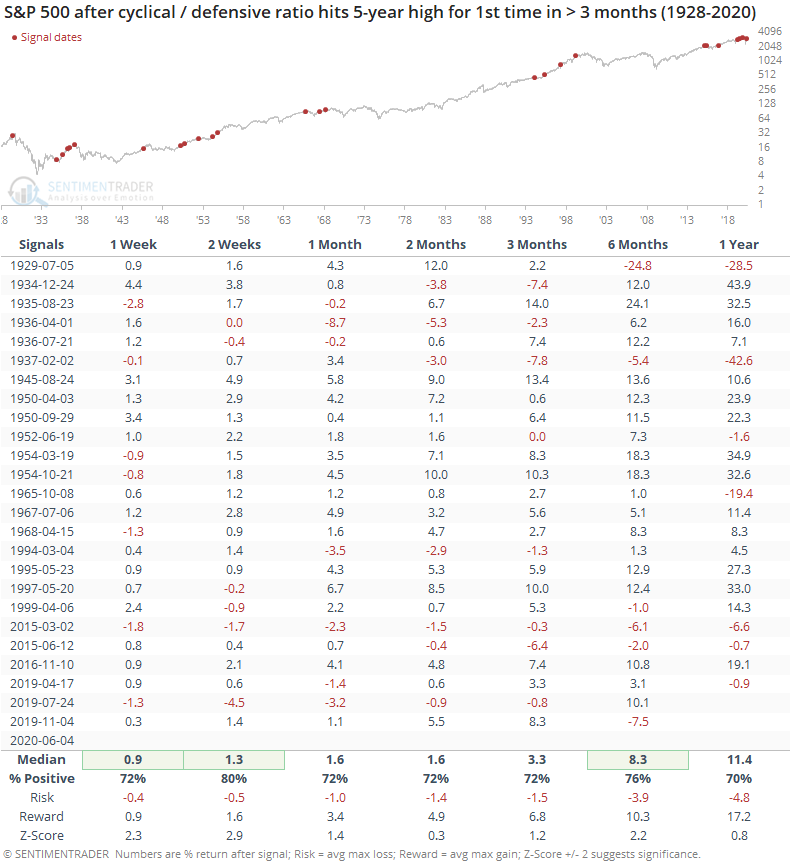
Returns over the short-term were good, medium-term were okay, and long-term were well above-average again. Over the next 6 months, there were few losses, and most of them were small. The risk/reward skew was more than 3-to-1 to the "reward" side, a rough gauge for what could be considered an edge.

For other factors, there was not a strong edge.

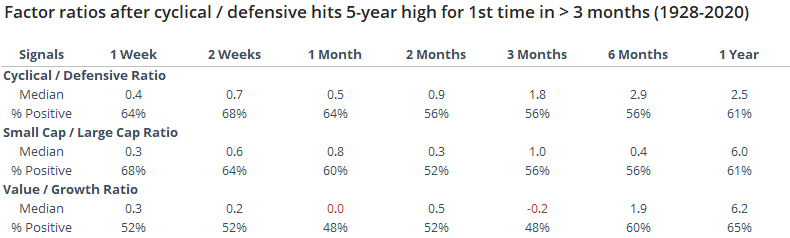
Because the ratio is already high, this breakout was not a good reason to expect cyclical stocks to continue to outperform defensive ones. Similarly, small-cap stocks did not consistently outperform large-cap ones, and value didn't consistently outperform growth.

Overall, the new relative high in cyclical stocks should be a modest positive for stock indexes like the S&P 500, but the ratio is high enough to be concerning and a turn lower in the ratio would likely signal a risk-off environment that's been tough for stocks to hold gains.

Sorry, you don't have access to this report

Upgrade your subscription plan to get access
Go to Dasboard
DATA &
TECHnologies
IndicatorEdge
‍
BackTestEdge
‍
Other Tools
‍
DataEdge API
RESEARCH
reports
Research Solution
‍
Reports Library
‍
actionable
Strategies
Trading Strategies
‍
Smart Stock Scanner
‍
FREE
RESOUrCES
Simple Backtest
Calculator
Simple Seasonality
Calculator
The Kelly Criterion
Calculator
Sentiment Geo Map
‍
Public Research Reports
‍
Free Webinar
COMPANY
‍
About
‍
Meet our Team
‍
In the News
‍
Testimonials
‍
Client Success Stories
Pricing
Bundle pricing
‍
Announcements
‍
FAQ
© 2024 Sundial Capital Research Inc. All rights reserved.
Setsail Marketing
TermsPrivacyAffiliate Program
Risk Disclosure: Futures and forex trading contains substantial risk and is not for every investor. An investor could potentially lose all or more than the initial investment. Risk capital is money that can be lost without jeopardizing ones’ financial security or life style. Only risk capital should be used for trading and only those with sufficient risk capital should consider trading. Past performance is not necessarily indicative of future results.

Hypothetical Performance Disclosure: Hypothetical performance results have many inherent limitations, some of which are described below. No representation is being made that any account will or is likely to achieve profits or losses similar to those shown; in fact, there are frequently sharp differences between hypothetical performance results and the actual results subsequently achieved by any particular trading program. One of the limitations of hypothetical performance results is that they are generally prepared with the benefit of hindsight. In addition, hypothetical trading does not involve financial risk, and no hypothetical trading record can completely account for the impact of financial risk of actual trading. for example, the ability to withstand losses or to adhere to a particular trading program in spite of trading losses are material points which can also adversely affect actual trading results. There are numerous other factors related to the markets in general or to the implementation of any specific trading program which cannot be fully accounted for in the preparation of hypothetical performance results and all which can adversely affect trading results.

Testimonial Disclosure: Testimonials appearing on this website may not be representative of other clients or customers and is not a guarantee of future performance or success.