
Cumulative New High / New Low Lagging

One of the most popular ways to view the breadth of a market is by watching the Cumulative Advance/Decline Line. And the most popular among the various versions is the one tracking all NYSE securities, or the one using common stocks only. A much lesser-known version of the Cumulative Line uses the number of new 52-week highs minus 52-week lows.
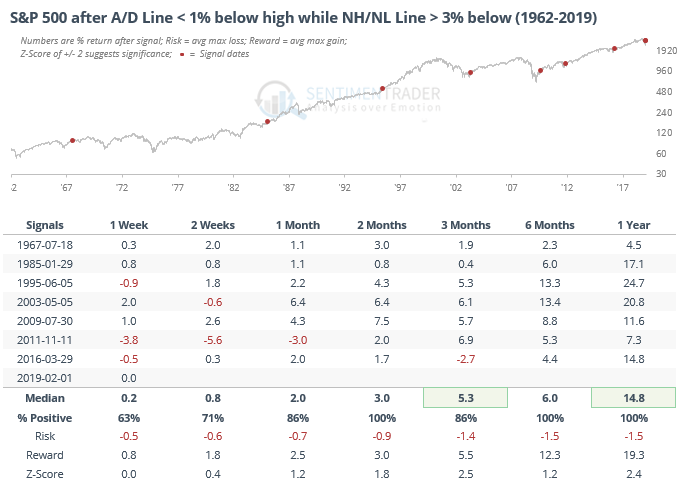
The table below shows any time the Cumulative Advance/Decline Line rallied to within 1% of its 52-week high, while the Cumulative New High / New Low Line was at least 3% below its own high. These are divergences like we’re seeing now and as outlined in the February 11 Daily Report, it has been a good longer-term sign for stocks.