Data &
Technology
Research
Reports
Report Solutions
Reports Library
Actionable
Strategies
Free
Resources
Simple Backtest Calculator
Simple Seasonality Calculator
The Kelly Criterion Calculator
Sentiment Geo Map
Public Research Reports
Free Webinar
Pricing
Company
About
Meet Our Team
In the News
Testimonials
Client Success Stories
Contact
Log inLoginSign up
< BACK TO ALL REPORTS

Crude Oil's New Bear Market

Jason Goepfert
2017-06-20
null

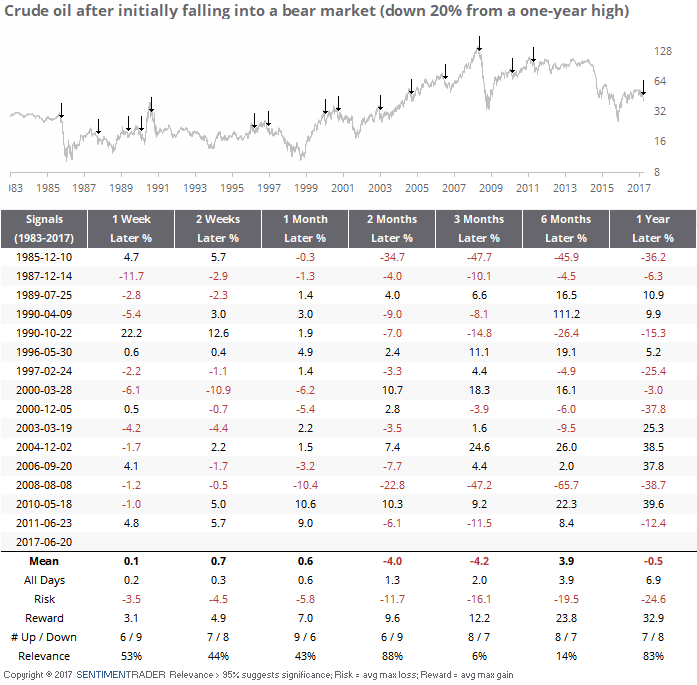
Markets are mostly quiet (again), but not so much in the energy patch. Oil is getting hit again and is now down 20% from its most recent peak, arbitrarily considered a bear market at this point.

We saw in a recent report that although oil has lost 2% a week for the past few weeks, it hasn't been enough to signal selling exhaustion. Especially since most of the indicators we look at still are not showing excessive pessimism.

Let's take a look at times when oil initially fell into bear market territory and see if that was enough to provide some relief:

Not really. Oil continued to fall about as often as rebound. Two months later, it was actually down even more the majority of the time and had a terrible risk/reward ratio. Longer-term returns were extremely volatile, with average risk over the next year of nearly -25% versus reward of +33%. There's no edge there.

How about for stocks?

The S&P 500 index didn't respond all that well to new oil bear markets. Over the next couple of months, it rallied only 7 out of the 15 times, sported a negative average return and nearly 2-to-1 risk-to-reward ratio. Since 1996, it led to negative returns 8 out of 10 times over the next two months.

How about for energy stocks specifically?

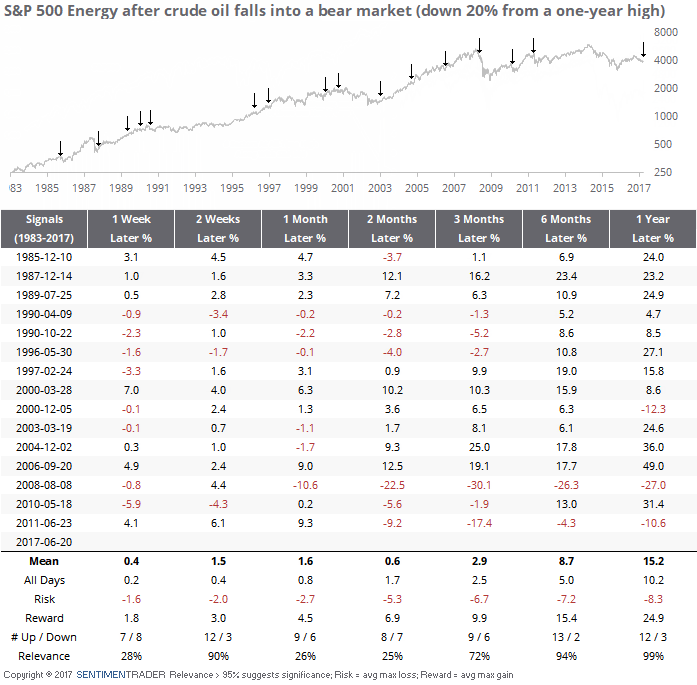
Again, not great. Energy stocks within the S&P 500 did tend to rebound over the next two weeks, up 12 out of the 15 times, but over the medium-term it was mixed. Six months later, Energy stocks were up 13 times, with a good average return and risk/reward ratio, but the losses in 2008 and 2010 were large.

How about Transports? Oil is a cost input so perhaps trucking firms and airline stocks took advantage.

There isn't much evident of that here. The last three times all led to losses over the next 2-3 months. Transports' overall average returns were about in line with random, and the risk/reward skews were underwhelming. That was especially the case if Transports were near their highs at the time. So much for cost savings.

There's going to be an opportunity in this sector before long if the selling continues like this, but so far everything we've looked at has been inconclusive, especially on a short- to medium-term time frame. The fall is disturbing for stocks, which have suffered in recent years when oil dropped so much.

Sorry, you don't have access to this report

Upgrade your subscription plan to get access
Go to Dasboard
DATA &
TECHnologies
IndicatorEdge
‍
BackTestEdge
‍
Other Tools
‍
DataEdge API
RESEARCH
reports
Research Solution
‍
Reports Library
‍
actionable
Strategies
Trading Strategies
‍
Smart Stock Scanner
‍
FREE
RESOUrCES
Simple Backtest
Calculator
Simple Seasonality
Calculator
The Kelly Criterion
Calculator
Sentiment Geo Map
‍
Public Research Reports
‍
Free Webinar
COMPANY
‍
About
‍
Meet our Team
‍
In the News
‍
Testimonials
‍
Client Success Stories
Pricing
Bundle pricing
‍
Announcements
‍
FAQ
© 2024 Sundial Capital Research Inc. All rights reserved.
Setsail Marketing
TermsPrivacyAffiliate Program
Risk Disclosure: Futures and forex trading contains substantial risk and is not for every investor. An investor could potentially lose all or more than the initial investment. Risk capital is money that can be lost without jeopardizing ones’ financial security or life style. Only risk capital should be used for trading and only those with sufficient risk capital should consider trading. Past performance is not necessarily indicative of future results.

Hypothetical Performance Disclosure: Hypothetical performance results have many inherent limitations, some of which are described below. No representation is being made that any account will or is likely to achieve profits or losses similar to those shown; in fact, there are frequently sharp differences between hypothetical performance results and the actual results subsequently achieved by any particular trading program. One of the limitations of hypothetical performance results is that they are generally prepared with the benefit of hindsight. In addition, hypothetical trading does not involve financial risk, and no hypothetical trading record can completely account for the impact of financial risk of actual trading. for example, the ability to withstand losses or to adhere to a particular trading program in spite of trading losses are material points which can also adversely affect actual trading results. There are numerous other factors related to the markets in general or to the implementation of any specific trading program which cannot be fully accounted for in the preparation of hypothetical performance results and all which can adversely affect trading results.

Testimonial Disclosure: Testimonials appearing on this website may not be representative of other clients or customers and is not a guarantee of future performance or success.