
Crude Oil Term Structure flashes a potential warning sign

Key points
- Crude Oil futures term structure recently crossed a potentially significant level
- This action may have implications for the energy complex
- However, there is a question of recency bias for traders to consider
Crude Oil Term Structure
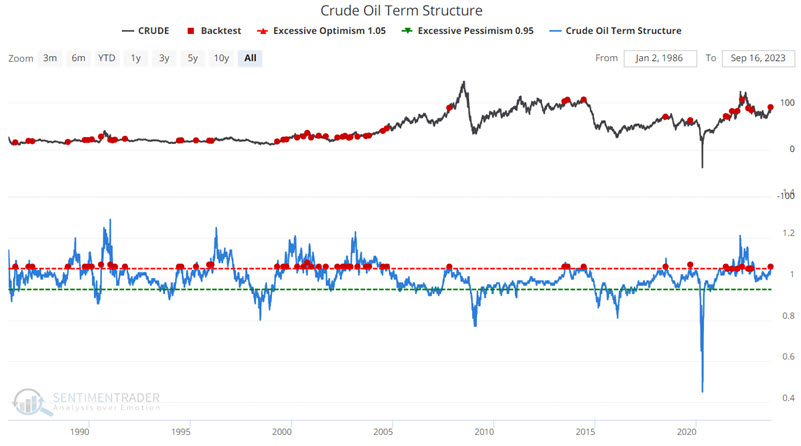
The term structure of crude oil futures shows the relationship of the near-term futures contract to a further-out contract. If it is above 1.0, the near-term contract is priced higher than the further-out contract, called backwardation. Spikes in this measure can flag impending market weakness. If below 1.0, then the market is in contango. When it goes into severe contango, that is a sign of stress in the market and has typically only occurred when crude oil is forming a long-term bottom.
The chart below displays all dates when the Crude Oil Term Structure crossed above 1.05 for the first time in 21 trading days. The most recent signal occurred on 2023-09-15.
The table below summarizes crude oil futures performance following the dates highlighted in the chart above.
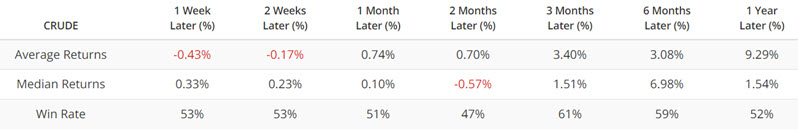
The results are essentially not all that meaningful, with Win Rates mostly in "coinflip" territory and with lackluster Average and Median Returns. So, it might make sense to dismiss the cross above 1.05 on 2023-09-15 as not meaningful. But there is another possible take - depending on one's perspective.
Focusing on the last 15 years
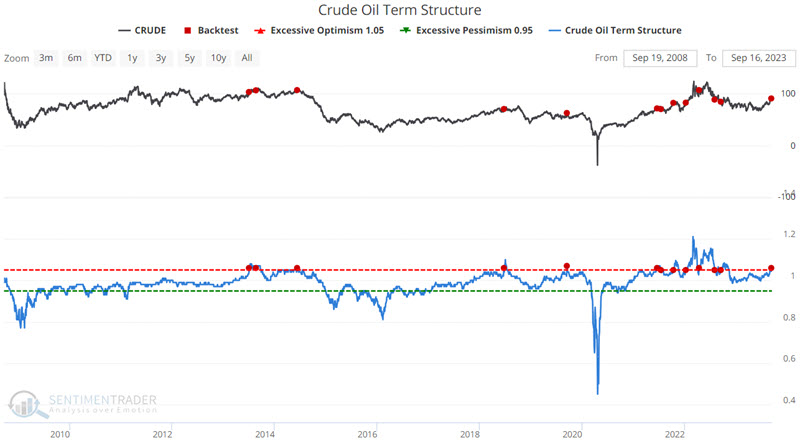
Instead of looking at the entire history of crude oil futures trading, we will focus only on the last 15 years. The reality is that some readers will consider this relevant, and others will dismiss it as curve fitting or recency bias. There is no correct answer, and it is one you will have to decide for yourself.
The chart and table below display crude oil performance only during the last 15 years when the Crude Oil Term Structure crossed above 1.05 for the first time in 21 trading days.
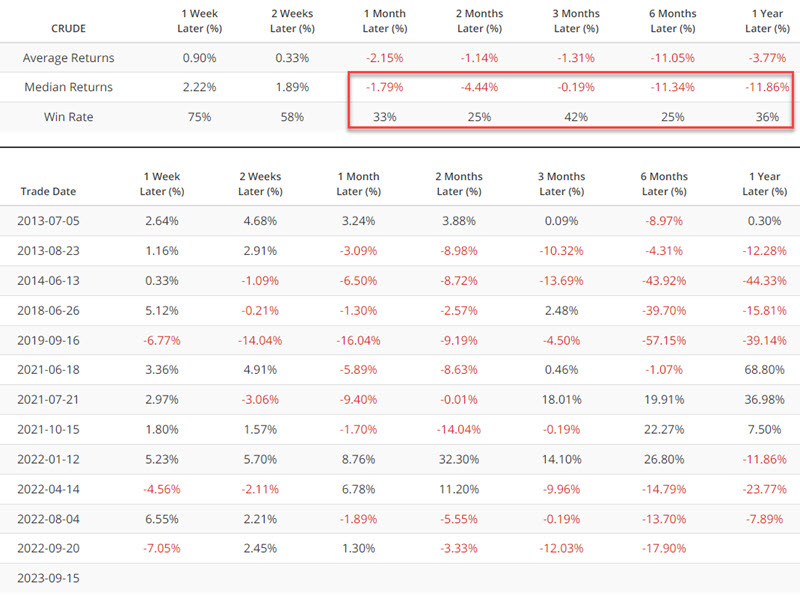
As you can see above, with the notable exception of signals generated in 2021 (which did still experience some significant weakness in the first two months after a signal), the overall results have been very subpar. Six-month returns showed a gain only 25% of the time, with a median decline in double digits.
So, what to make of the 2023-09-15 signal? The best guess from this perspective is "hope for the best, but prepare for the worst." The current narrative seems to be that crude oil is headed higher. That remains a distinct possibility, and traders are not encouraged to use the recent indicator signal as an automatic "sell short" signal. It would probably best be considered a "be prepared to sell short if the current rally fizzles" alert.
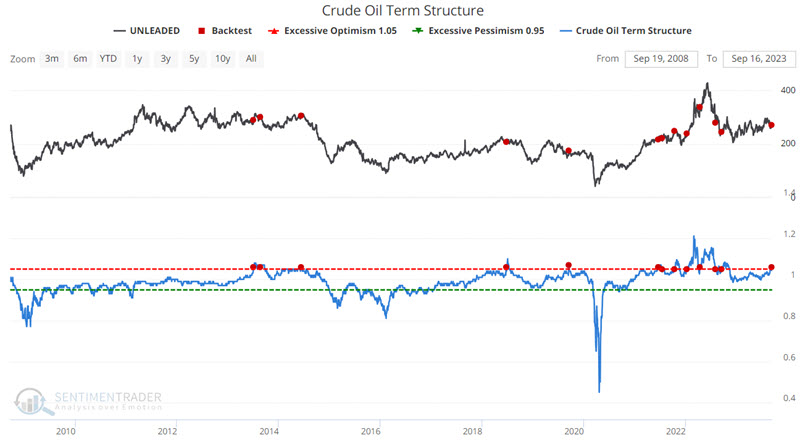
A look at Unleaded Gas
To get a broader picture of the energy sector, the chart and table below display unleaded gasoline futures performance only during the last 15 years when the Crude Oil Term Structure crossed above 1.05 for the first time in 21 trading days.
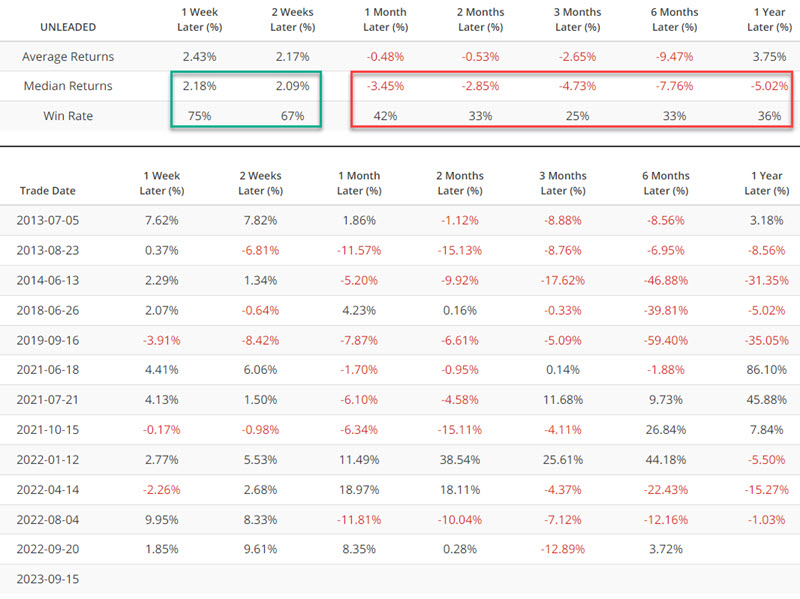
Early strength in the first two weeks after a signal often led to significantly poorer performance. Waiting for some sign of an actual reversal is likely a better course of action than selling short into a sharply rising market.
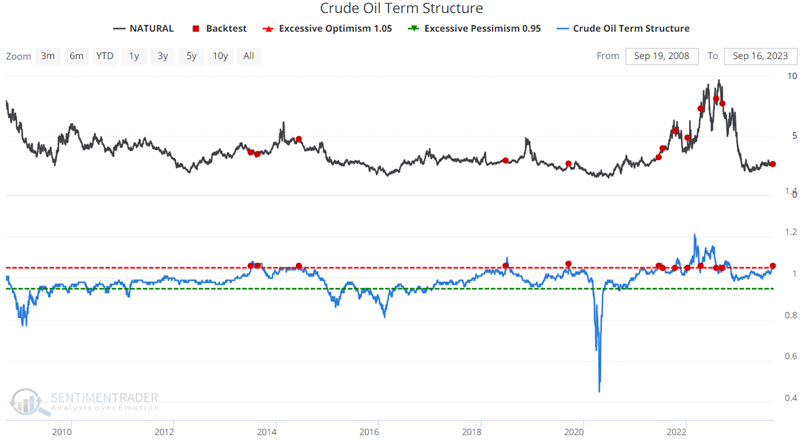
A look at Natural Gas
Natural gas generally fits the same profile as crude and unleaded. To get a broader picture of the energy sector, the chart and table below display natural gas futures performance only during the last 15 years when the Crude Oil Term Structure crossed above 1.05 for the first time in 21 trading days.
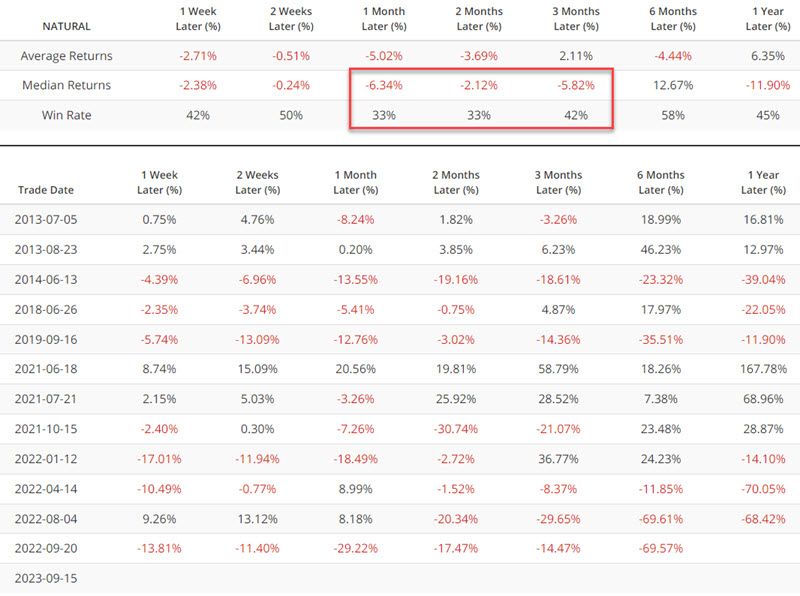
Some solid gains followed the 2013 and 2021 signals. So, once again, the actual timing of entry into a short position is a key - and separate - issue. Nevertheless, despite these periods of solid gains, overall, results have been decidedly bearish for natural gas during the last 15 years.
Seasonality is one other reason to pay close attention
Jason recently covered several other reasons to watch for signs of a potential reversal in the energy sector here and here. One of the key reasons to be wary of a possible reversal is seasonality in some of the energy products. The charts below display the annual seasonal trends for the four major energy futures markets - crude oil, unleaded gas, heating oil, and natural gas.
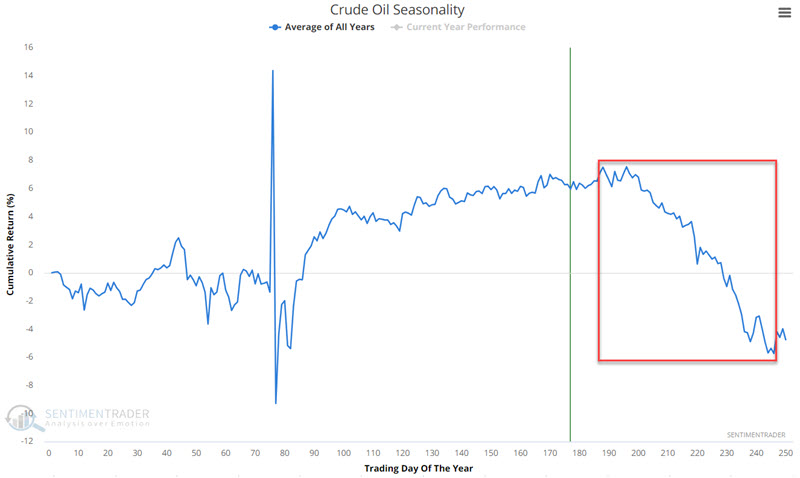
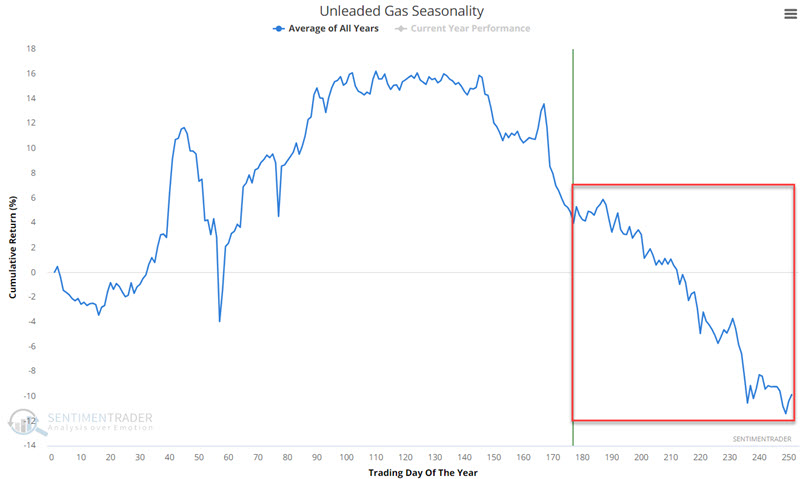

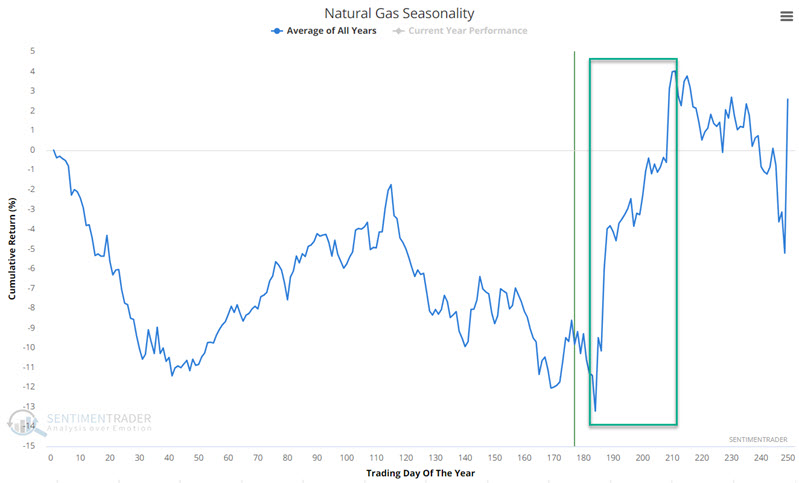
Natural gas is the one "exception to the rule" regarding late-year seasonality. The other three show a strong tendency to decline late in the year. However, as always, seasonality is "climate, not weather." These markets can completely ignore seasonality in any given year and continue to power ahead if the fundamentals align.
Everything in this piece amounts to "reasons to watch closely for signs of a reversal" and NOT "reasons to sell short immediately."
What the research tells us…
Besides natural gas, the energy markets have rallied sharply since bottoming in early May 2023. Attempting to "pick a top" and sell short into this type of strength is fraught with financial peril. That said, potential warning signs of a possible reversal are beginning to gather and should not be dismissed out of hand. This suggests that traders pay close attention to these markets in the weeks ahead and watch for signs of a turnaround.
Repeating, everything in this piece amounts to "reasons to watch closely for signs of a reversal" and NOT "reasons to sell short immediately."