
Crude oil reverses to a multi-month high

Key points:
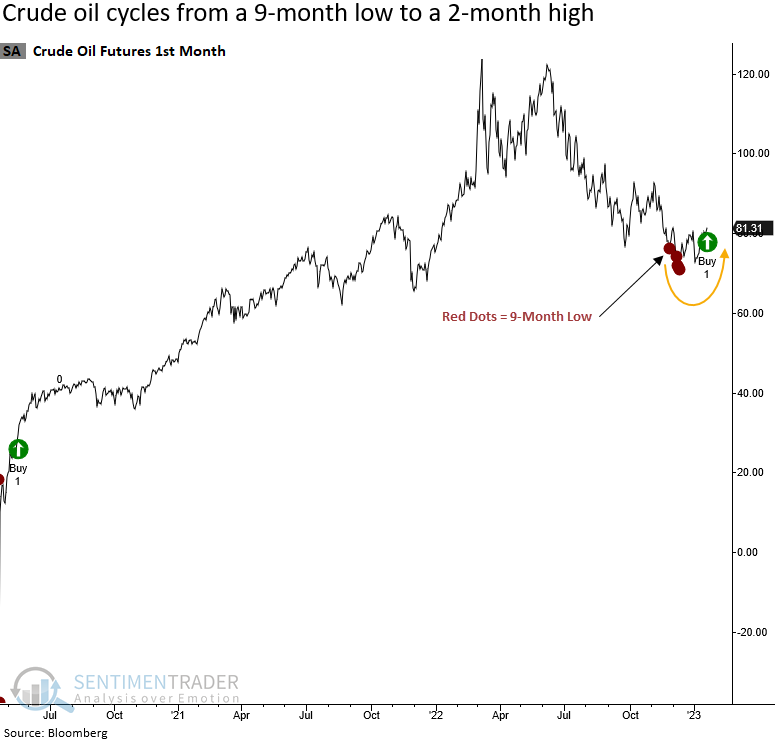
- Crude oil cycled from a 9-month low to a 2-month high
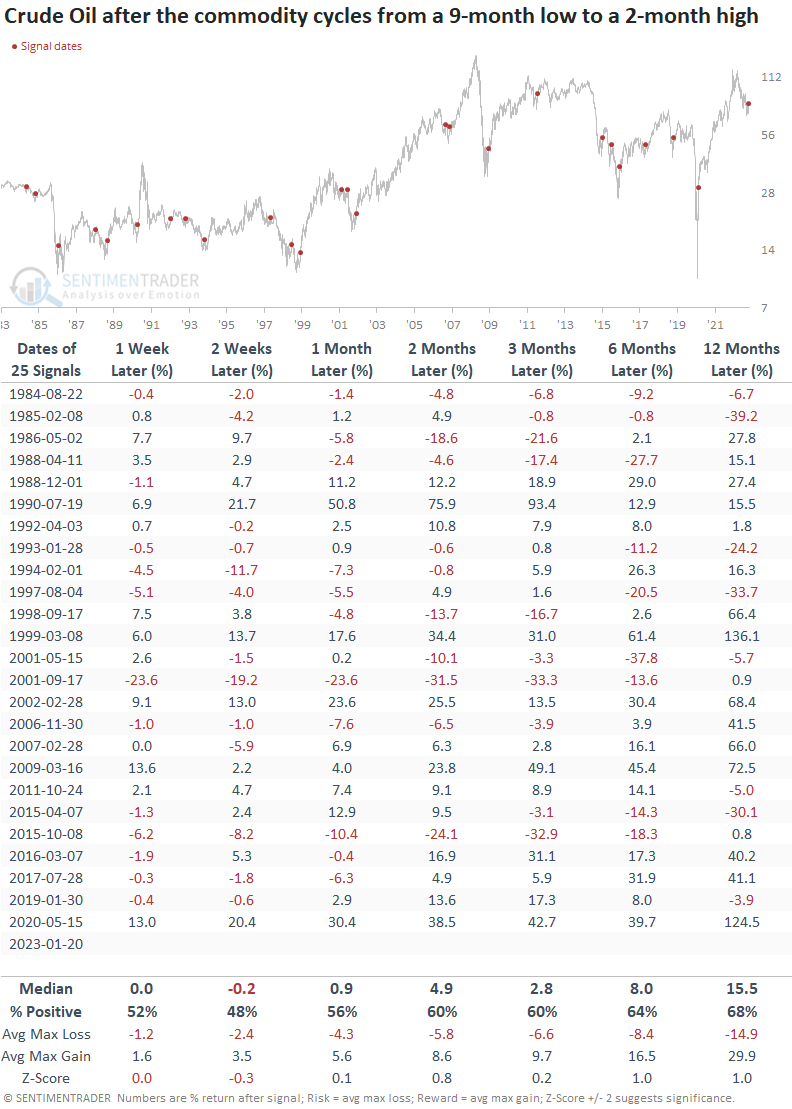
- After similar reversals, oil paused and then rallied over longer time frames
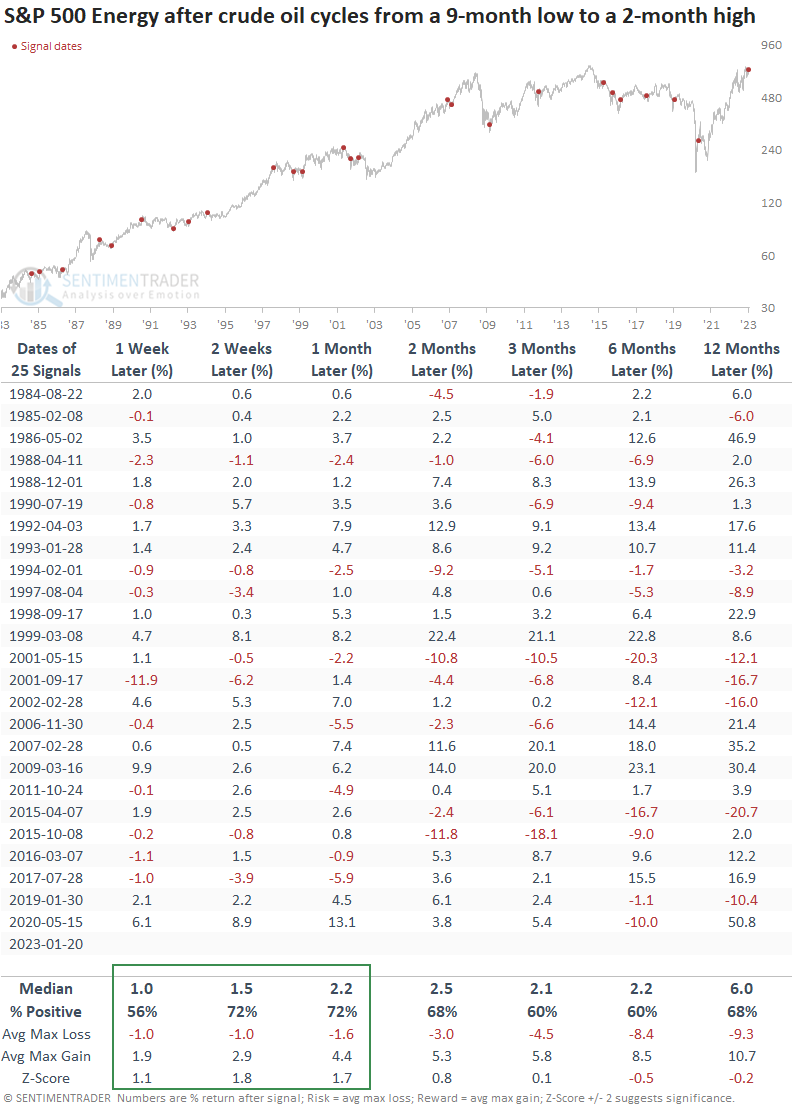
- Energy stocks tended to rally in the near term, but the momentum subsided over longer horizons
Does the reversal in crude oil foreshadow a resumption of a secular uptrend
While secular bull markets in crude oil are rare, one could argue that oil has been in a secular uptrend since 2020, and the -42% slide since March 2022 is a cyclical bear within a secular bull.
A similar precedent would be from 1998 to 2008 when oil experienced two significant drawdowns within a secular bull. And one of those cases occurred within the context of a recession.
Last week, crude oil closed at a new 2-month high. The new high represents the first instance after a 9-month low.
Let's assess the outlook for crude oil and energy stocks under similar conditions.
Similar reversals in crude oil foreshadowed an upward bias in the commodity
When crude oil cycles from a 9-month low to a 2-month high, oil tends to consolidate in the first few weeks. However, the signal shows a gain at some point in the first two months in 21 out of 25 cases. While the long-term results look constructive, some of the drawdowns are concerning.
Interestingly, the energy sector likes the reversal in crude oil in the first few weeks, which is the opposite of the oil outlook. The signal shows a positive return at some point in the first month in 22 out of 25 cases. Unfortunately, the long-term results for energy stocks are somewhat disappointing.
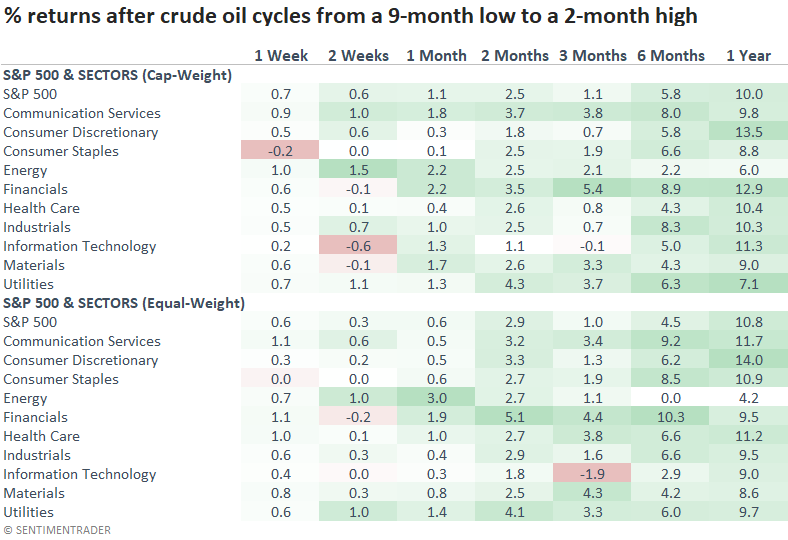
From a sector perspective, the reversal in oil favors value-oriented groups in the near term. And the equal-weighted energy sector outperforms the cap-weighted version in the first few months.
What the research tells us...
Crude oil cycled from a 9-month low to a 2-month high. After similar signals, the commodity consolidated the recent gains before moving higher over the next six to twelve months. While energy stocks like higher crude prices, performance was front-loaded in the first few months. From an allocation perspective, one would be better off with an equal-weighted ETF like RYE versus XLE.