
Crude oil experienced an almost unprecedented drop over the past ten sessions

Key points:
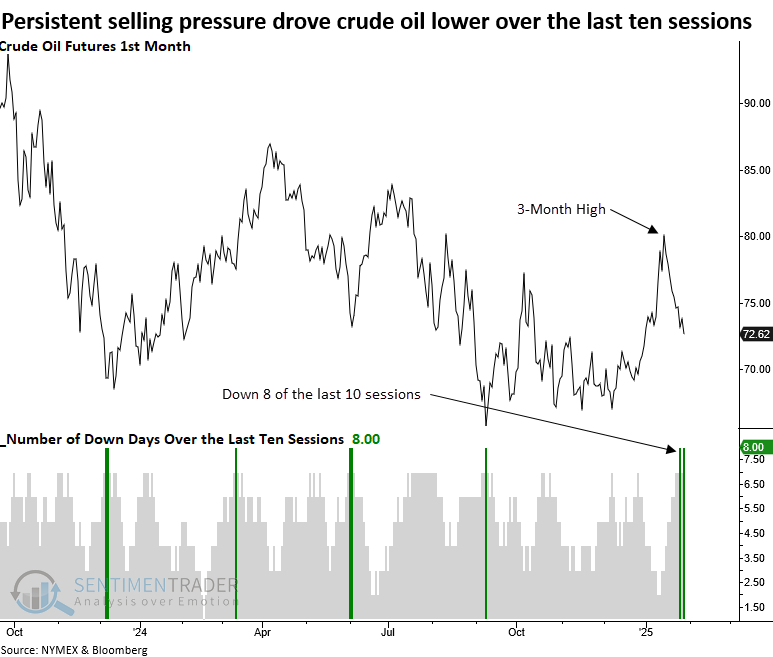
- Crude oil futures declined in 8 of the last 10 sessions from a 3-month high
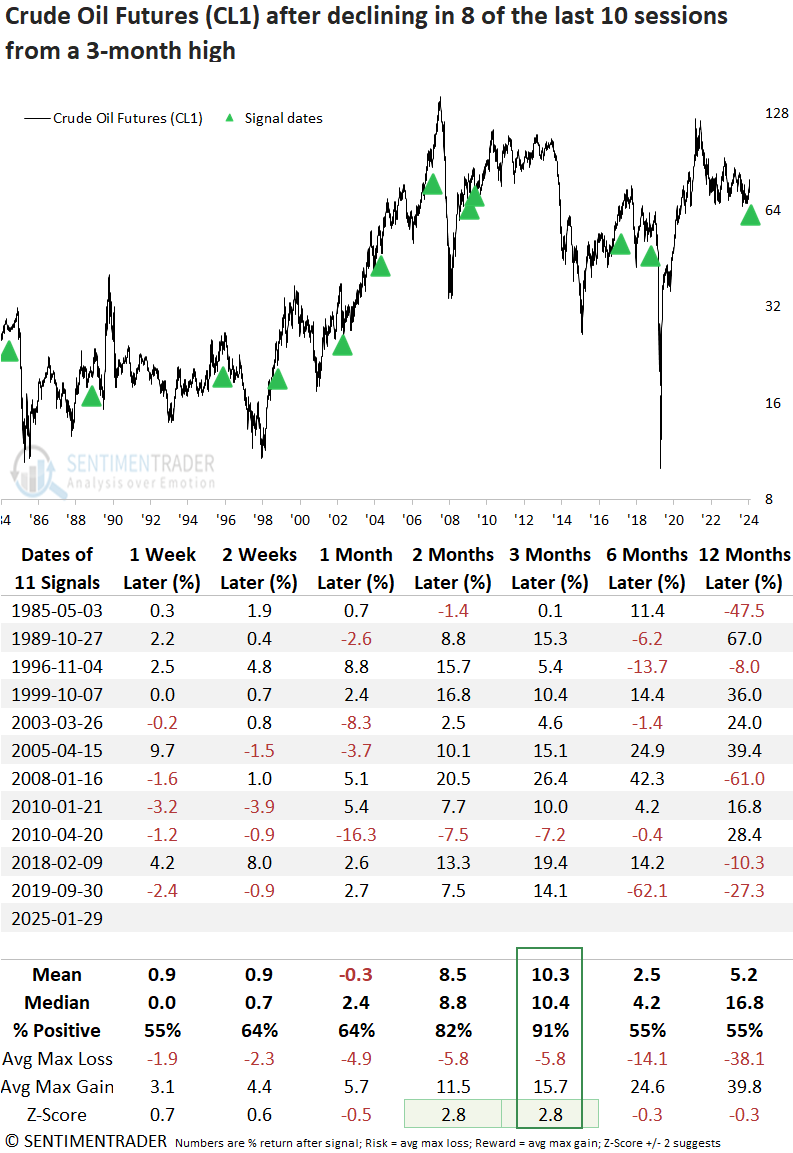
- Similar precedents saw the commodity rally 91% of the time over the subsequent three months
Crude oil may gain an extra boost as a favorable seasonal shift is about to begin
A sharp drop from a recent high indicates crude oil could be poised for a rebound
Since reaching its peak on January 15th, crude oil has plunged, declining in 8 of the last 10 sessions- a price pattern observed 103 times since daily price data began in 1983. What sets this instance apart is that the persistent decline started from a high, a rarity seen just 11 other times in history.
Whether this sharp decline was a response to President Trump's "drill, drill, drill" comments or influenced by other factors, markets-especially highly volatile ones like crude oil-rarely move in a straight line.
What could challenge the bearish narrative surrounding a pro-drilling administration? You got it-a countertrend rally. Don't rule it out.
Comparable declines from a high preceded a multi-month bounce
While rare, when crude oil declined in 8 of the last 10 sessions after hitting a three-month high, it rebounded 91% of the time over the following three months. However, recent cases indicate a recovery may take a few weeks.
Should a bounce develop over the next few months, I would be careful thereafter as consistency and returns drop off considerably at the six-month mark, indicating this is a rent for a trade scenario in crude oil.
Food for thought: Similar occurrences were observed in 2018 and 2019, coinciding with Trump's first presidency.
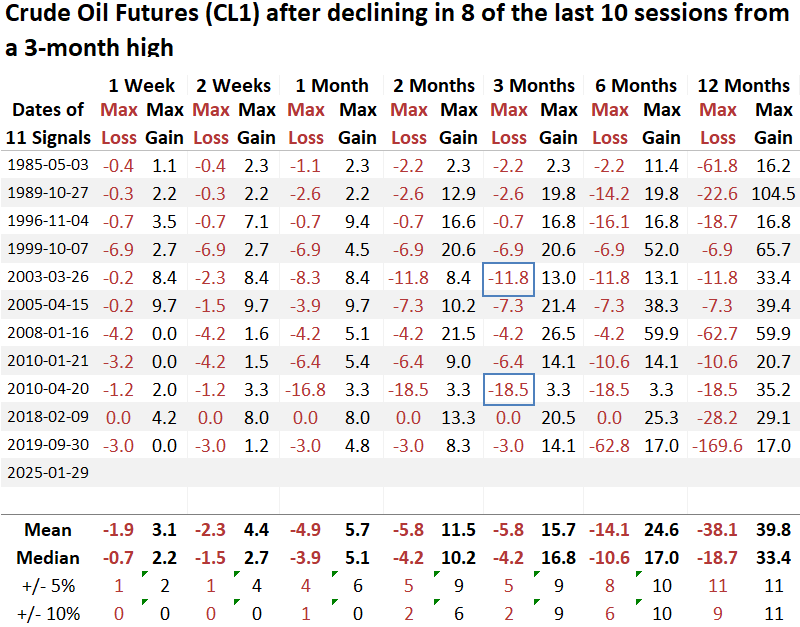
Over the first three months, five of the eleven precedents faced a maximum loss of more than 5%, while just two saw a decline surpassing 10%.
Just a reminder: Front-month crude oil futures traded below zero in 2020, which explains why the maximum loss for the 2019 signal is -169%.
Seasonality
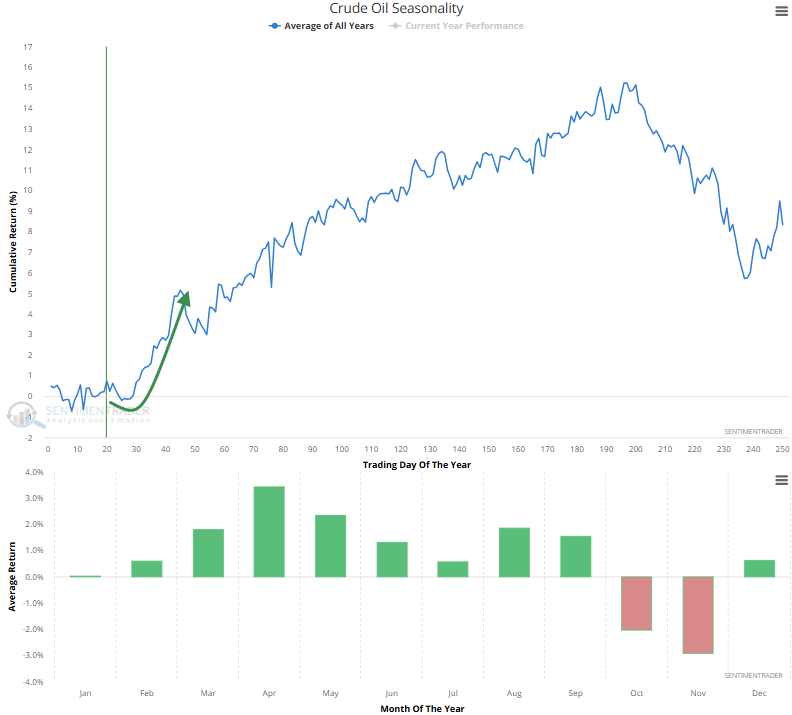
Crude oil is entering a seasonally strong period, with February, March, and April posting gains at least 60% of the time since 1984. February, in particular, has been even more reliable lately, advancing in 70% of the cases in the last 25 years, suggesting a more pronounced seasonal effect.
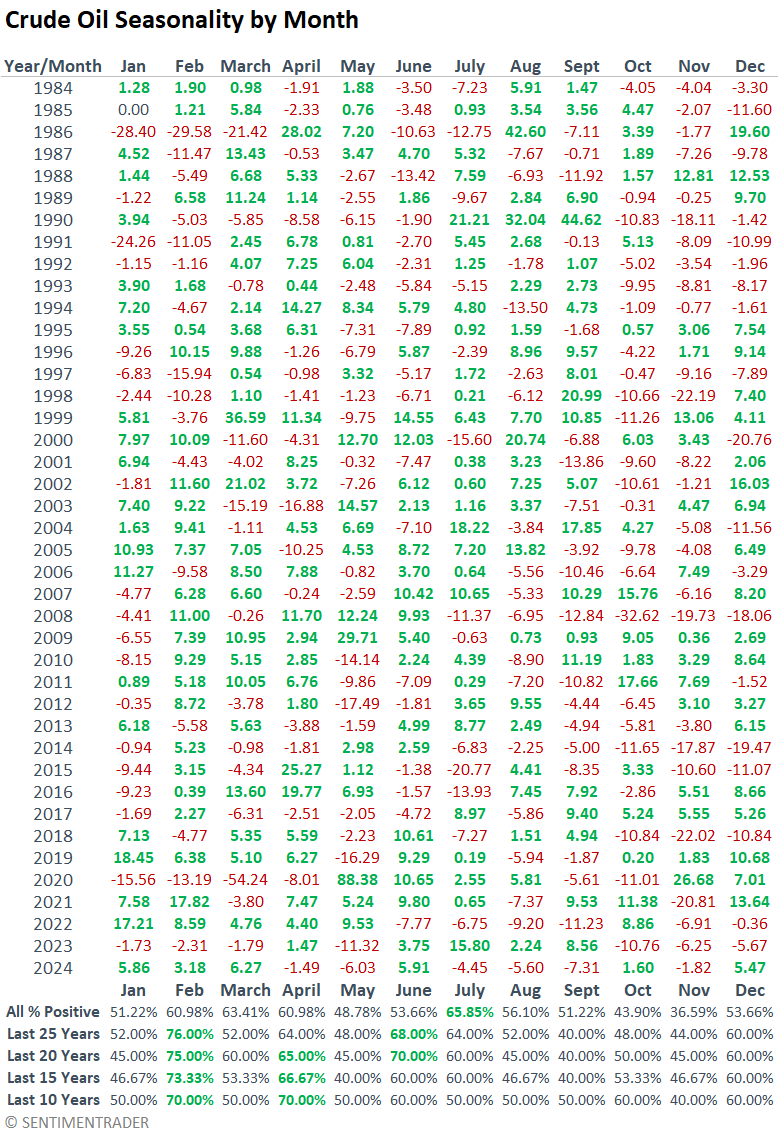
The seasonality chart from our website highlights that crude oil typically trades within a range for the first five weeks of the year, followed by a strong upward trend.
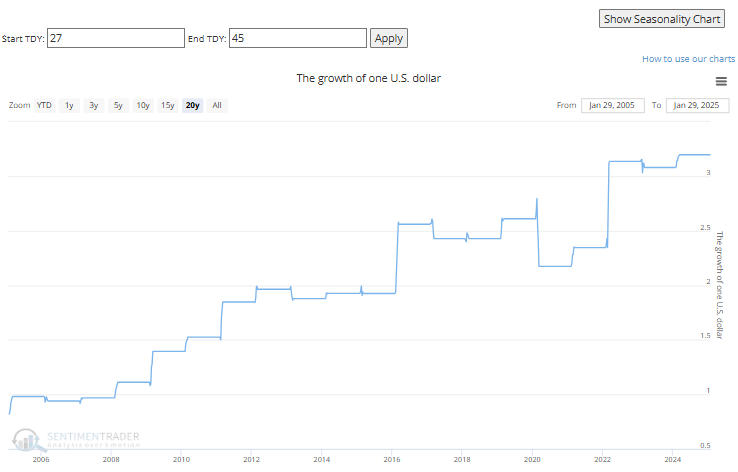
The most favorable trading window for crude oil during the bullish February to April seasonal window typically occurs between Trading Day (TDY) 27 and TDY 45. A trader who bought and sold during this timeframe would have tripled their initial investment, turning $1 into $3 - an impressive return considering the brief duration and the commodity's inherent volatility.
What about energy stocks?
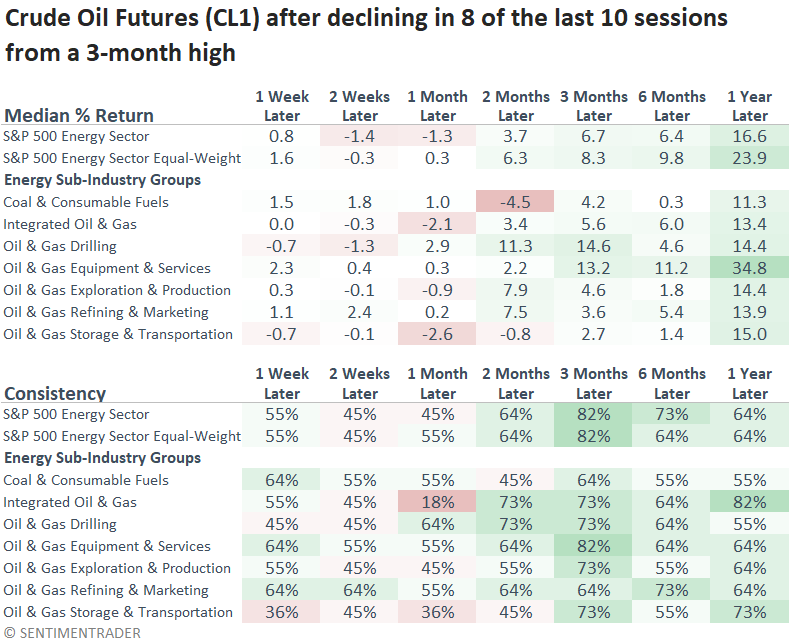
The energy sector and its associated sub-industry groups follow a similar pattern to crude oil, which is a somewhat tepid first month or so. However, like oil, they turn up after a few months and kick into gear at the three-month horizon. Interestingly, the one-year timeframe is solid.
What the research tells us...
Crude oil has experienced a swift downturn, dropping in 8 out of the last 10 trading sessions from a 3-month high. This pattern of intense selling has historically been a precursor to a potential rebound in the commodity over the subsequent three months. However, it may take a few weeks to find a bottom. Adding credence to the case for a bounce is a positive seasonal window. Trading crude oil futures is a high-stakes endeavor that demands exceptional risk management skills. A less risky trade would be ETFs like the symbol XOP, which shows the highest correlation to oil among several energy stock ETFs. Like oil, the path to higher prices could be volatile in the near term. Always ensure you have a clear trading plan and follow it.