Crude oil and unleaded gas will offer clues on inflation
Key Points:
- Several indicators are presently bearish for crude oil and unleaded gas
- Seasonality is bearish for both markets
- If they do not break down soon, it suggests inflation is going to be more of a problem than people expect
An unfavorable seasonal period
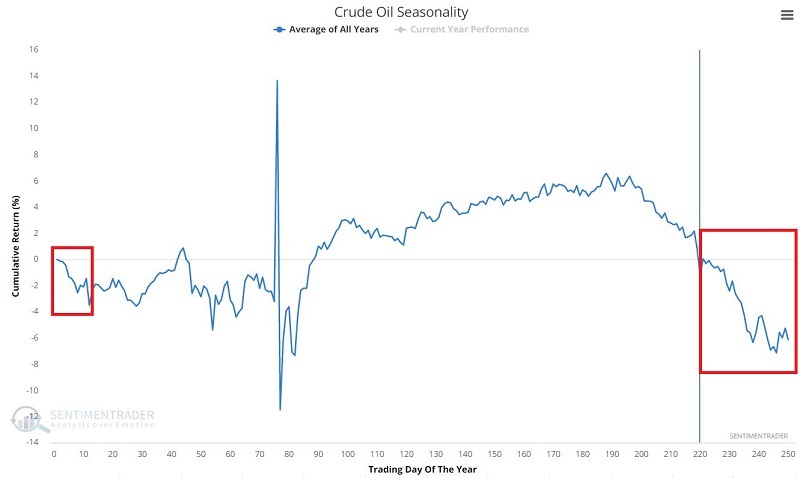
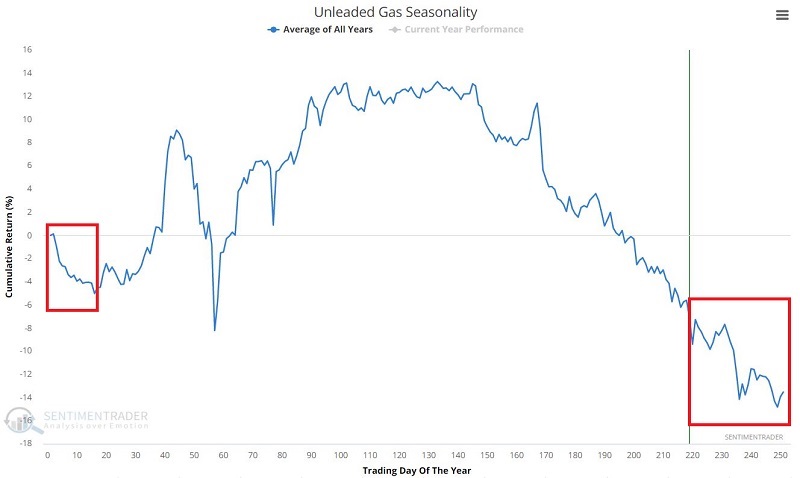
Seasonal trends for a couple of major energy contracts have been negative for a while, and that continues into January. The charts below show the Annual Seasonal Trend for both crude oil and unleaded gas. Clearly, the tendency is for lower prices into the early part of the next year.
So far, crude and unleaded have ignored seasonality and advanced. Whenever a market doesn't do what it should, we need to pay attention as it suggests more important structural forces are at play.
Crude oil Optix has flashed several warnings in vain
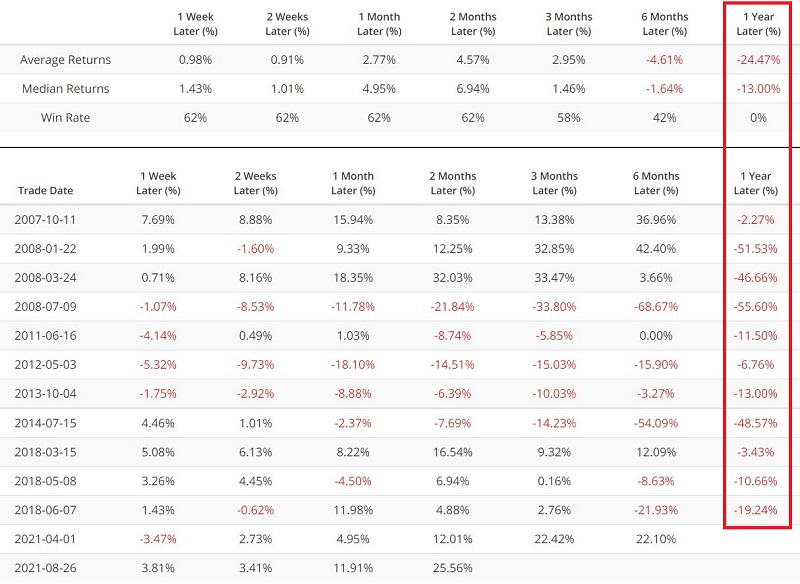
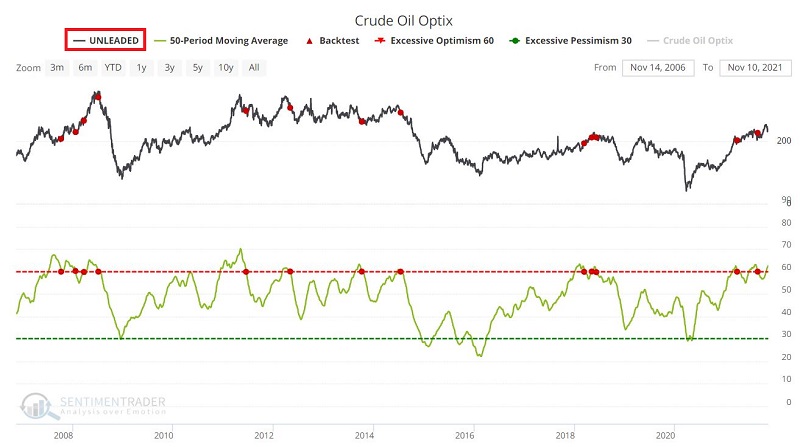
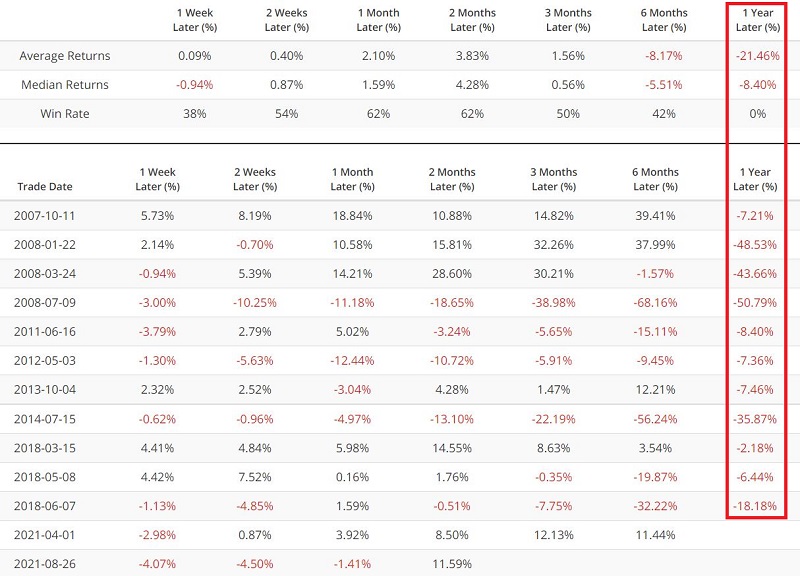
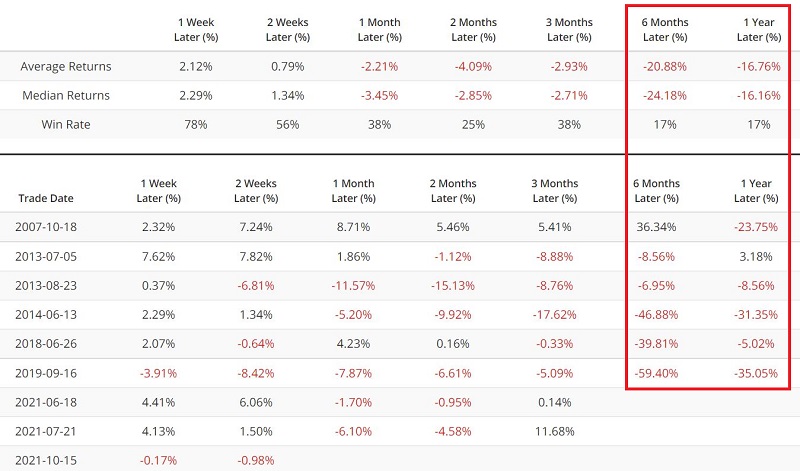
The chart and table below display the performance for crude oil in the last 15 years when the 50-day moving average for crude oil Optix has dropped below 60 for the first time in 21 days. You can run this test by clicking here.
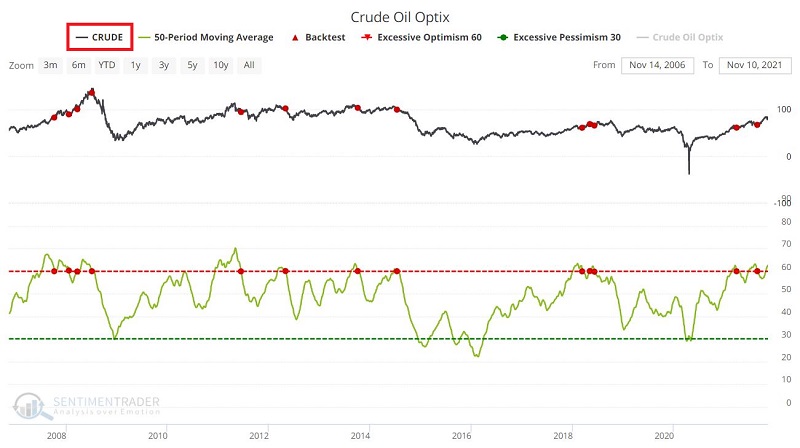
In the past 15 years - which has seen tame inflation - crude oil was lower 12 months later each time. But since it was triggered in August, the contract is up more than 25%. A similar thing happened after the March 2008 signal, and that one ended up showing a massive loss over the next 9 months.
If we run the same test on Unleaded Gas, the results are similar.
According to this indicator, these energy products should be headed lower in the months ahead. However, if they do not, the suggestion is that inflationary fears impact energy prices more than in previous years.
Crude Oil Term Structure is also flashing a warning sign
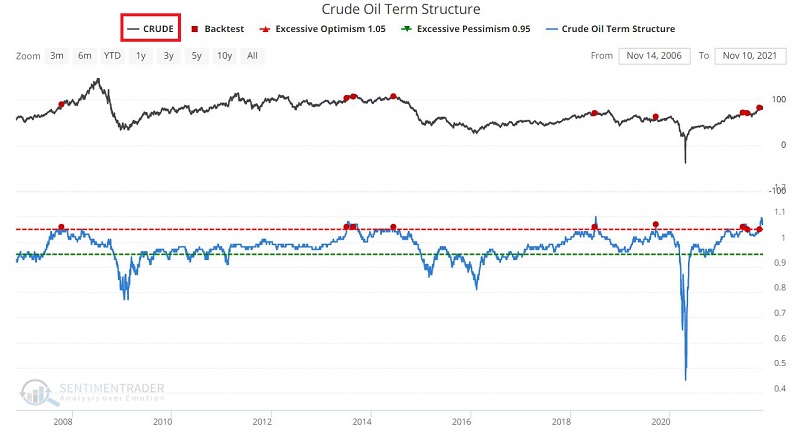
The term structure of crude oil futures shows the relationship of the near-term futures contract to a further-out contract. If it is above 1.0, the near-term contract is priced higher than the further-out contract, called backwardation.
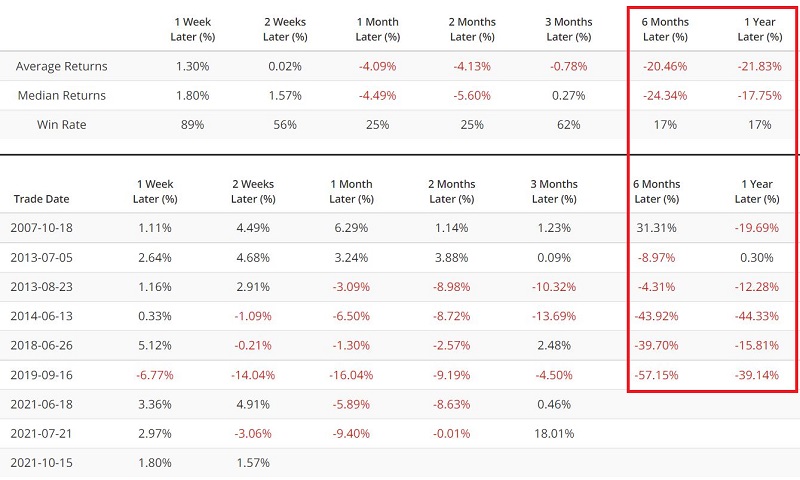
The chart and table below display the performance for crude oil in the last 15 years when crude oil term structure crossed above 1.05 for the first time in 21 days. You can run this test by clicking here.
In the past 15 years - which has seen tame inflation - crude oil was lower 12 months later each time.
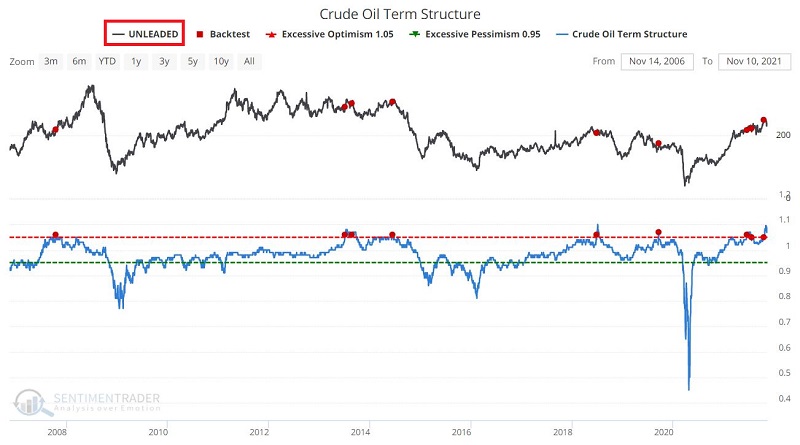
If we run the same test on Unleaded Gas, the results are similar.
This indicator also suggests that these energy products should be headed lower in the months ahead.
What the research tells us…
According to various generally reliable indicators, crude oil and unleaded gas should experience weakness in the months ahead. As a result, contrarian traders might look for opportunities to play the short side with a solid risk-management plan in place since these would be counter-trend trades.
However, inflation is much more of an issue than it has been in the past 15 years. As a result, non-energy traders might be wise to monitor these markets in the months ahead. If the energy contracts continue to rally and make further new highs, it would be a sign that inflation is a much more significant - and likely more persistent - problem currently believed.


