
Credit spreads moving back to the favorable side of the ledger - Part III

Key points
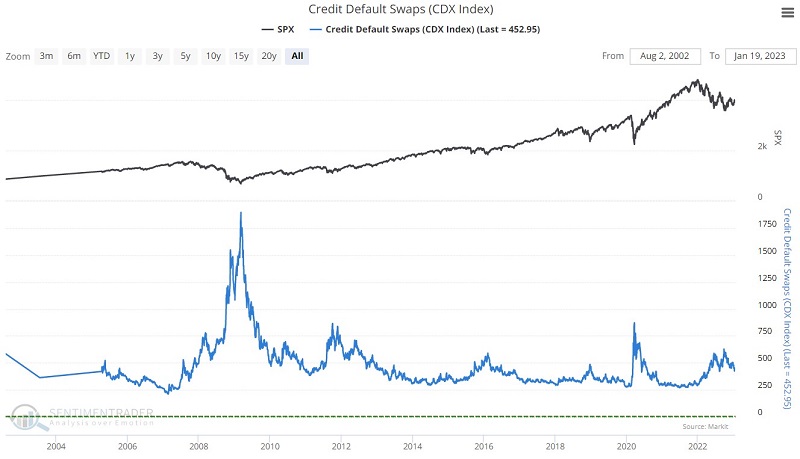
- The CDX Index tracks the trend of pricing for credit default swaps
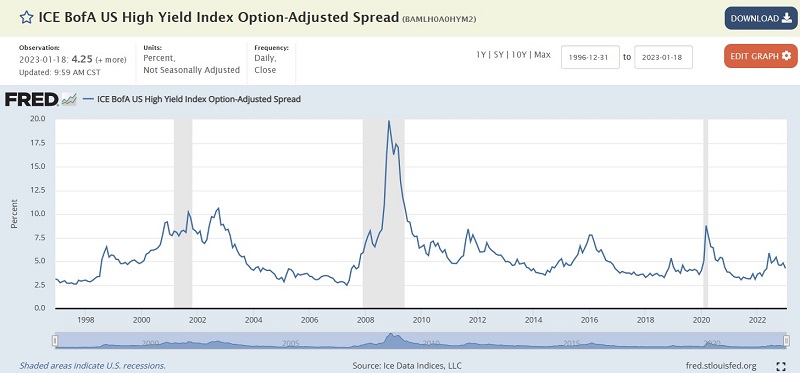
- The ICE BofA US High Yield Index Option-Adjusted Spread compares the yield on an index of below investment-grade bonds (those rated BB or below) and treasury securities
- When both of these indicators are favorable - or both unfavorable - it tends to have a significant influence on stock prices
The credit spread indicators revisited
The CDX Index on our website tracks the pricing trend for credit default swaps. As detailed in this article, when the trend is down, it tends to be bullish for stock prices and vice versa.
The ICE BofA US High Yield Index tracks the performance of below-investment-grade corporate debt relative to treasury securities. Likewise, when the trend is down, it tends to be bullish for stocks and vice versa.
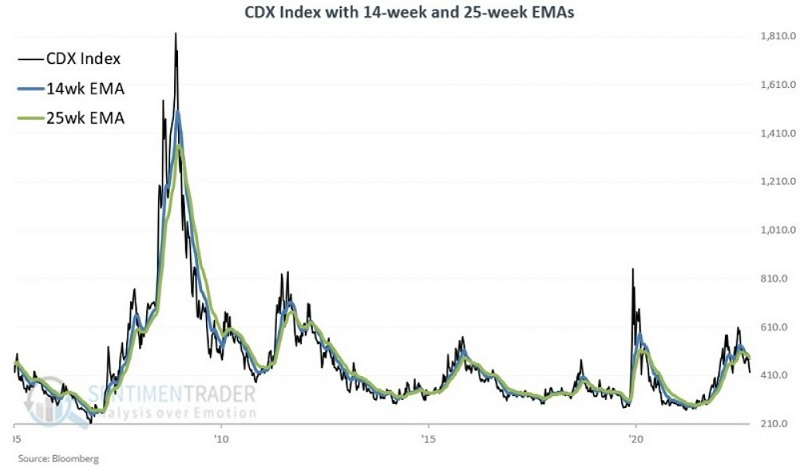
The CDX Index:
- is deemed favorable when the 14-week EMA is < the 25-week EMA
- is deemed unfavorable when the 14-week EMA is > the 25-week EMA
The ICE BofA US High Yield Index:
- is deemed unfavorable when the 13-week EMA > 28-week EMA AND the 2-week change in the 13-week minus 28-week EMA is greater than 0
- otherwise, this indicator is considered favorable

When both indicators are favorable
The chart below displays the growth of $1 invested in the S&P 500 Index only when both credit spread indicators above are rated as favorable.
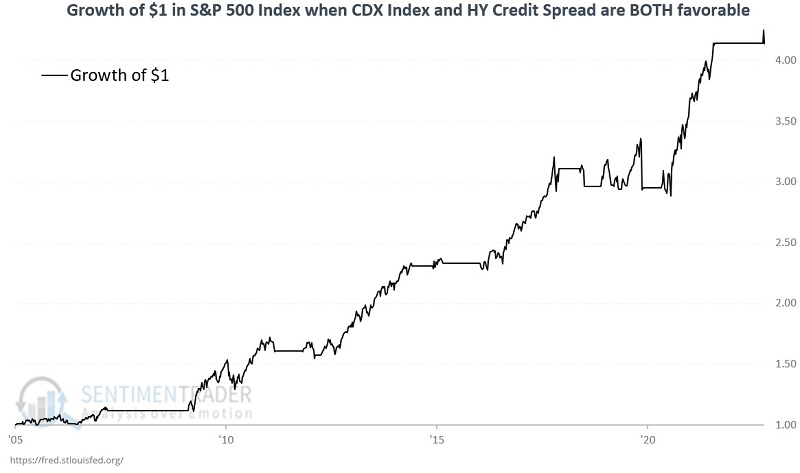
From 2005-04-15 through 2023-01-18, the cumulative gain was +314%, with a maximum drawdown of -16%.
When both indicators are unfavorable
The chart below displays the growth of $1 invested in the S&P 500 Index only when both credit spread indicators above are unfavorable.
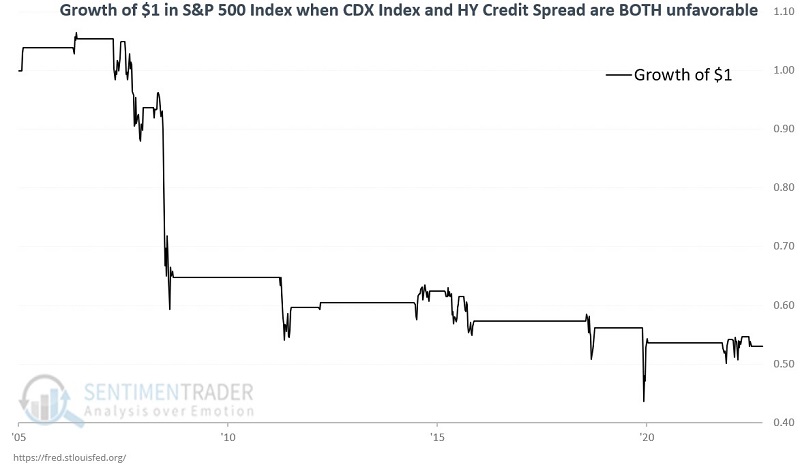
From 2005-04-15 through 2023-01-18, the cumulative loss was -46.9%.
What the research tells us…
When both of the indicators detailed above and in Parts 1 and 2, stock market performance has typically been consistently favorable. However, widening credit spreads can be an effective warning sign of impending economic trouble. When both indicators are deemed unfavorable, the stock market has rarely made any decent headway and has often declined precipitously. In early 2023 both indicators once again returned to the favorable side of the ledger. As long as this configuration persists, history suggests that investors give the bullish case the benefit of the doubt.