
Credit spreads flash a warning sign

Key Points
- Widening credit spreads often signal trouble ahead for stocks and the economy
- A simple model that analyzes one measure for credit spreads has just entered "fully unfavorable" territory
- Below, we look at what happened to the stock market during previous instances
The ICE BofA US High Yield Index Option-Adjusted Spread
The ICE BofA US High Yield Index tracks the performance of the US dollar-denominated below investment grade rated corporate debt publicly issued in the US domestic market. The index represents the calculated spread between a computed option-adjusted spread ("OAS") index of all bonds in the ICE BofA US High Yield Index and a spot Treasury curve.
This spread tends to fluctuate very narrowly in periods of normal economic activity. However, during periods of economic stress or unusual financial market conditions, this spread can grow rapidly. Because the stock market hates uncertainty, rapid growth in this spread is often a warning sign for stock market investors. Objectively identifying a period of "rapid growth" can be problematic, but we will highlight one potential approach.
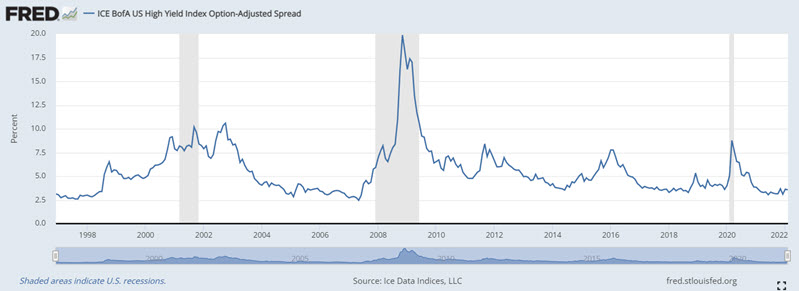
In the chart above, the grey periods represent US economic recessions. A widening of this spread almost invariably precedes recessions - however, not every increase in this spread is followed by a recession.
The Test
The data for this index can be retrieved here. We will use week-ending data for this index and the S&P 500 Index. Our calculations are as follows:
A = week-ending value for The ICE BofA US High Yield Index
B = 13-week exponential average of A
C = 28-week exponential average of A
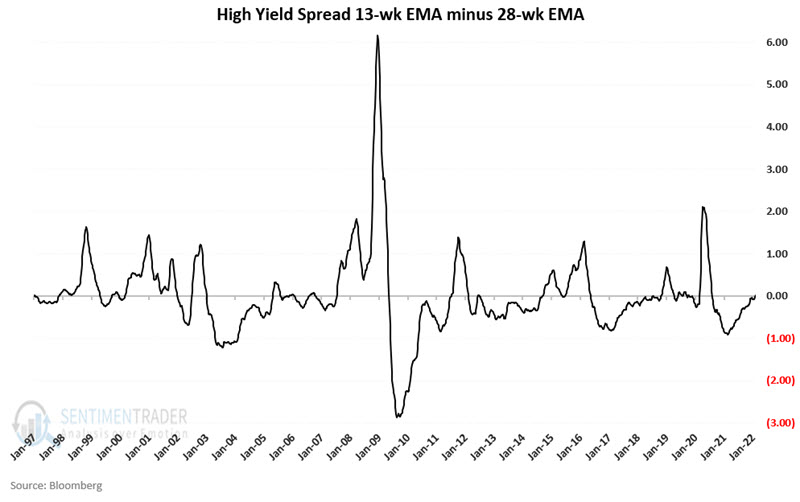
D = (B - C)
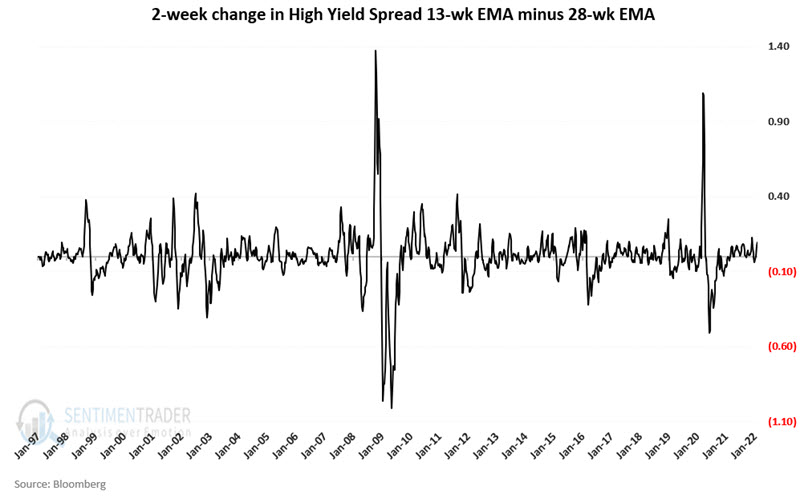
E = Current value for D - value for D two weeks ago
In plain English, we calculate a 13-week and 28-week exponential average and take the difference between the two. A positive reading means the spread (Variable D) is widening, and a negative reading means the spread is narrowing. Additionally, we see if Variable D rose or fell over the last two weeks.
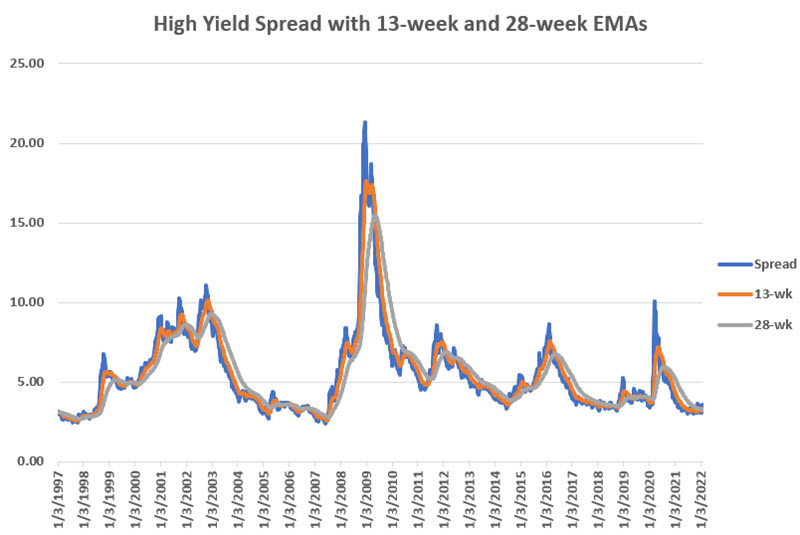
The chart below displays the yield spread along with the 13-week and 28-week exponential averages.
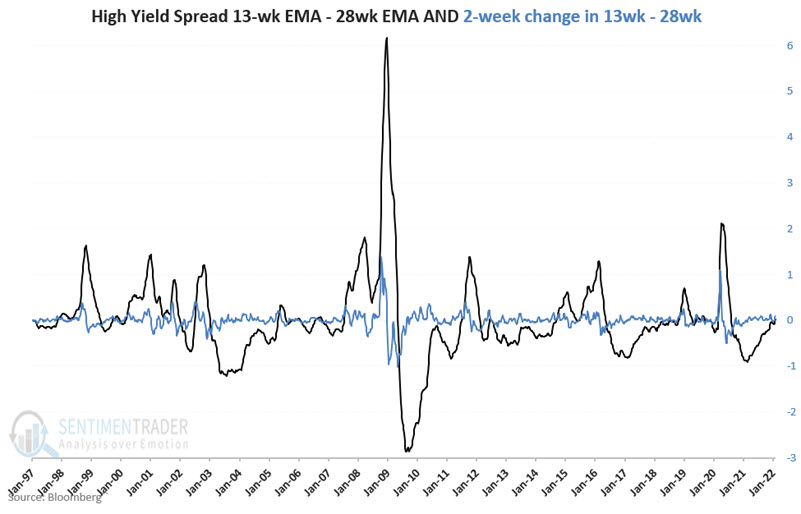
The chart below displays the difference between the 13-week and 28-week average (Value D). Note that readings above 0 are a warning sign of potentially unfavorable conditions for stocks and the overall economy.
The chart below displays the two-week change in Value D. Once again, readings above 0 are a warning sign of potentially unfavorable conditions for stocks and the overall economy.
Finally, the chart below combines the previous two charts.
What really matters
This method issues a warning sign for stocks and the overall economy when Variable D and Variable E (the two lines in the chart above) are both above zero. This tells us that a) the credit spread itself is widening, and b) the velocity of the increase is increasing.
The results
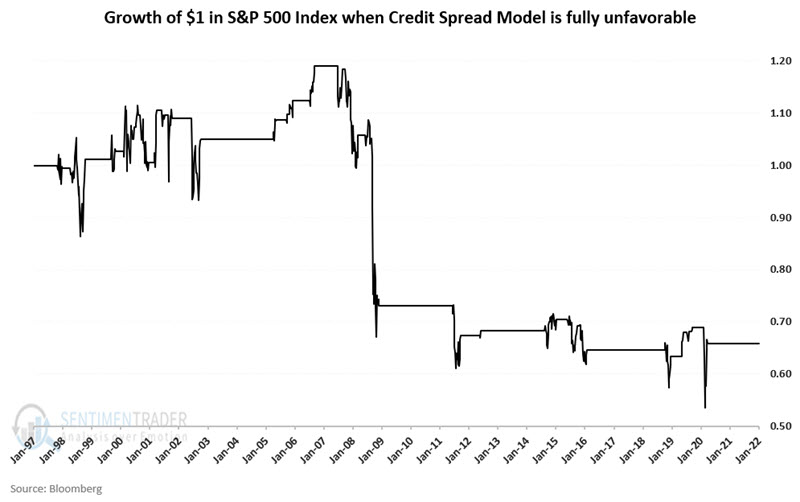
The chart below displays the hypothetical growth of $1 invested in the S&P 500 Index ONLY when both Variable D and Variable E are positive at the same time. As you can see, the stock market can rise under these circumstances, but there is clearly a tendency for trouble. Hence the reason this is considered to be a warning sign.
The chart below displays the hypothetical growth of $1 invested in the S&P 500 Index ONLY when EITHER Variable D or Variable E is negative.
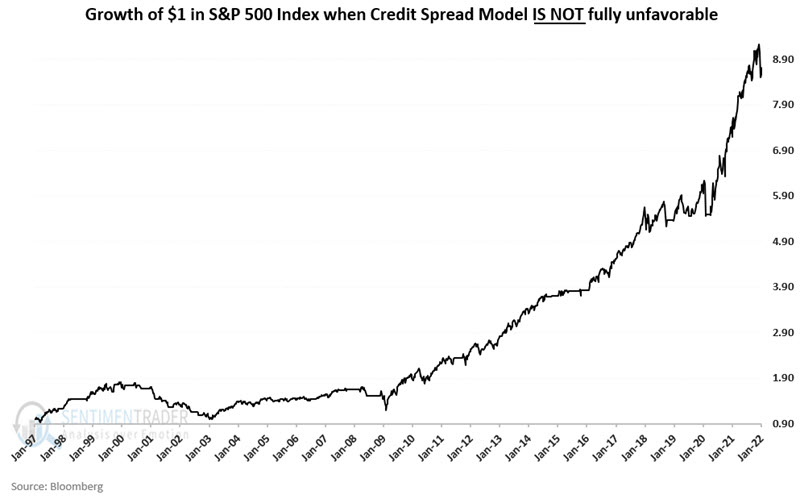
From 1/31/1997 through 2/4/2022, the S&P 500 Index lost -34%, while this model was fully unfavorable and gained +770% the rest of the time.
What the research tells us…
Widening credit spreads can be a helpful warning sign of impending economic trouble. But not every uptick is a signal of impending doom. The key is to identify those times when the spread is widening AND doing so at an accelerating rate. As of the week ending 2/4/2022, the 13-week exponential average for the High Yield credit spread detailed above crossed above its 28-week exponential average. In addition, the two-week change in the 13-week EMA minus 28-week EMA is rising. As a result, the credit spread model detailed above is presently considered "fully unfavorable."
So, does this mean that an economic recession and/or a stock bear market is inevitable? Not at all. But it does count as an important entry on the negative side of the ledger. And the longer this condition persists, the greater the danger.