Credit spreads are now unfavorable for stocks

Key points
- The stock market hates uncertainty
- Credit spreads serve as a "fear gauge" in the credit markets - narrow/falling spreads suggest calm, rising spreads suggest concerns
- My Credit Spreads Combined Model recently fell into unfavorable status - suggesting limited upside for stocks while this status remains
- Also, note the update to a previous article relating to unemployment at the end of this note
Indicator #1: ICE BofA US High Yield Index Option-Adjusted Spread
The ICE BofA US High Yield Index Option-Adjusted Spread (HYCS) measures the spreads between a computed of all bonds in a calculated index of below investment grade bonds and a spot Treasury curve.
We rate the spread as favorable when it is in a downtrend and unfavorable when it is in an uptrend. We designate its trend as follows:
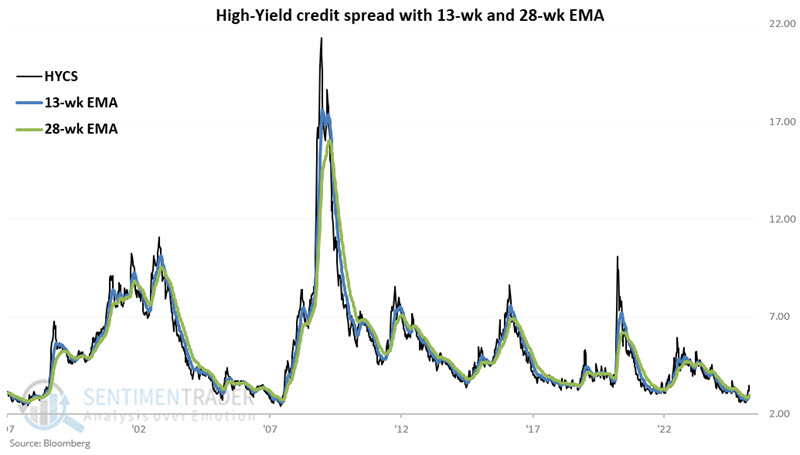
A = HYCS weekly close
B = 13-week exponential average of A
C = 28-week exponential average of B
The chart below displays these variables.
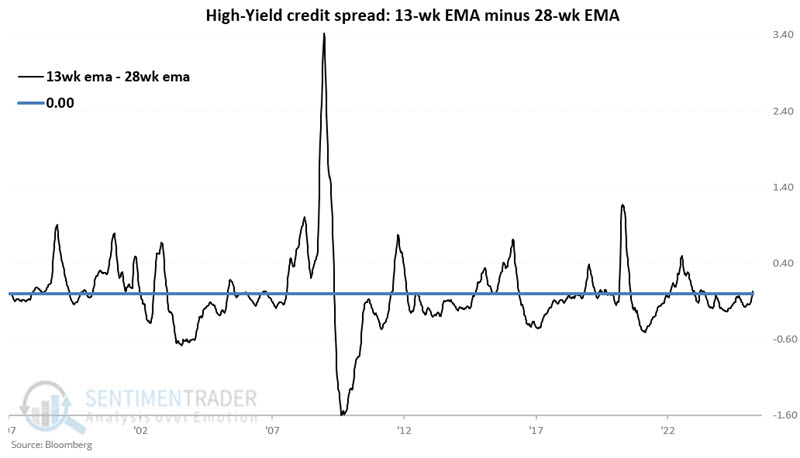
From here, we take the difference between the two moving averages.
D = A - B
The chart below displays the value for Variable D.
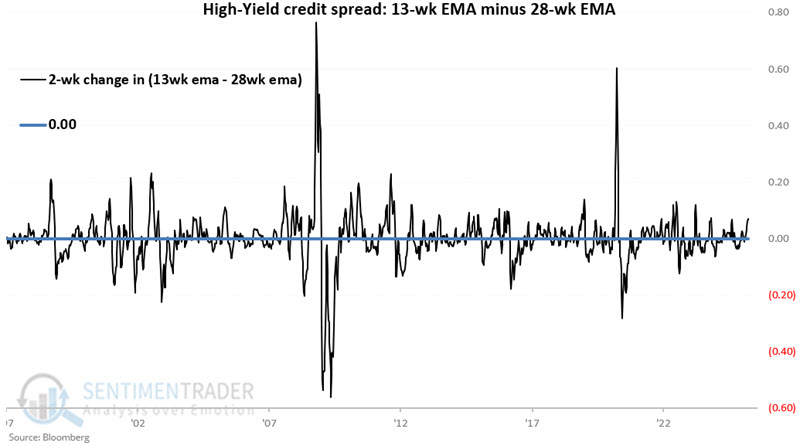
Next, we compare this week's 13-week EMA minus the 28-week EMA value to the value from two weeks ago.
E = Value for D two weeks ago
F = D - E
The chart below displays the two-week change in the 13-week minus 28-week spread.
We use variables D and F to determine the trend of our indicator.
G = If D and F are both positive, then G = 0 else G = 1 (i.e., this indicator is unfavorable when both D and F are above 0)
If G = 1, we consider this indicator favorable, and if G = 0, we consider this indicator unfavorable
In English:
If a) the 13-week EMA is above the 28-week EMA AND b) the difference between the 13 and 28-week EMAs this week is above the difference two weeks ago (i.e., if both of these measures are in uptrends), then we rate this indicator as "unfavorable." If either of the measures is in a downtrend, then this indicator is "favorable."
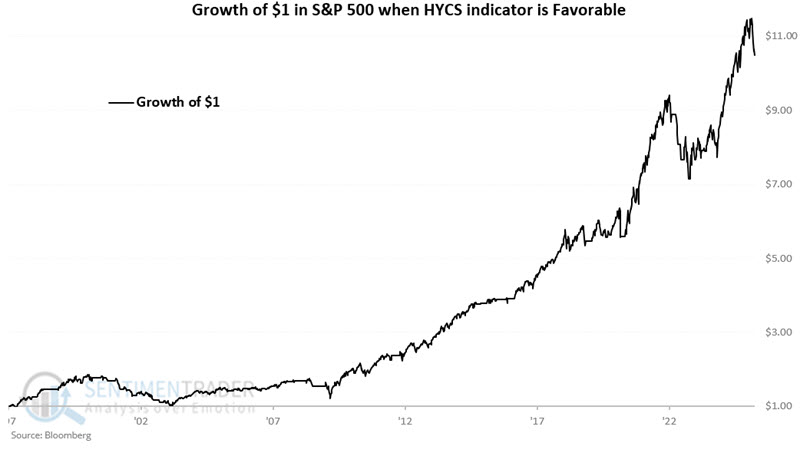
The chart below displays the hypothetical growth of $1 in the S&P 500 only when this model is favorable (i.e., G = 1). Since 1997, $1 grew to $10.48.
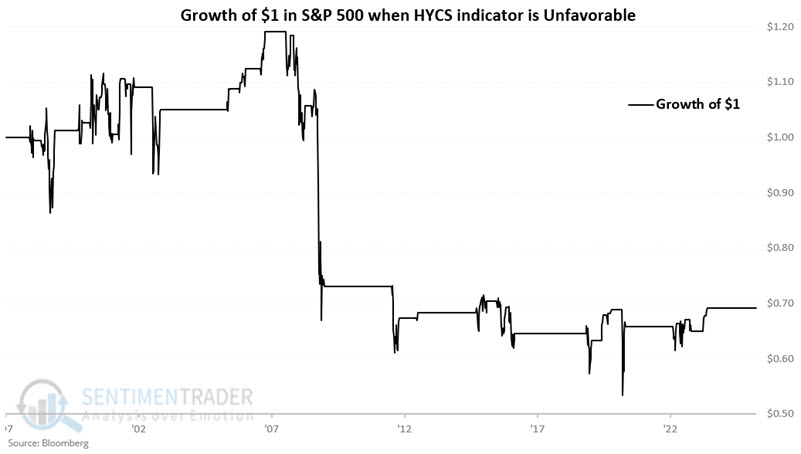
The chart below displays the growth of $1 in the S&P 500 only when the model is unfavorable. Since 1997, $1 has declined to $0.69.
This High-Yield Credit Spread model turned unfavorable on 2025-03-28.
Indicator #2: Credit Default Swaps
Next, let's turn our attention to the CDX Index. Per our website:
Over the past few years, one of the fastest-growing derivatives markets is that for credit default swaps (CDS). A CDS allows the various parties to swap the exposure of default of the underlying credit (i.e., bond). For example, the investor in a relatively risky bond might be uncomfortable that the bond issuer could default on their payments. To hedge that risk, the investor buys a CDS.
When they buy the CDS, the investor pays another trader (the seller) a periodic payment. That other trader then takes on the risk that the issuer of the bond will default. If that happens, the seller is responsible for paying the bond investor an agreed-upon amount. This allows the original investors to offset some of their risk, the seller to generate a stable flow of income, and the bond market to enjoy more liquidity. Of course, just like selling options, the seller of a CDS takes on possibly significant risks, and a major system-wide event could trigger a massive wave of trouble since this market has become so huge.
As posted to the site, the indicator tracks an index created by Dow Jones, which monitors the spread between credit default swaps on high-yield (i.e., junk) bonds and Treasury securities. The higher the index, the wider the spread...this means that credit investors are increasingly worried about defaults and are willing to pay higher prices for default protection. We expect it to track volatility measurements like the VIX quite closely, as times of fear should see this index spike higher, and times of complacency should see it become very subdued. In that sense, it is a contrary indicator.
For this model:
H = CDX Index weekly close
I = 14-week exponential average A
J = 25-week exponential average of A
K = I - J
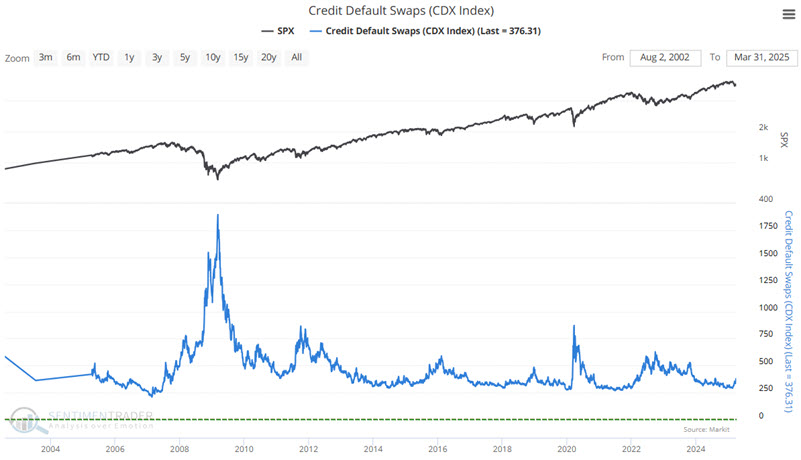
The chart below displays the CDX Index. Note the tendency to rise during times of stock market turmoil.
The chart below displays the value for variable K above (the difference between the 14-week and 25-week EMAs).
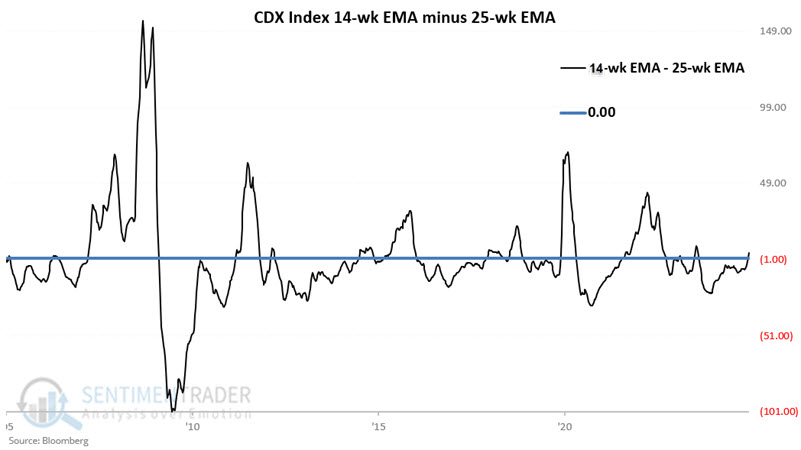
Readings for variable K below zero are considered favorable, and readings above zero are considered unfavorable.
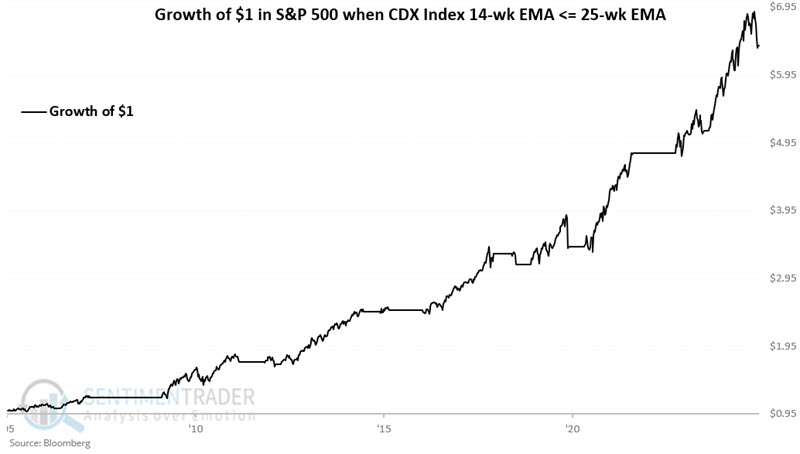
The chart below displays the hypothetical growth of $1 in the S&P 500 only when this model is favorable (i.e., K <= 0). Since 2005, $1 grew to $6.38.
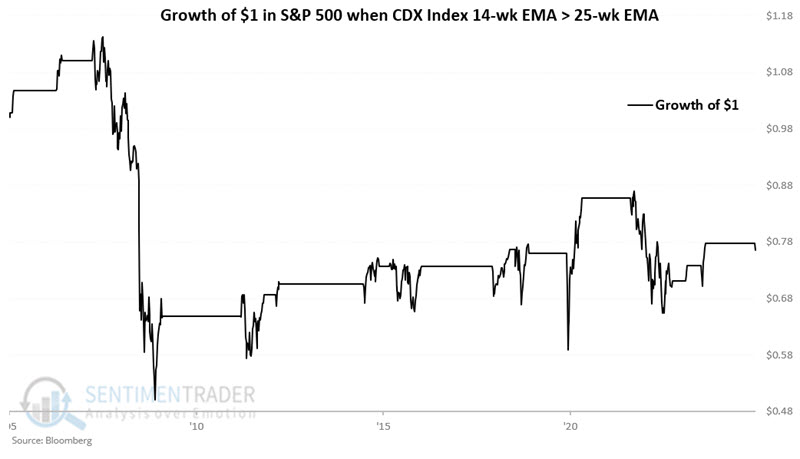
 The chart below displays the hypothetical growth of $1 in the S&P 500 only when this model is unfavorable (i.e., K > 0). Since 2005, $1 fell to $0.77.
This CDX Index model turned unfavorable on 2025-03-21.
Combining High Yield Credit Spread and the CDX Index models into a Combined Model
Let's create a simple model using the two methods detailed above.
If variable G above = 1 then L = 1 else L = 0
If variable K above is <= 0 then M = 1 else M = 0
N = L + M
N (i.e., our Combined Model) can equal +2, +1, or 0.
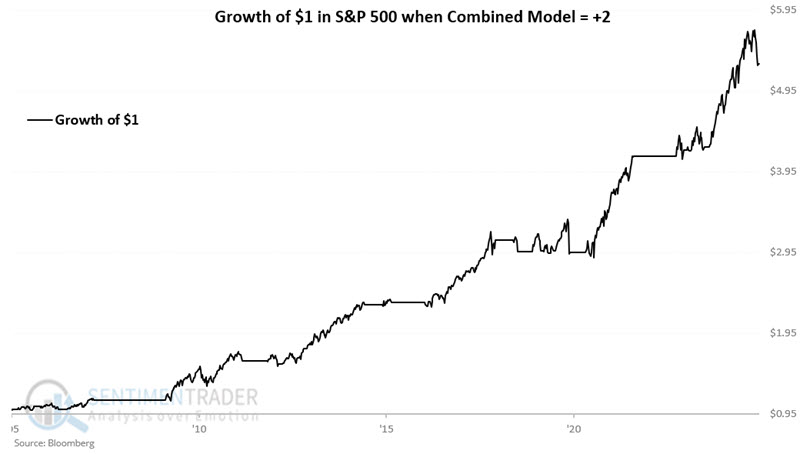
The chart below displays the hypothetical cumulative growth of $1 in the S&P if N = +2 (i.e., high-yield credit spread and the CDX Index are both in downtrends and thus rated as favorable). Since 2005, $1 grew to $5.29.
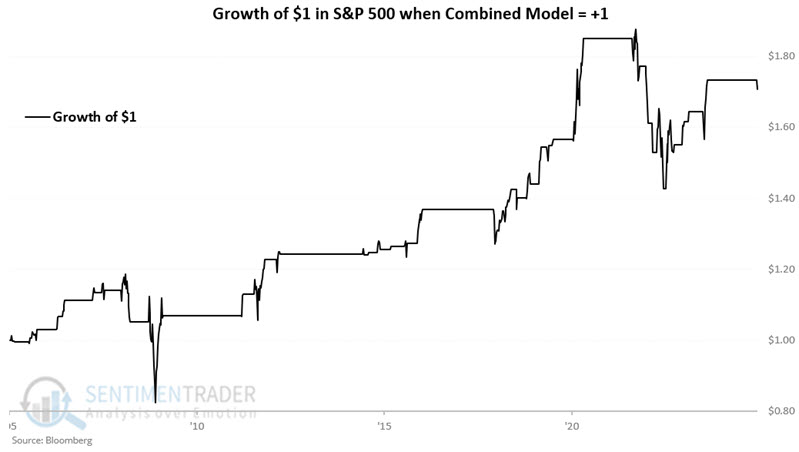
The chart below displays the hypothetical cumulative growth of $1 in the S&P if N = +1 (i.e. if only one of the two models is favorable). Since 2005, $1 has grown to $1.71, albeit with significant drawdowns in 2008-2009 and 2022.
The chart below displays the hypothetical cumulative growth of $1 in the S&P if N = 0 (i.e., high-yield credit spread AND the CDX Index models are BOTH in uptrends and thus rated as unfavorable). Since 2005, $1 declined to $0.54.
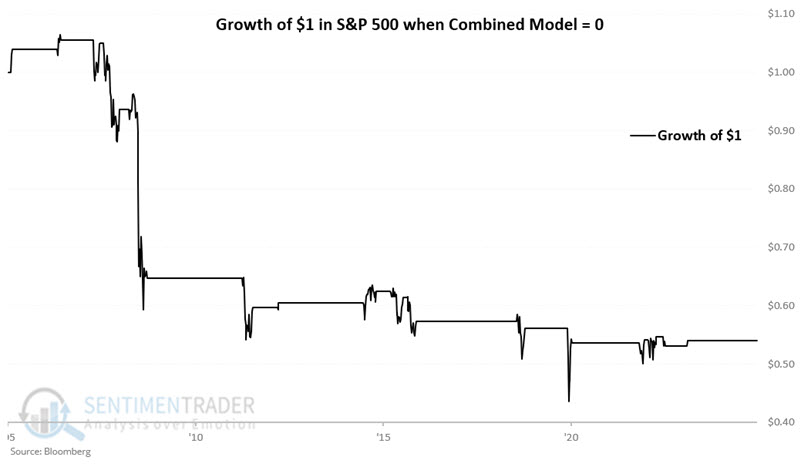
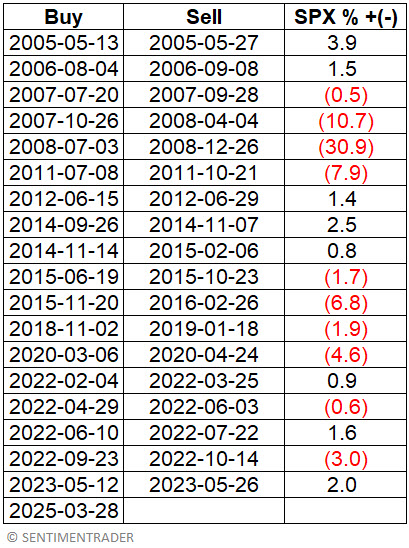
As of 2025-03-28, the Combined Model for credit spreads is at 0, which is unfavorable for stocks. This is troubling because the stock market tends to make little progress while this model is unfavorable. The table below displays the S&P 500's performance during previous "unfavorable" periods.
The table below summarizes S&P 500 performance during these periods.
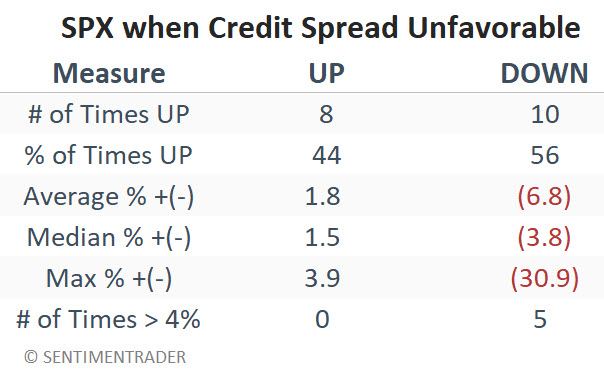
The key point to note is the stock market's lack of upside progress during previous unfavorable periods. The largest "start of the unfavorable period to end of the unfavorable period" gain was +3.9%. The median gain during those times when the market did advance was just +1.5%. Likewise, moves of 4% or more skewed 5 to 0 to the downside.
The market is presently on a hair trigger. A favorable development regarding tariffs and/or the Ukraine war could easily propel stocks sharply higher. But for now, investors looking for an "all clear" signal should watch for an easing in credit spreads.
What the research tells us…
Credit spreads essentially reflect the collective state of mind of the credit markets. When spreads are calm and quiet and generally trend lower, it typically reflects a favorable environment for stocks. When spreads are volatile, chaotic, and widening, they usually reflect significant uncertainty. And as the old adage goes, "The stock market hates uncertainty." Our credit spread Combined Model is presently in an unfavorable status. While we do not recommend using this model as a standalone buy and sell strategy, the chart above highlights that stocks have made little headway when both parts of the Combined Model are unfavorable. If history proves a useful guide, the stock market may not reverse higher in any significant way until either high-yield credit spreads begin to narrow and/or the Credit Default Swap Index turns down,
UPDATE on a previous article
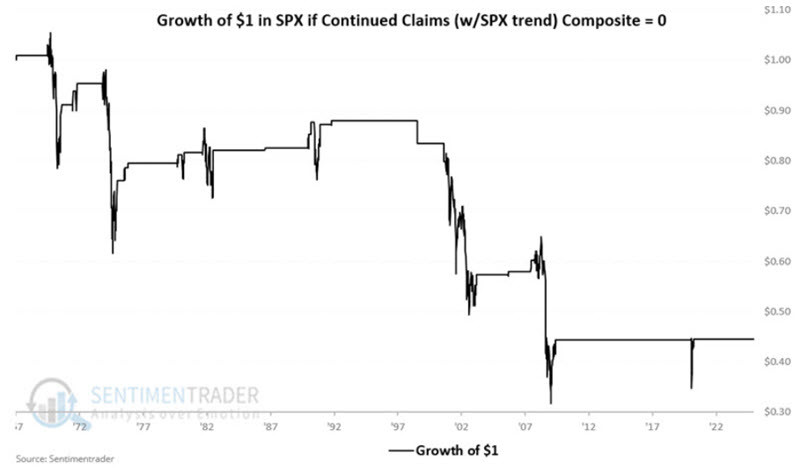
In this article, dated 2025-02-10, I wrote about Continued (Unemployment) Claims as a stock market indicator. The model I wrote about in that piece has also recently turned unfavorable for stocks. Like the Credit Spreads Combined Model detailed above, the Continued Claims model is not intended as a standalone trading system, and "signals" should not be regarded as "buy" or "sell" signals that suggest moving 100% into or out of stocks. They merely provide "weight of the evidence." So, these signals are not a reason to panic or "sell everything." They do serve, however, as suggestions that the stock market may not make a lot of upside headway until one or more of these models reverse (i.e., credit spreads and/or continued unemployment claims ease).
The model detailed in the linked article now has a reading of 0. For reference, the chart below displays the hypothetical growth of $1 when my Continued Claims Composite model is equal to 0.