
Credit Default Swaps may be flashing a warning

Key Points
- The trend in credit default swaps has reversed back to a downtrend
- As highlighted in late September, a downtrend in the CDX Index can act as a warning sign
- The model is best not used as a standalone trading model but as an alert of potential volatility and downdrafts
A quick review of credit spreads
To allow this article to stand on its own, the text below in this section and the An Overview of Credit Default Swaps section below are nearly identical to the text discussing these topics in this article, dated 2023-09-26.
This topic is being covered again because the 14-week EMA recently crossed back above the 25-week EMA.
A "credit spread" measures the difference in the current yield for a lower-rated security versus a higher-rated security. The lower the rating for a given debt instrument, the higher the likelihood the issuer will default and be unable to repay all of the promised interest and principal. The higher the rating for a given debt instrument, the less likely the issuer will default and be unable to repay all of the promised interest and principal.
As a result, to attract buyers, lower-rated debt instruments must offer a higher interest rate (i.e., yield) to compensate for the higher risk of default. By monitoring the level and trend of credit spreads, an investor can understand the amount of fear in the market. In a sense, credit spreads in the bond market serve a similar function as the VIX Index in the stock market. Credit spreads essentially measure "fear."
When there is fear in the bond market, credit spreads will widen as buyers of lower-rated securities demand much higher yields to compensate for the (real or perceived) increase in risk. On the other hand, if things are generally calm, that demand diminishes, and credit spreads narrow.
The type of credit spread we will focus on in this piece is known as a "Credit default swap." Credit default swaps are a little-understood derivative that allows the various parties to swap the exposure of default of an underlying bond.
An Overview of Credit Default Swaps
Over the past few years, one of the fastest-growing derivatives markets is for credit default swaps (CDS). A CDS allows the various parties to swap the default exposure of the underlying credit (i.e., bond). For example, investors in a relatively risky bond might be uncomfortable that its issuer could default on their payments. To hedge that risk, the investor buys a CDS.
When they buy the CDS, the investor pays another trader (the seller) a periodic payment. That other trader then takes on the risk that the bond issuer will default. If that happens, the seller is responsible for paying the bond investor an agreed-upon amount. This allows the original investors to offset some of their risks, allows the seller to generate a stable flow of income, and allows the bond market to enjoy more liquidity. Of course, just like selling options, the seller of a CDS takes on possibly significant risks, and a major system-wide event could trigger a massive wave of trouble since this market has become so huge.
The CDX Index indicator posted to our site tracks an index created by Dow Jones, which monitors the spread between credit default swaps on high-yield (i.e., junk) bonds and Treasury securities. The higher the index, the wider the spread - which means that credit investors are increasingly worried about defaults and are willing to pay higher prices for default protection.
The stock market hates uncertainty. As a result, when credit spreads widen (i.e., when the blue line in the chart above "spikes" higher) - indicating some turmoil in the financial system - the stock market tends to react negatively. The real question then becomes, "Is there a way to objectively use credit spreads as a trading tool?" One potential way to do so is to follow the trends in the CDX Index.
Tracking Credit Default Swaps with the CDX Index
The CDX Index is a "fear gauge" that measures stress in the financial markets. As such, we expect it to rise when the stock market falls and vice versa. The chart below displays the history of CDX Index movements going back several decades.
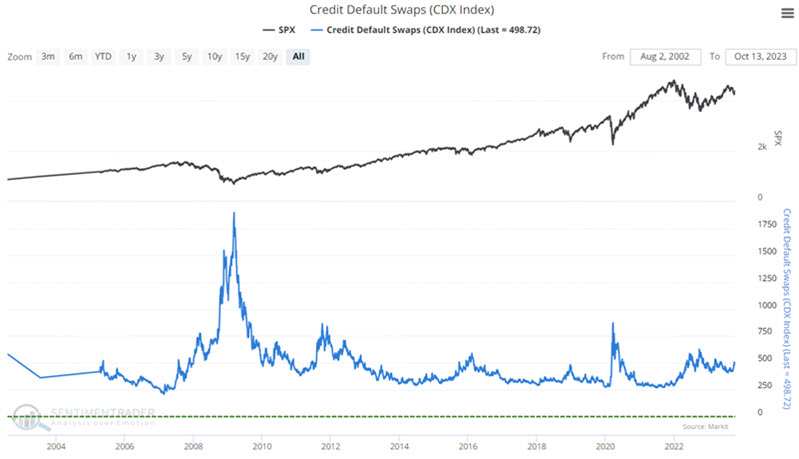
It is easy to "eyeball" the big spikes in the CDX Index (blue line) in 2008 and 2020 and the accompanying selloffs in the S&P 500 (black line). But other runups in CDX in 2011, 2015, 2018, and 2022 also accompanied meaningful pullbacks in stock prices. Rather than relying on the eyeball test, we prefer quantifying results objectively. The trend of the CDX Index is more important than the raw value for the CDX Index.
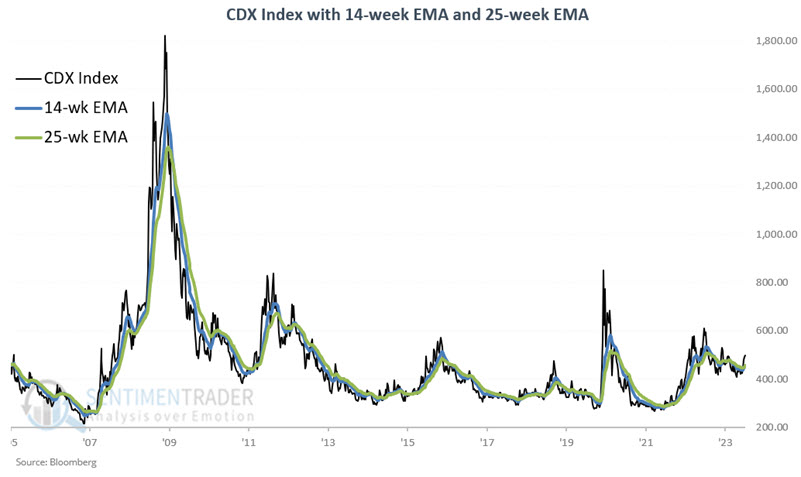
To track the trend of the CDX Index, we use a 14-week and a 25-week exponential moving average. The chart below displays the CDX Index with its 14- and 25-week EMAs.
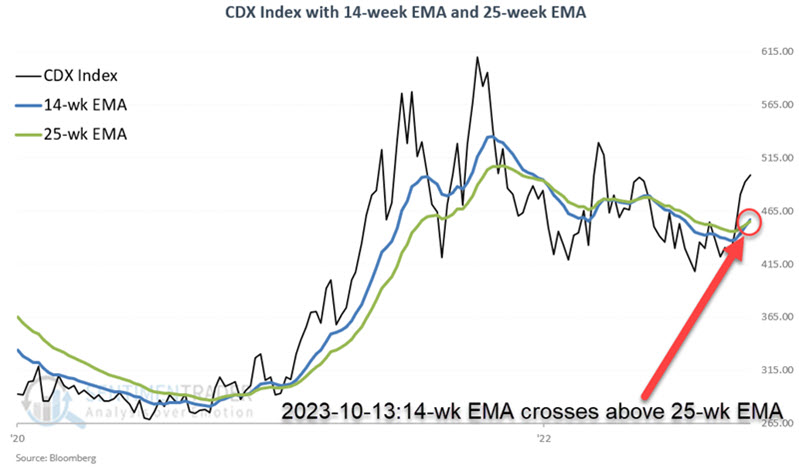
The 14-week EMA just crossed back above the 25-week EMA
The 14-week EMA had been below the 25-week EMA since 2023-01-06 (except for three weeks from 2023-05-06 to 2023-06-02) but closed back above the 25-week EMA on 2023-10-13. During that time, the S&P 500 Index gained +11.1%, and the Nasdaq 100 gained +35.8%.
The latest action removes this indicator from the bullish side of the ledger and slides it over to the unfavorable side.
The CDX Index and S&P 500 performance
Let's update the S&P 500 Index performance based on whether the 14-week EMA for the CDX Index is above or below its 25-week EMA.
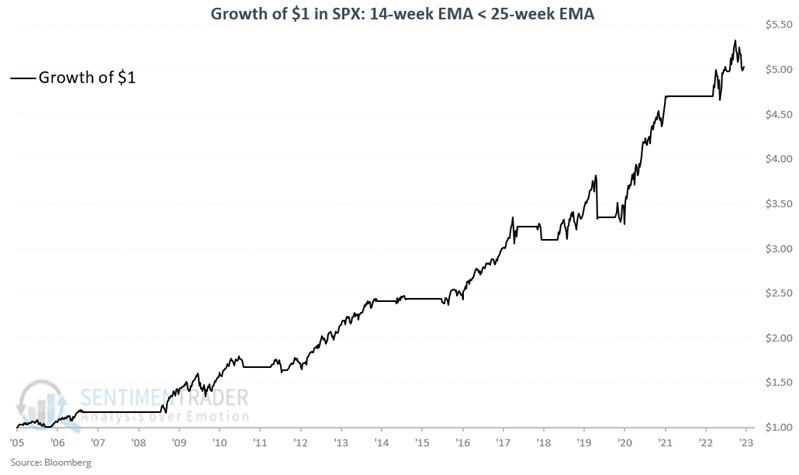
The chart below displays the cumulative percentage performance for the S&P 500 Index if held long only when the CDX Index's 14-week EMA is below its 25-week EMA. Since the CDX Index was first calculated in 2005, the S&P 500 has gained +403%, while the 14-week EMA is below the 25-week EMA. We see the solid - if uneven - gain in 2023 at the far right.
The chart below displays the cumulative percentage performance (-29.5%) for the S&P 500 Index if held long only when the CDX Index's 14-week EMA is above its 25-week EMA as it is now.
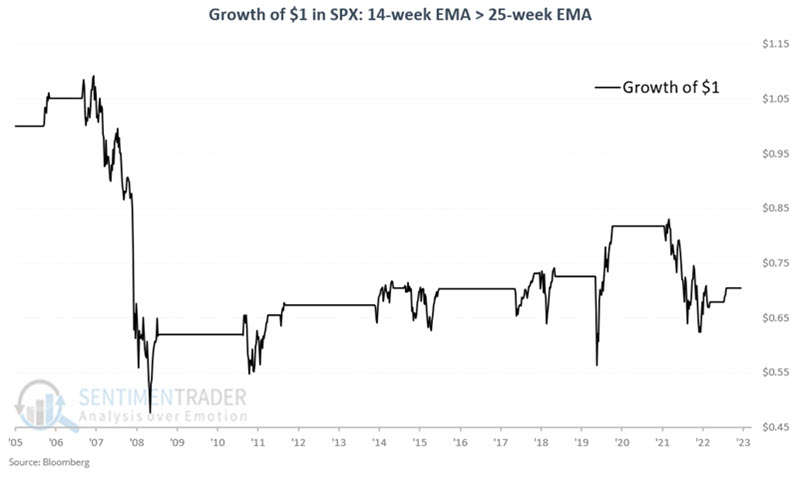
A closer analysis of the chart above is essential to understand what the latest crossover means - and does not mean - for stocks. From start to finish, a number of the so-called "unfavorable" periods ended with the S&P 500 showing a net gain. On the other hand, each of these periods experienced extreme price volatility and witnessed significant, sharp downdrafts along the way. In addition, this signal nicely sidestepped large swathes of the 2008 and 2022 bear markets.
This indicator may be somewhat lacking as a standalone buy-and-sell signal generator. However, it has proven helpful as a warning of impending market volatility and potential downside risk (.i.e., the risk of a sharp interim decline or outright bear market appears to be higher when this indicator is unfavorable).
What the research tells us…
The recent cross of the 14-week EMA above the 25-week EMA of the CDX Index should not be considered a reason to panic or a "Sell Everything!" alert. This latest action alerts us that - if history proves an accurate guide - the market could become more volatile in the months ahead, with the potential for large up and down swings in price. The threat of a bear market is also heightened. As long as major indexes like the S&P 500 and Nasdaq 100 hold up, there is no need to panic. However, defensive action may be appropriate if these indexes start to break.