Products
SentimenTrader Trading Tools
‍
Backtest Engine
My Trading Toolkit
Correlation Analysis
Seasonality
Market Prediction
Indicators & Data API
‍
Proprietary Indicators & Charts
Market Data API
Strategies & Scanner
‍
50+ Trading Strategies
Smart Stock Scanner
Smart Option Scanner
Research Reports
‍
Research Solutions
Reports Library
Free Resources
Simple Backtest Calculator
Simple Seasonality Calculator
The Kelly Criterion Calculator
Sentiment Geo Map
Public Research Reports
Education
Sentiment Indicators
Technical Indicators
Pricing
Company
About
In the News
Testimonials
Client Success Stories
Contact
Log inLoginSign up
< BACK TO ALL REPORTS

Crap And Gap

Jason Goepfert
2018-10-12
null

Whenever there is volatility like that past two days, it's easy to pick and choose from a number of different extremes. There are so many that one can find something, anything, to support their view of either a bounce or more selling pressure.

The majority of what we looked at was inconclusive. There were some compelling suggestions for a short-term bounce, but it wasn't overwhelming, not like it was in February or at some of the other mini-panics like 2011 or 2015. 

Regardless, futures are seeing a strong bounce with gains hovering about 1% above yesterday's close. Let's take a look at strong opens following multiple large down days.

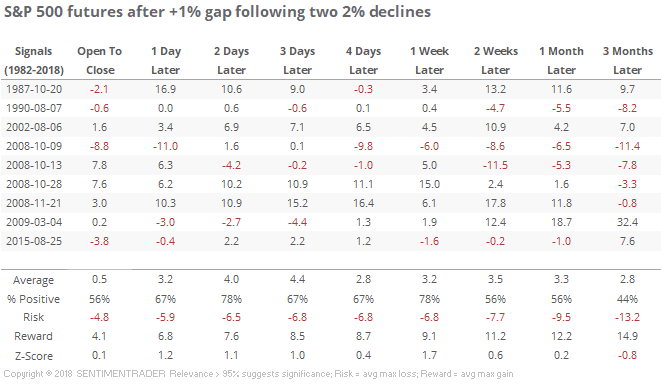
Even after accounting for the large gap up, returns over the next couple of sessions were strong. But if the gap starts to fade, like it did yesterday in the opposite direction, then the implications become a lot less compelling.

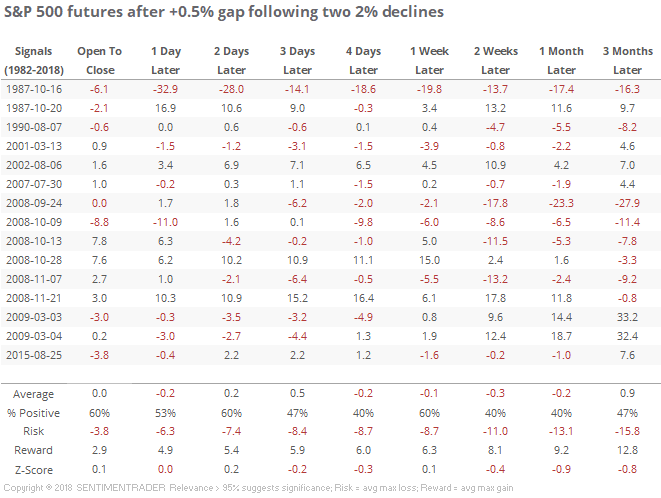
The suggestion is that if we see a large move down, and yet buyers are only marginally interested in buying the dip, then it's more likely to precede further selling pressure, as opposed to times when buyers are extremely interested in the dip.

To get more signals, instead of requiring two 2% down days, let's just look at a two-day move of more than -5%, with at least a moderate gap-up open the next day (this morning in our current instance).

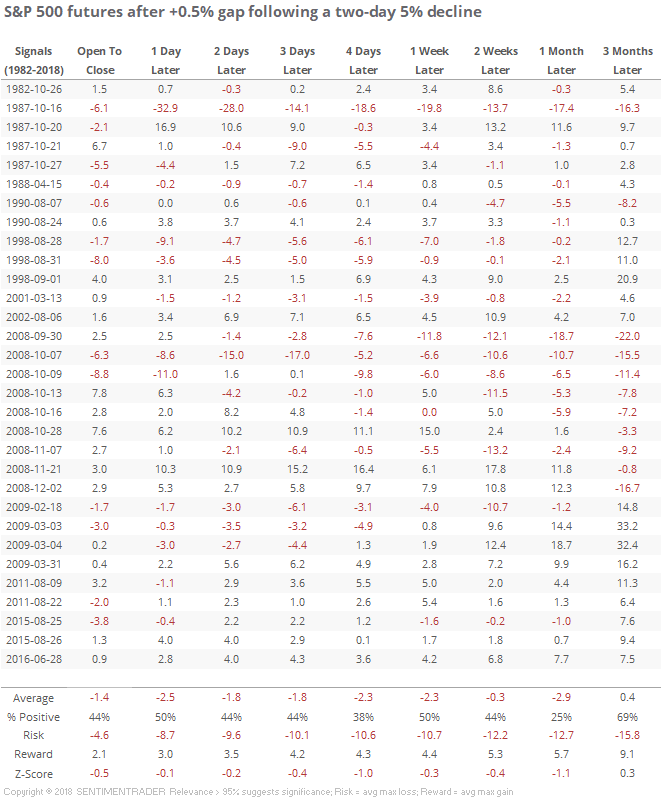
These were quite a bit more negative, with an outright negative expectation. The ones in October did not have a good record. They were also almost always triggered during a bear market. If we filter the table to only include times when the 200-day average on the S&P was rising, then it cuts down the sample size drastically.

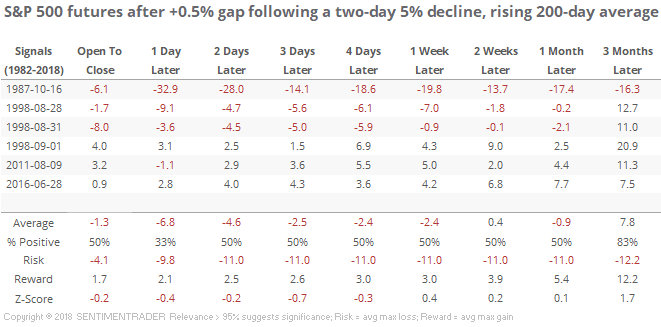
Very mixed. It led to dramatic declines in '87 and '98, big bounces in '11 and '16.

Kind of like what we looked at yesterday, indicators and studies are mixed. It's easy to find something to support either a bounce, or not, and that's not a good edge. At the better knife-catching opportunities in past years, the evidence was much more overwhelming so I do not see good odds here either way. It's starting to tilt to the positive side over a medium-term time frame, but again it's still not heavily skewed unlike past lows.

And if you're not on Twitter, it's hard to ignore this.


PRODUCTS
SentimenTrader
Trading Tools
Indicators & Data API
‍
Strategies & Scanner
‍
Research Reports
FREE
RESOUrCES
Simple Backtest
Calculator
Simple Seasonality
Calculator
The Kelly Criterion
Calculator
Sentiment Geo Map
‍
Public Research Reports
‍
Education
Sentiment Indicators
‍
Technical Indicators
‍
Pricing
Bundle pricing
‍
FAQ
‍
Announcements
‍
COMPANY
‍
About
‍
In the News
‍
Testimonials
‍
Client Success Stories
CONTACT
‍
General Inquiries
‍
Media Inquiries
‍
Financial Professionals Inquiries
‍
© 2026 Sundial Capital Research Inc. All rights reserved.
Setsail Marketing
TermsPrivacyAffiliate Program
Risk Disclosure: The information and tools provided are for research and analytical purposes only and are not intended as investment advice. Market analysis involves uncertainty, and outcomes may differ from expectations. Users should conduct their own due diligence and consider their individual circumstances before making any financial decisions. Past performance is not necessarily indicative of future results.

Hypothetical Performance Disclosure: Hypothetical performance results have many inherent limitations, some of which are described below. No representation is being made that any account will or is likely to achieve profits or losses similar to those shown; in fact, there are frequently sharp differences between hypothetical performance results and the actual results subsequently achieved by any particular trading program. One of the limitations of hypothetical performance results is that they are generally prepared with the benefit of hindsight. In addition, hypothetical trading does not involve financial risk, and no hypothetical trading record can completely account for the impact of financial risk of actual trading. for example, the ability to withstand losses or to adhere to a particular trading program in spite of trading losses are material points which can also adversely affect actual trading results. There are numerous other factors related to the markets in general or to the implementation of any specific trading program which cannot be fully accounted for in the preparation of hypothetical performance results and all which can adversely affect trading results.

Testimonial Disclosure: Testimonials appearing on this website may not be representative of other clients or customers and is not a guarantee of future performance or success.