Cotton is Surging

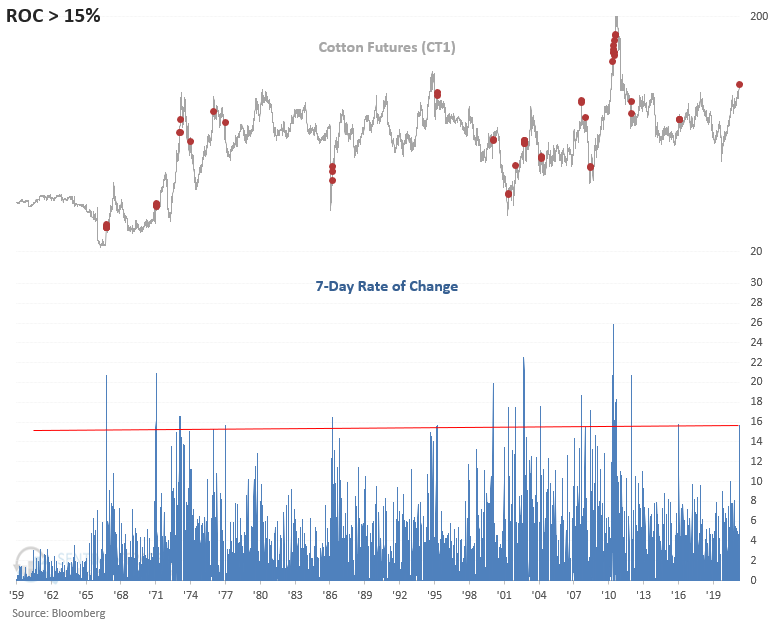
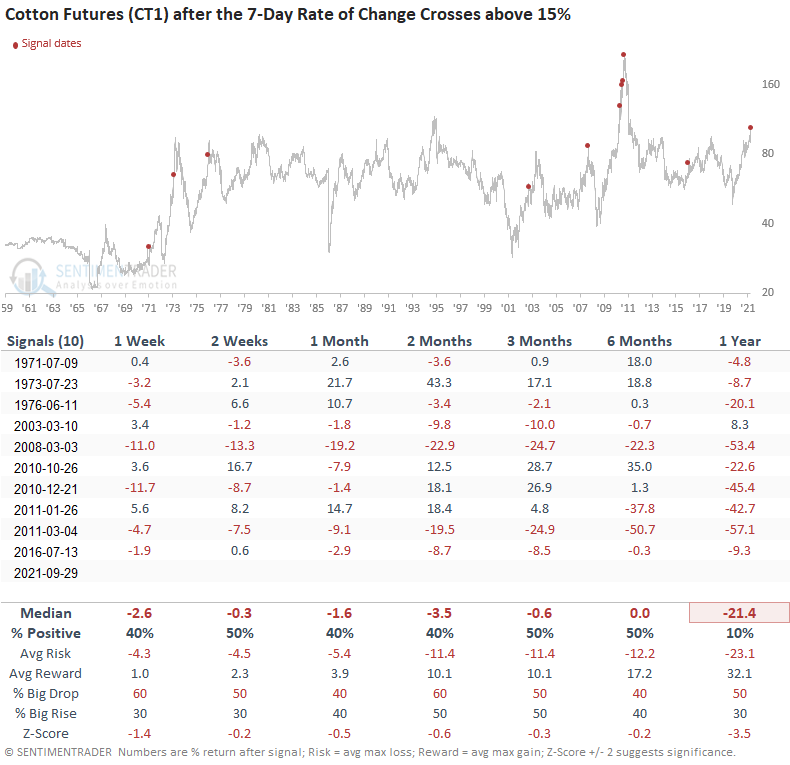
For only the 23rd time since 1959, cotton prices have risen by 15% or more over the previous seven-day period. So, what should we expect from here if we use history to guide our future outlook for cotton prices?
Let's conduct a study to assess the outlook for cotton futures when the 7-day rate of change crosses above 15%.
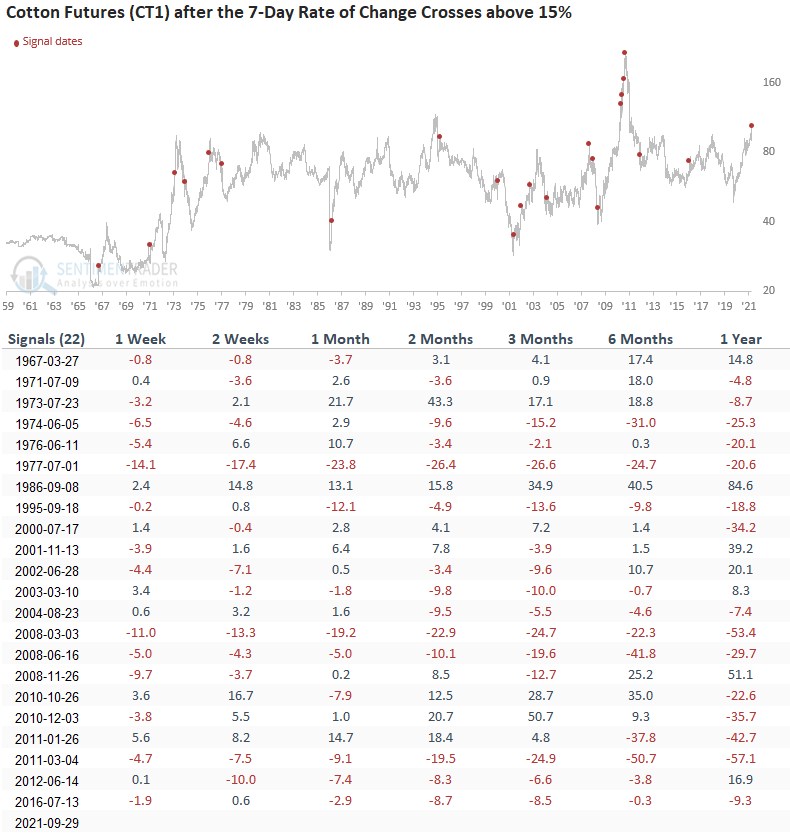
HISTORICAL CHART
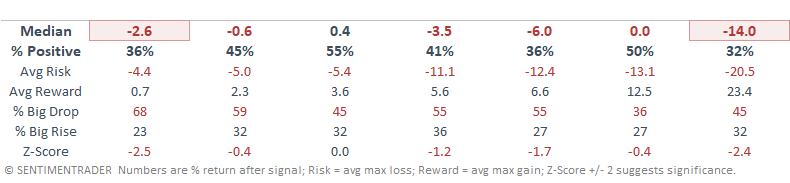
HOW THE SIGNALS PERFORMED
Results look weak across all time frames, especially the 1-year results. However, I would note that thrusts that occurred immediately after a significant low continued to exhibit upward momentum.
Let's add some context to the study. We will keep the rate of change parameter of 15% or greater and include a condition that the commodity closes at a 2-year high. The goal is to isolate historical instances similar to the current one.
HOW THE SIGNALS PERFORMED
Once again, results look weak across all time frames, and the 1-year window looks dreadful. As the chart shows, cotton is a commodity that rarely sustains long uptrends.
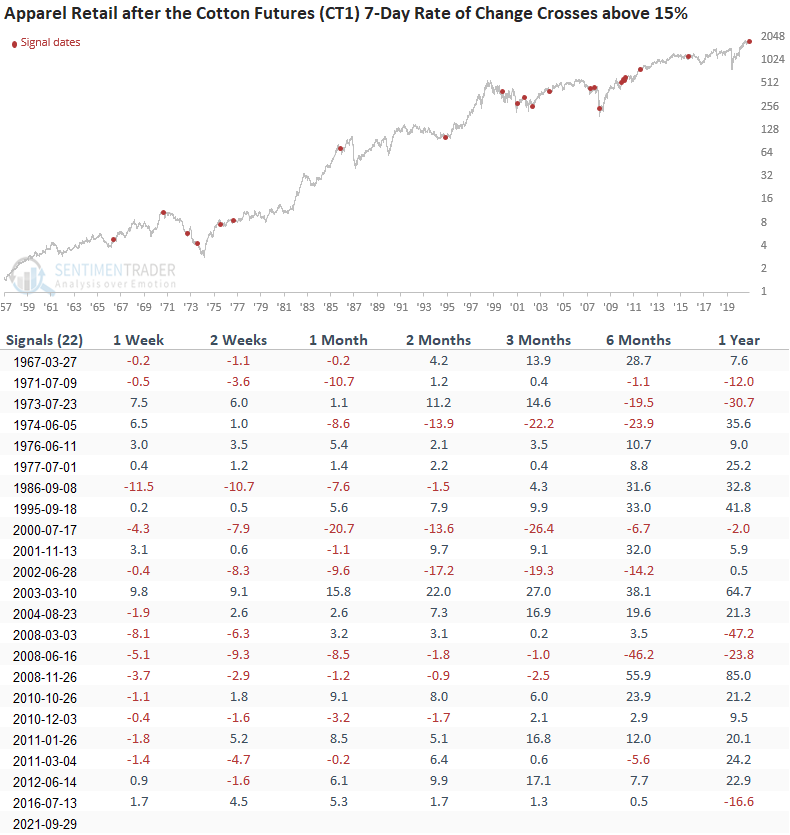
Let's take a look at the apparel retail sub-industry group to see if a sharp spike in the price of cotton impacts stock returns.
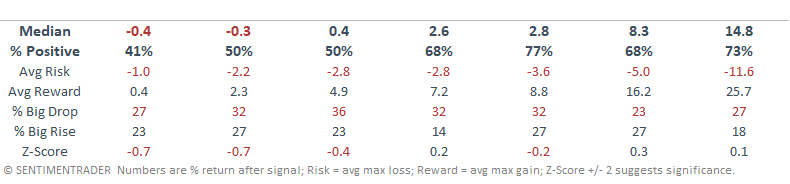
HOW THE SIGNALS PERFORMED
Results look weak in the short-term and somewhat better on an intermediate to long-term basis. Interestingly, a majority of instances occurred during equity bear markets.
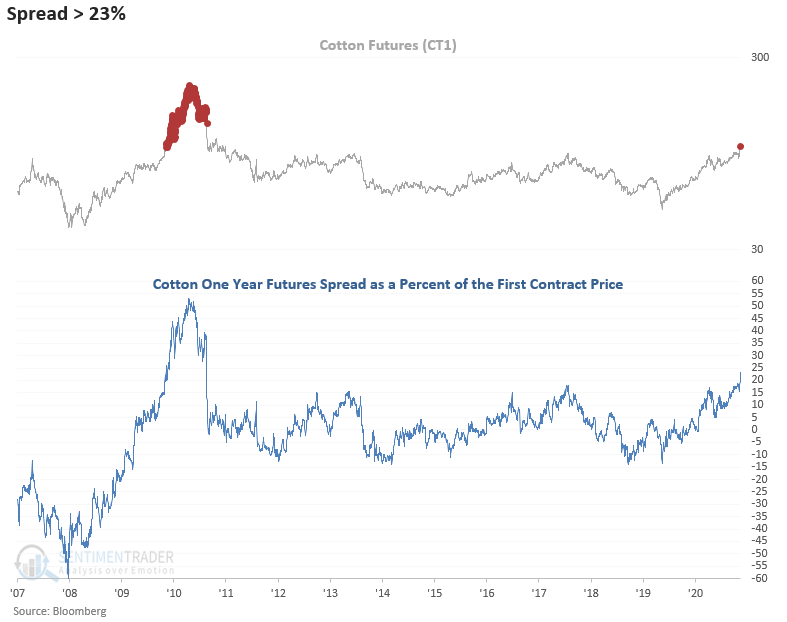
The one-year futures spread as a percent of the first contract price is an excellent indicator to assess a dislocation in the futures market for commodities. Historically, a high spread identifies significant peaks. In contrast, a substantial bottom typically occurs when the spread falls to a low level.
If you were wondering, this is how I calculate the spread. CT stands for Cotton.
Spread = (CT1-CT13)/(CT1)*100
SPREAD CHART
The one-year futures spread as a percent of the first contract price is trading at a level last seen in 2011. When the spread reached the current magnitude of 23% in 2010, the commodity rallied for an additional five months before peaking.