Corn Seasonality- Now What?
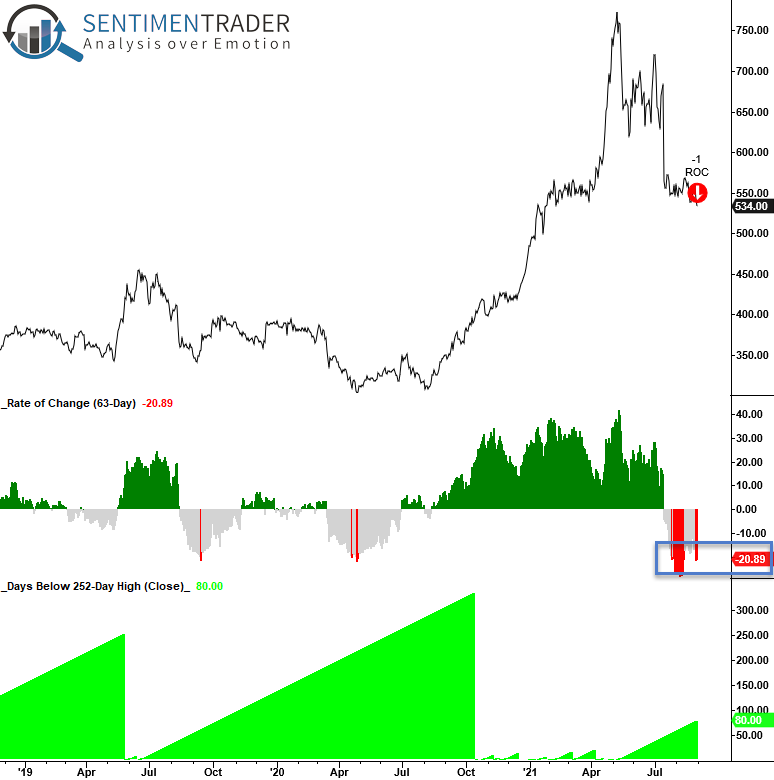
My colleague, Jay Kaeppel, has noted the seasonal summer headwinds for corn in several notes in the last few months. The commodity peaked in May and has now declined by a little more than 30% as of 8/31/21. If I apply a 63-day or 3-month rate of change to corn futures, we see that corn was down over 20% during the seasonally weak June to August timeframe.
With seasonality about to turn more favorable, should we be thinking about bottom fishing in corn futures?
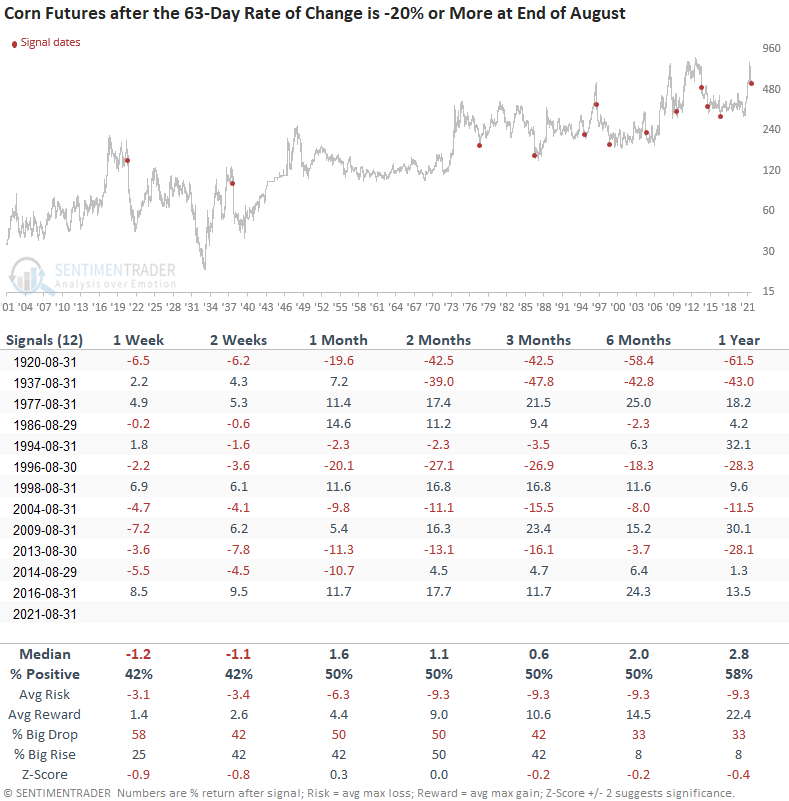
Let's conduct a study to assess the forward return outlook for corn futures when the 63-day rate of change is down 20% or more at the end of August. i.e., the current setup.
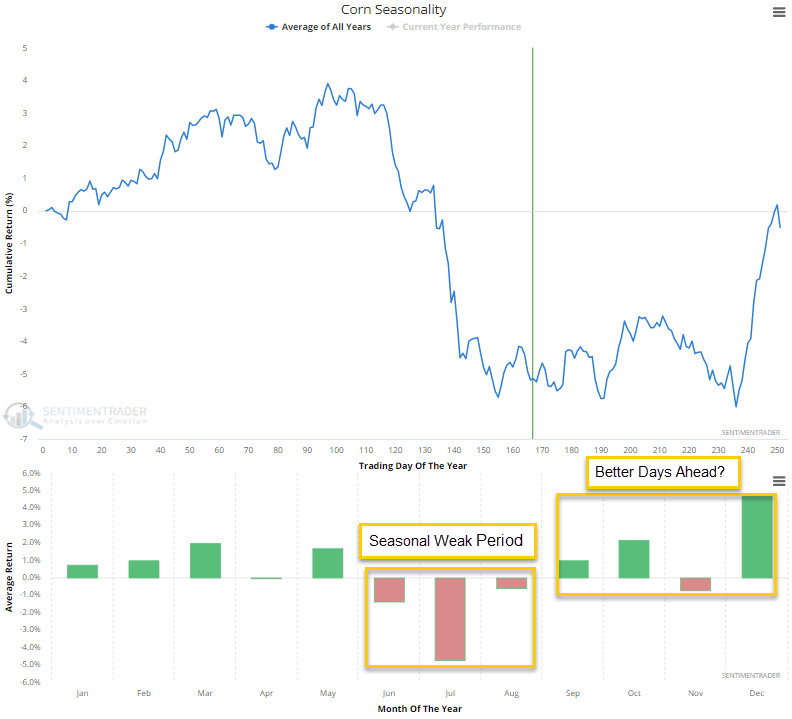
SEASONALITY CHART
As the chart shows, corn typically experiences a mean-reversion bounce after the seasonally weak summer months. Does that scenario play out this year?

CURRENT DAY CHART
HOW THE SIGNALS PERFORMED
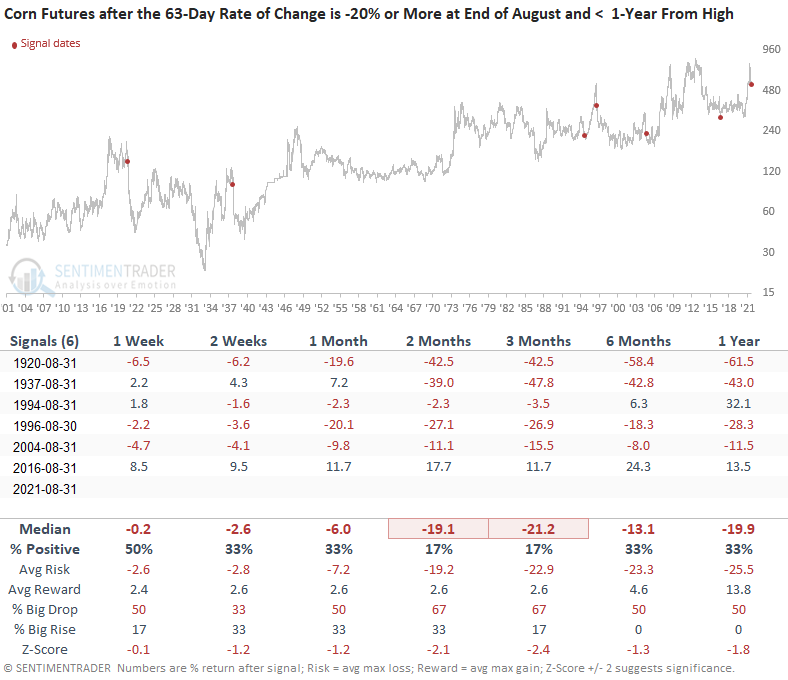
The weak momentum continues in the short term as the 1-2 week results look unfavorable. Once you get past that window, the results are a coin toss. I don't see anything to suggest that we should be bottom fishing in corn.
Let's add some more context to the study. The following table shows that corn is currently 80 days removed from its most recent 252-day high. Let's keep our original signal dates, but look at instances when corn was less than 1-year from a 252-day high.
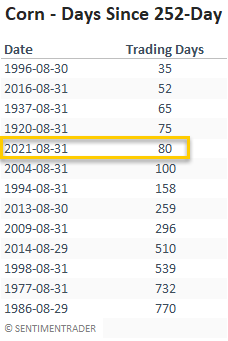
HOW THE SIGNALS PERFORMED
The results look weak except for the 2016 instance. Once again, I would altogether avoid any bottom fishing in the commodity.
