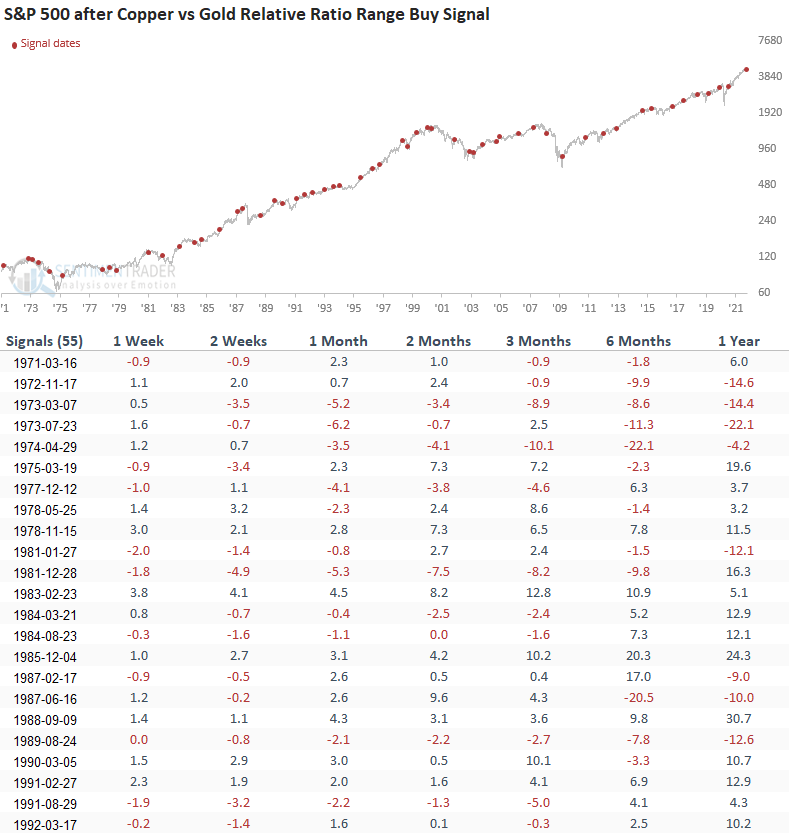
Copper vs. Gold Relative Ratio Risk-On Signal

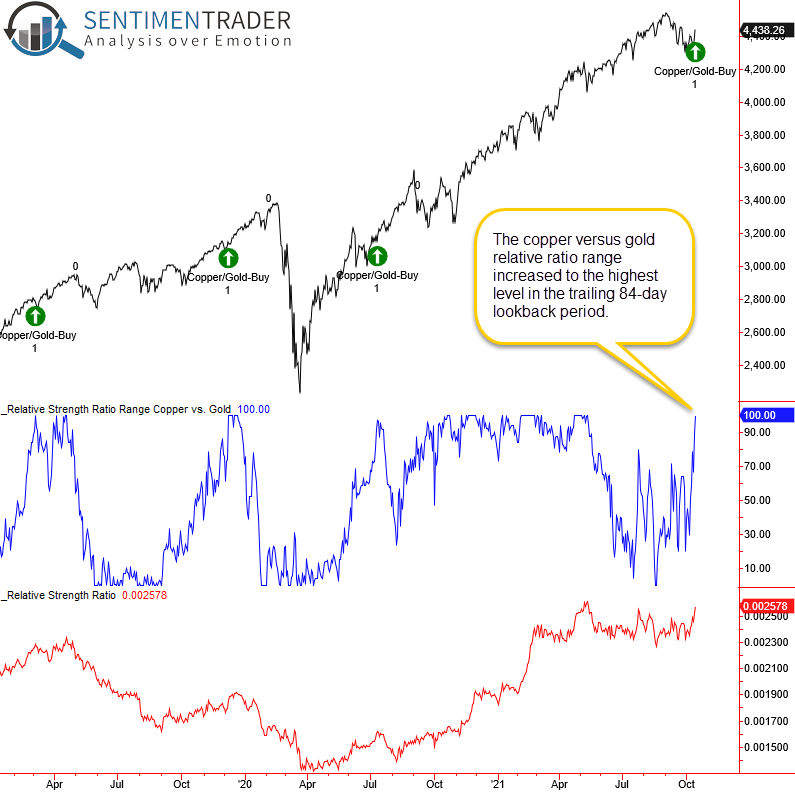
The copper versus gold relative ratio range surged to the highest level over the previous 84-day period, triggering a new risk-on signal for the stock market. Did the commodity with a Ph.D. in economics give us the all-clear signal for a year-end rally?
Let's review the risk-on concept and historical signal performance.
RELATIVE RATIO RANGE SIGNAL CONCEPT
The concept I use to identify relative ratio range signals is simple. I calculate the ratio for two securities and measure the range over a lookback period in percentage terms. The range rank methodology allows one to test threshold levels between 0 and 100%. I then optimized the signal to determine the most favorable lookback period, reset and buy level thresholds.
PARAMETERS FOR COPPER VS GOLD RELATIVE RATIO RANGE SIGNALS
Ratio = copper futures (HG1)/gold futures (GC1). The range rank for the relative ratio utilizes an 84-day lookback period.
- If the relative ratio range rank crosses below 1%, the reset condition is true.
- If the reset condition is true and the relative ratio range rank crosses above 92.75%, buy the S&P 500 index.
CURRENT DAY CHART
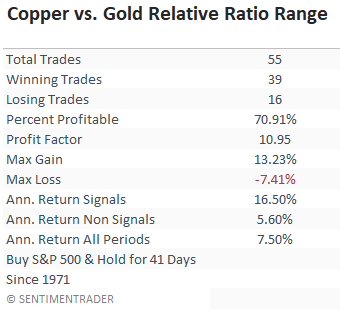
TRADING STATISTICS
The trading statistics in the table below reflect the optimal days-in-trade holding period of 41 days. When I run optimizations for trading signals, I cap the max number of days at 42.
The results look good, especially the profit factor.
If you were wondering, the profit factor shows how many dollars you gain for every dollar lost. So, the copper versus gold profit factor of 10.95 shows the trading signal gained $10.95 for every $1 lost. When assessing trading signals, I avoid models with a profit factor of less than 2/1.
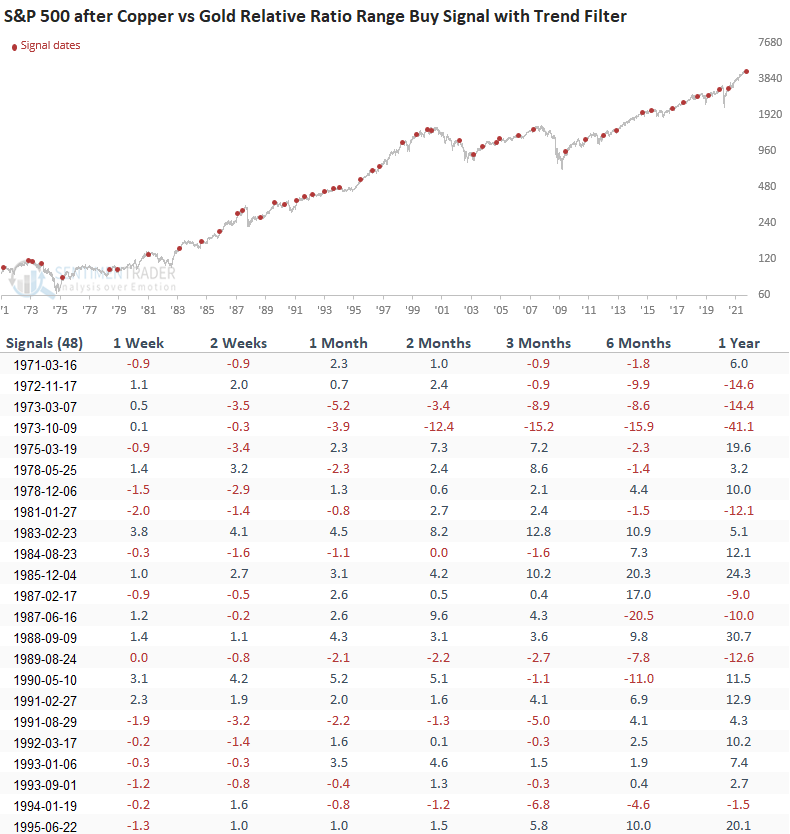
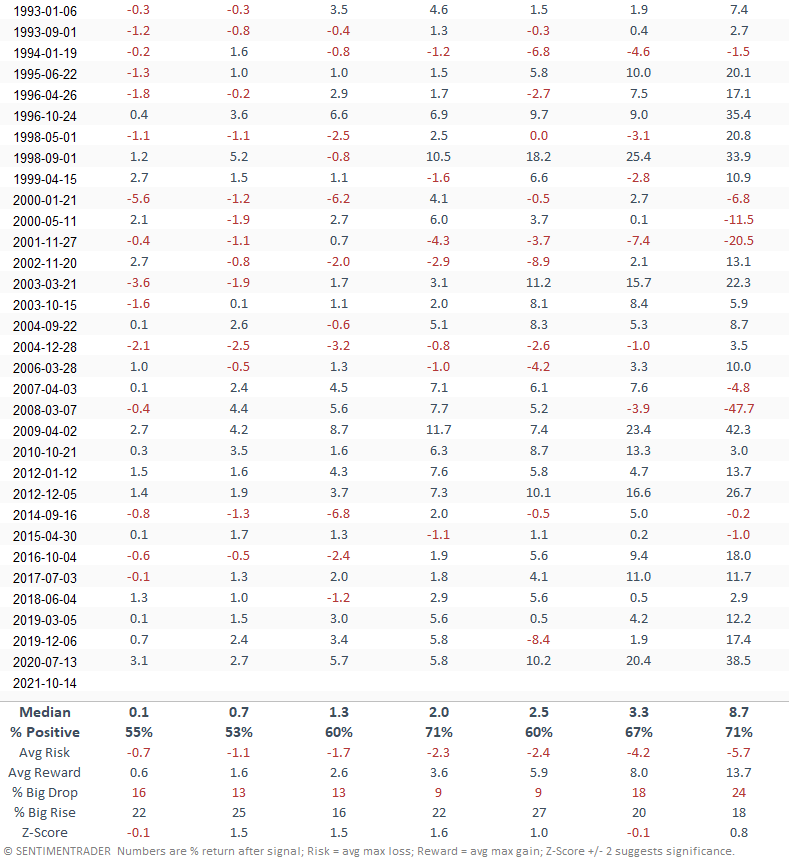
HOW THE SIGNALS PERFORMED
Results look slightly above historical averages with a good but not great risk/reward profile in the 2-8 week time frame.
I would note that the 2-month time frame has registered 13/14 winning trades since 2007. And, the 6-month window has recorded 12 consecutive winning trades.
Let's add a trend filter to the study to isolate instances similar to the current one. I will keep the original study parameters but now include a condition that requires the S&P 500 Index to be trading above its respective 200-day moving average.
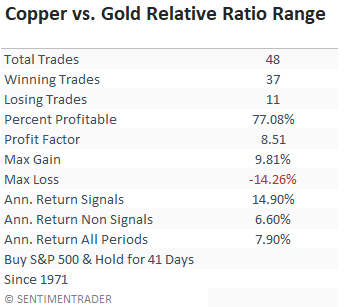
TRADING STATISTICS
The trading statistics in the table below reflect the optimal days-in-trade holding period of 41 days. When I run optimizations for trading signals, I cap the max number of days at 42.
Interestingly, the trend filter only eliminated seven signals. The winning percentage increased from 70.91% to 77.08%. However, the profit factor decreased from 10.95 to 8.51.
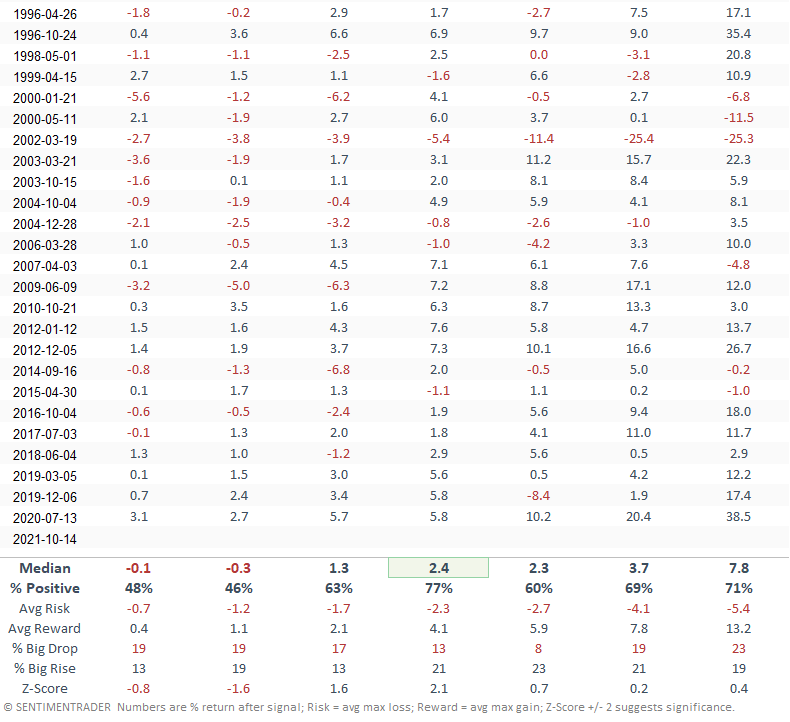
HOW THE SIGNALS PERFORMED
Results look uninspiring in the 1-2 week time frame. The intermediate to long-term performance looks better, especially the 2-month window, showing a solid risk/reward profile.
I would note the consistency has been good on an intermediate to long-term basis since 2007.