
Copper joins the S&P's technical buy signal

Last week, the S&P 500's medium-term trend overtook its long-term trend for the first time in months. While the technical signal itself is suspect, the fact that the index erased such a wide spread between trends has been universally positive over the next 6-12 months in recent decades.
At about the same time, the dollar's trends were reversing to the downside. And now copper is joining the S&P with a Golden Cross after a wide negative spread between its 50- and 200-day moving averages. The last time it did this, the metal soared over the next year.
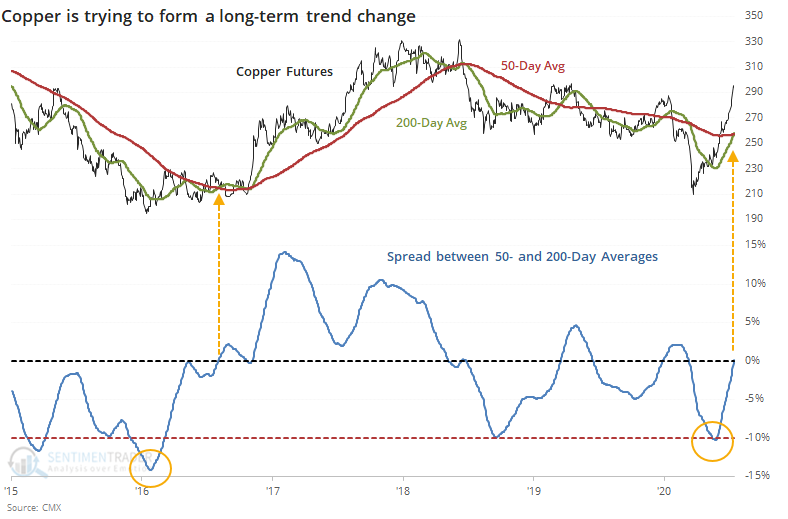
That trend change in 2016 was more the exception than the rule. Only once, in 2009, did it equate with an immediate and sustained bull market. All of the other signals showed a loss either 2 or 3 months later.
This is an abridged version of our recent reports and notes. For immediate access with no obligation, sign up for a 30-day free trial now.
We also looked at:
- Optimism on copper is at one of the highest levels since 1990
- Its seasonal window isn't great right now, either
- A look at the Golden Cross in copper vs assets like stocks, gold, bonds, and the dollar...all of which are interesting
- Chilean stocks are triggering sell signals
- Implied volatility in bonds is the lowest in a year, but the implications may be surprising
- Small business optimism has picked up