Data &
Technology
Research
Reports
Report Solutions
Reports Library
Actionable
Strategies
Free
Resources
Simple Backtest Calculator
Simple Seasonality Calculator
The Kelly Criterion Calculator
Sentiment Geo Map
Public Research Reports
Free Webinar
Pricing
Company
About
Meet Our Team
In the News
Testimonials
Client Success Stories
Contact
Log inLoginSign up
< BACK TO ALL REPORTS

Copper has rarely done this in the past 60 years

Jason Goepfert
2021-02-22
The one-year rolling return for copper futures has neared 50% as the metal keeps climbing, typically a good sign for risk assets.

From Dean...

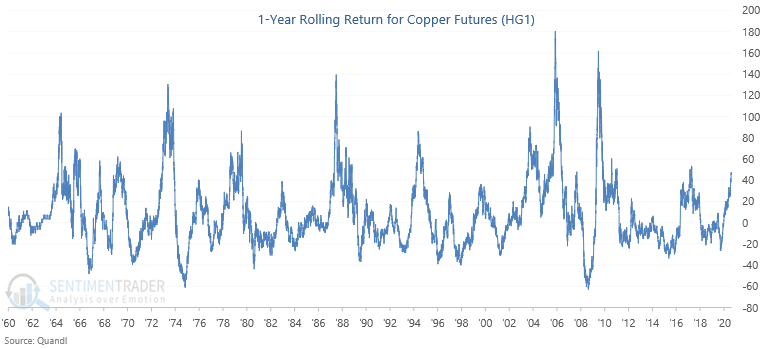
When I turned my quote machine on Thursday morning, it was awash in a sea of flickering red flashes. As I frantically scrolled through page after page searching for something with a green tick, I was relieved to find Dr. Copper up more than 2% and registering a new 52-week high. I immediately went to work to see if I could find an information edge in what many call the commodity with a "Ph.D. in economics."

The rolling return chart is one of my absolute favorite tools for analyzing the big picture of any security. I like to start with the 1-year and zoom out in one-year increments until I reach the five-year. With the 2%+ gain in copper futures on Thursday, the 1-year rolling return crossed above 49%.

There is nothing special about this value. It's just what I noticed on Thursday.

Copper 1 year rolling return

Looking at detailed forward returns for 11 markets and sectors, the economic message from the surge in copper appears to be following the typical post-recovery script, with copper itself having the best tendency to continue higher in the months ahead.

What else we're looking at

  • Detailed returns for all 11 markets and sectors following a surge in copper
  • With all the retail call buying, Gamma Exposure is once again at an extreme level
  • There has been a historic leap in leverage
  • Breadth among gold mining stocks seems to be at a make-or-break level
  • The Stock/Bond Ratio is at an extreme level just as seasonality for both assets hits an interesting point

Stat Box

The jump in copper has preceded a positive 6-month return for semiconductor stocks 91% of the time since 1964, with an average gain of more than 19%.


Sentiment from other perspectives

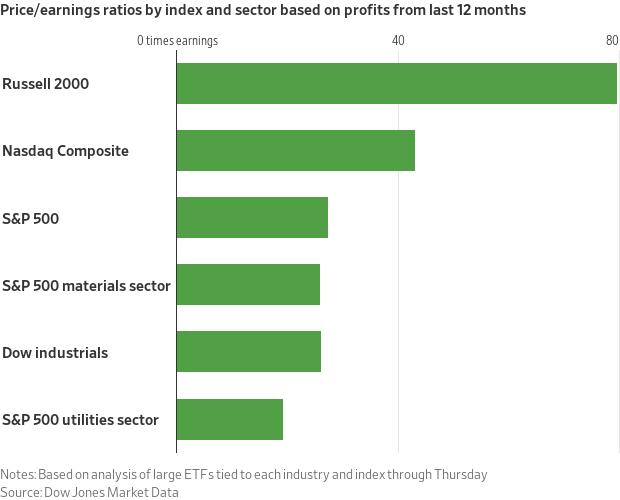
Small stocks are bigly expensive. Thanks to their historic rise in recent months, the valuation of small-cap stocks exceeds other factors and sectors by a factor of 2. Source: Wall Street Journal

small cap russell 2000 price earnings ratio

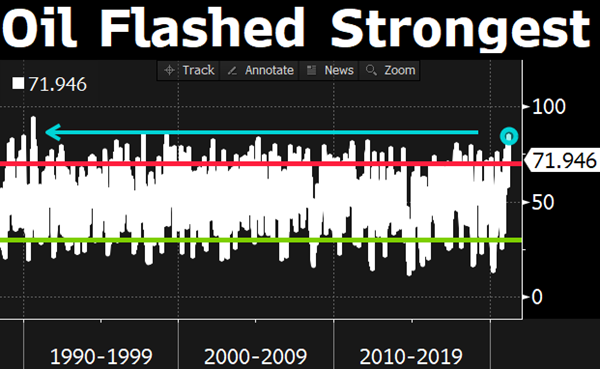
Oil is getting expensive, too. Traders keep pushing energy commodities higher, so much so that the 14-day Relative Strength Index on crude oil just registered its highest reading in 30 years. Source: Bloomberg TV

oil rsi relative strength index

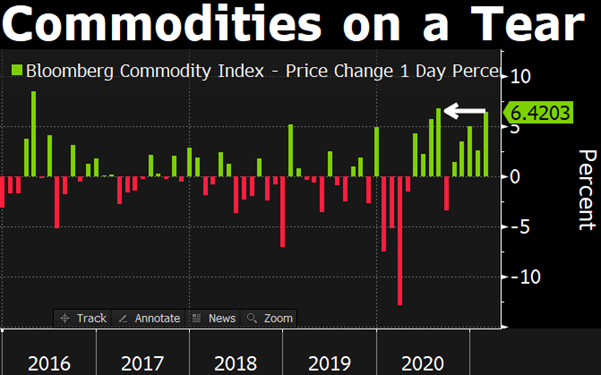
That's helping push commodity indexes higher. The Bloomberg Commodity Index just had one of its best days ever, on top of a string of good days, as sentiment toward commodities swing from "they're the worst asset class in history" to "we're entering a new commodity supercycle." LOL, people never change.  Source: Bloomberg TV

commodity one day change

DATA &
TECHnologies
IndicatorEdge
‍
BackTestEdge
‍
Other Tools
‍
DataEdge API
RESEARCH
reports
Research Solution
‍
Reports Library
‍
actionable
Strategies
Trading Strategies
‍
Smart Stock Scanner
‍
FREE
RESOUrCES
Simple Backtest
Calculator
Simple Seasonality
Calculator
The Kelly Criterion
Calculator
Sentiment Geo Map
‍
Public Research Reports
‍
Free Webinar
COMPANY
‍
About
‍
Meet our Team
‍
In the News
‍
Testimonials
‍
Client Success Stories
Pricing
Bundle pricing
‍
Announcements
‍
FAQ
© 2024 Sundial Capital Research Inc. All rights reserved.
Setsail Marketing
TermsPrivacyAffiliate Program
Risk Disclosure: Futures and forex trading contains substantial risk and is not for every investor. An investor could potentially lose all or more than the initial investment. Risk capital is money that can be lost without jeopardizing ones’ financial security or life style. Only risk capital should be used for trading and only those with sufficient risk capital should consider trading. Past performance is not necessarily indicative of future results.

Hypothetical Performance Disclosure: Hypothetical performance results have many inherent limitations, some of which are described below. No representation is being made that any account will or is likely to achieve profits or losses similar to those shown; in fact, there are frequently sharp differences between hypothetical performance results and the actual results subsequently achieved by any particular trading program. One of the limitations of hypothetical performance results is that they are generally prepared with the benefit of hindsight. In addition, hypothetical trading does not involve financial risk, and no hypothetical trading record can completely account for the impact of financial risk of actual trading. for example, the ability to withstand losses or to adhere to a particular trading program in spite of trading losses are material points which can also adversely affect actual trading results. There are numerous other factors related to the markets in general or to the implementation of any specific trading program which cannot be fully accounted for in the preparation of hypothetical performance results and all which can adversely affect trading results.

Testimonial Disclosure: Testimonials appearing on this website may not be representative of other clients or customers and is not a guarantee of future performance or success.