
Consumer staples trigger a new relative strength index buy signal

Key points:
- The Relative Strength Index (RSI) for the consumer staples sector crossed above 70 on Thursday
- A trading model that uses the RSI indicator triggered a new buy signal
- The consumer staples sector has rallied 77% of the time after other signals
The Relative Strength Index (RSI) indicator
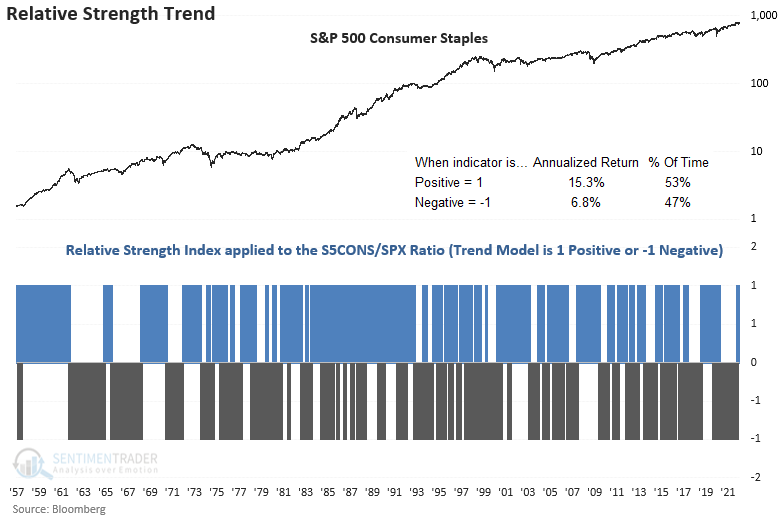
The relative strength index (RSI), developed by J. Welles Wilder Jr., measures price momentum for stocks, indexes, or other assets. However, one can apply the indicator to almost any type of time series. I like to use the RSI indicator on the ratio between two securities to identify relative strength trends. When the RSI ratio exceeds 70, the relative momentum trend is positive. Conversely, the relative momentum trend is negative when the RSI ratio falls below 30. I view an overbought signal as a positive development, which runs counter to conventional wisdom amongst most traders. i.e., positive momentum begets more positive momentum.
The Relative Strength Index (RSI) ratio trend for the consumer staples sector
My RSI ratio trend model reversed from negative to positive on 1/20/22 when the RSI ratio crossed above 70. Favorable RSI ratio trend conditions show significantly higher annualized returns for the consumer staples sector, with a return of 15.3%. In contrast, when the RSI ratio trend is negative, the sector annualizes at 6.8%.
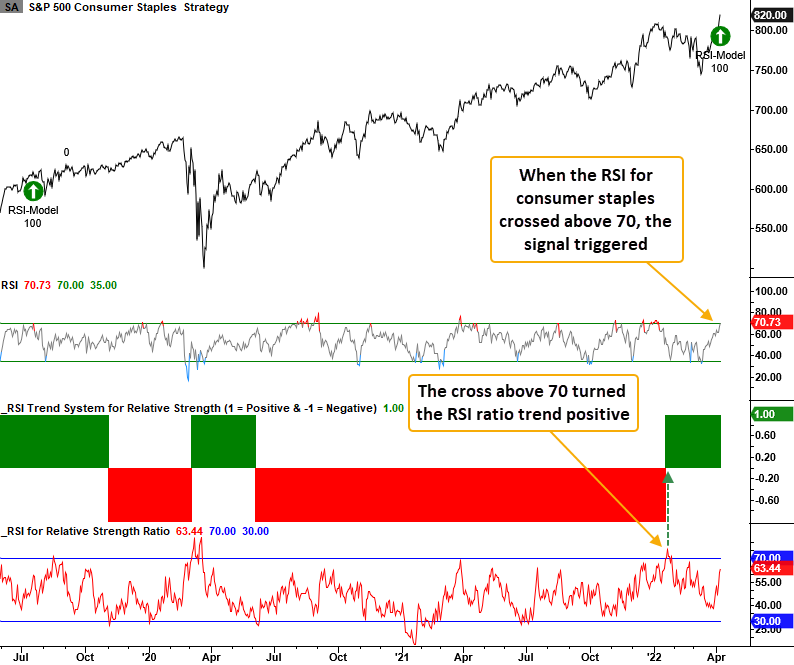
How the trading model works
The RSI trading model is simple. When the RSI ratio trend is positive, the model generates a new buy signal when the RSI indicator for the underlying stock or ETF crosses above 70. At the same time, the 5-day rate of change must be positive. I use a reset to screen out duplicate signals by requiring the RSI to fall below a user-defined level before a new alert can trigger again. The RSI condition ensures that we buy solid absolute and relative trends. I want to avoid buying the best house in a lousy neighborhood. i.e., relative winners in protracted downtrends.
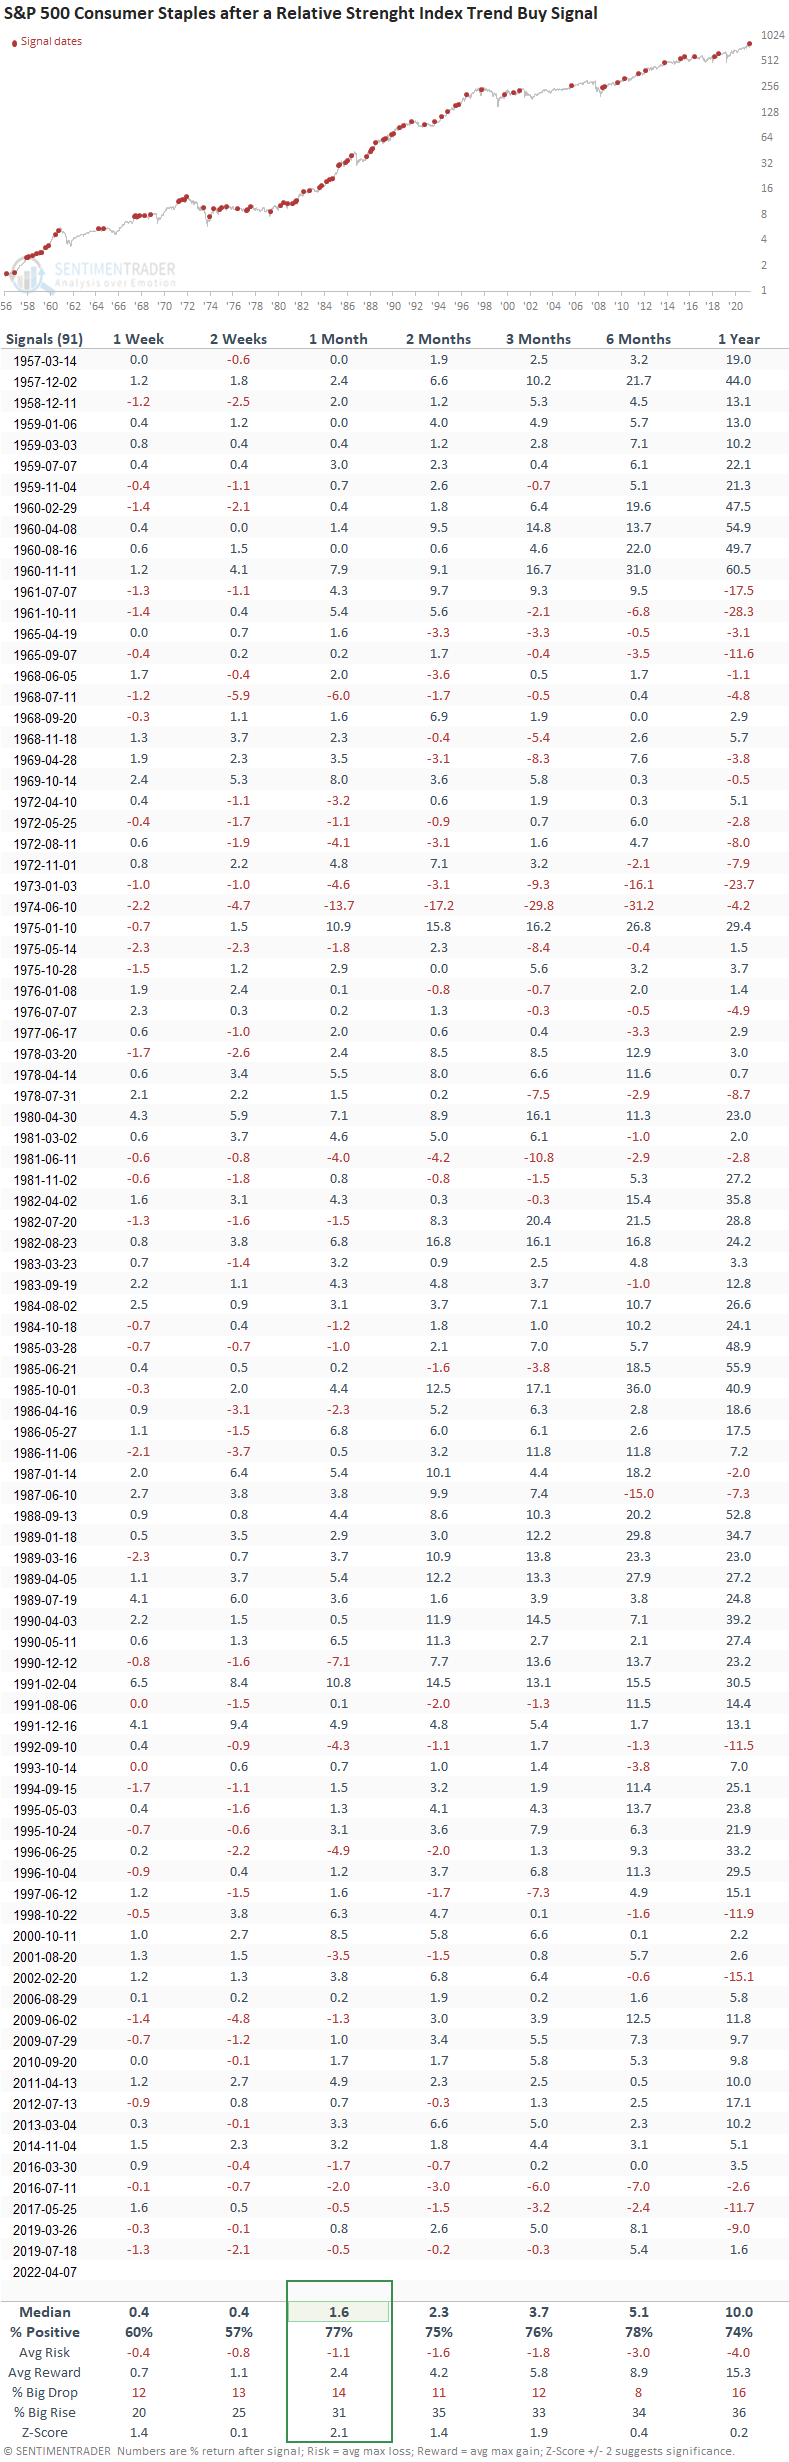
Similar relative strength signals have preceded gains 77% of the time
This model generated a signal 91 other times over the past 65 years. After the others, consumer staples' future returns, win rates, and risk/reward profiles were solid across all time frames, especially the 1-month window. Since 1974, the model shows one drawdown of greater than 5% in the 1-month time frame. That signal occurred in 1990.
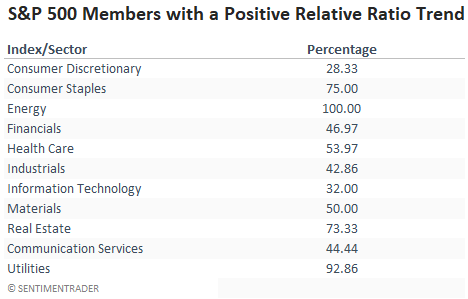
The consumer staples sector shows solid participation trends
When I count the number of members with a positive relative ratio trend, the consumer staples sector shows solid participation, with 75% of the components in a favorable position. We can't say the same for the discretionary and technology sectors.
What the research tells us...
When my RSI ratio trend model is positive and the RSI indicator crosses above 70, absolute and relative price momentum begets more momentum. Similar setups to what we're seeing now have preceded rising prices for the consumer staples sector, especially on a 1-month basis. Consumer staples are a defensive sector. So, if one is concerned about another downswing in the stock market due to a potential growth scare, the staples look favorable.