Data &
Technology
Research
Reports
Report Solutions
Reports Library
Actionable
Strategies
Free
Resources
Simple Backtest Calculator
Simple Seasonality Calculator
The Kelly Criterion Calculator
Sentiment Geo Map
Public Research Reports
Free Webinar
Pricing
Company
About
Meet Our Team
In the News
Testimonials
Client Success Stories
Contact
Log inLoginSign up
< BACK TO ALL REPORTS

Consumer sentiment drop favors Small Caps and Value

Jason Goepfert
2021-11-17
The latest University of Michigan survey of consumer sentiment showed a shocking drop, falling below 70 for the first time since 2012. Other bouts of pessimism led to the best performance in Small-Cap and Value stocks.

Key points:

  • A major survey of U.S. consumer confidence showed a shocking decline this month
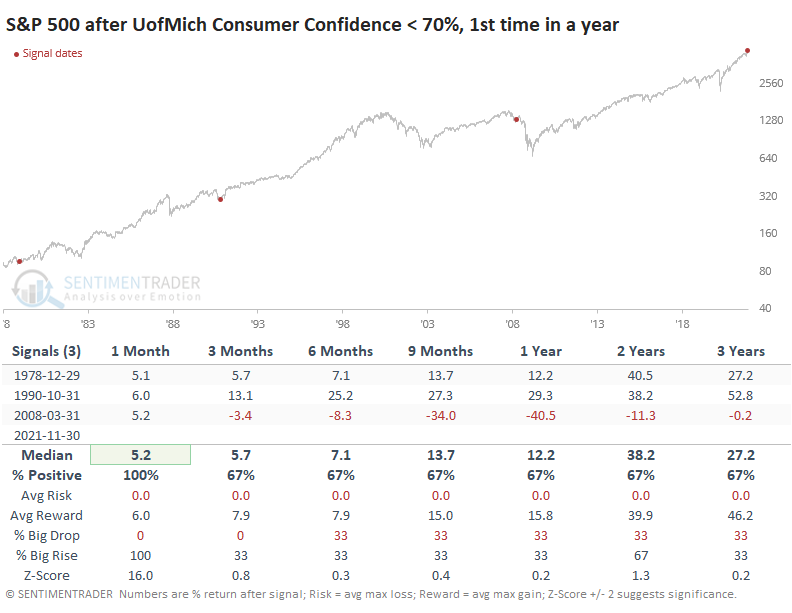
  • Other times it dropped to this low of a level, stocks soared twice, crashed once
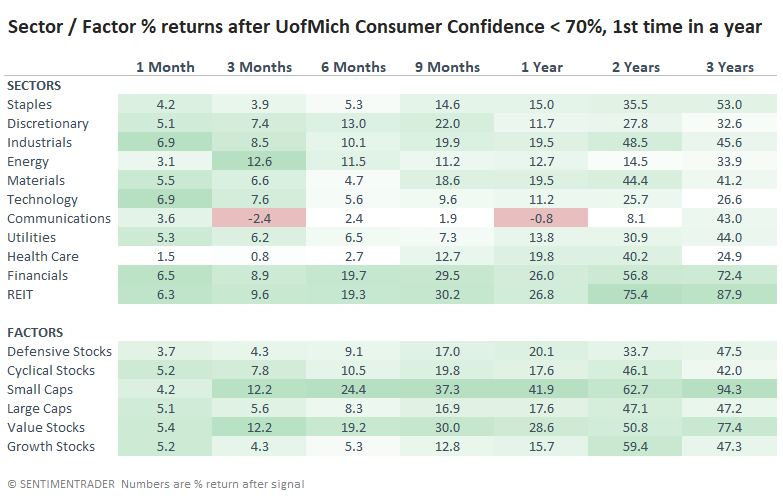
  • Among sectors and factors, Small-Cap and Value stocks fared best

First real pessimism in almost a decade

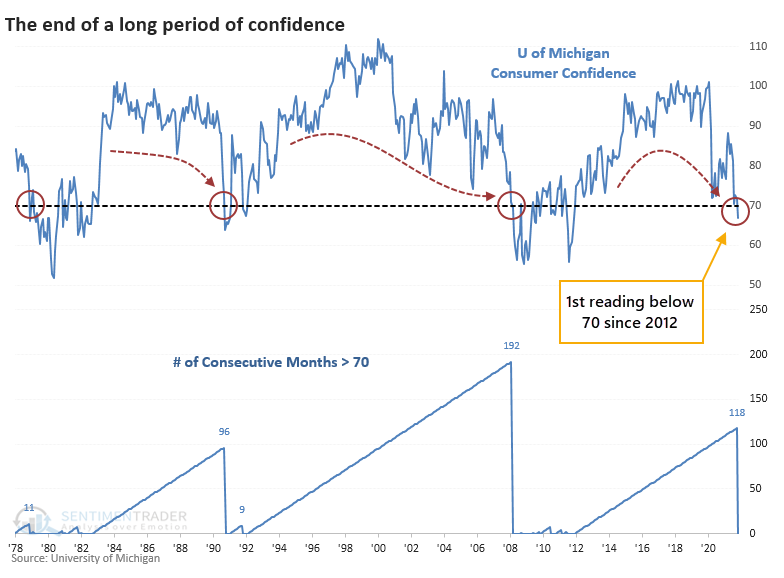
The latest survey results from the University of Michigan shocked economists.

For the first time since 2012, the overall level of consumer confidence was below 70, well below even the most negative economist on Wall Street. If it holds up, it would be the worst miss versus expectations in 22 years.

This ended the 2nd-longest stretch of readings above 70 since 1978, assuming the figures don't change appreciably when they are finalized at the end of the month.

We all know the difficulty of relying on a sample size of 3, so the caveats are huge. It doesn't help that there was no real consensus on future market returns after the other instances, with a couple of big gains and one big loss. The 1978 and 1990 drops in sentiment preceded gains of more than 35% in the S&P 500 over the next couple of years. The 2008 signal was near the beginning of the Global Financial Crisis (GFC) and major losses.

Bonds rose, along with Small-Caps and Value

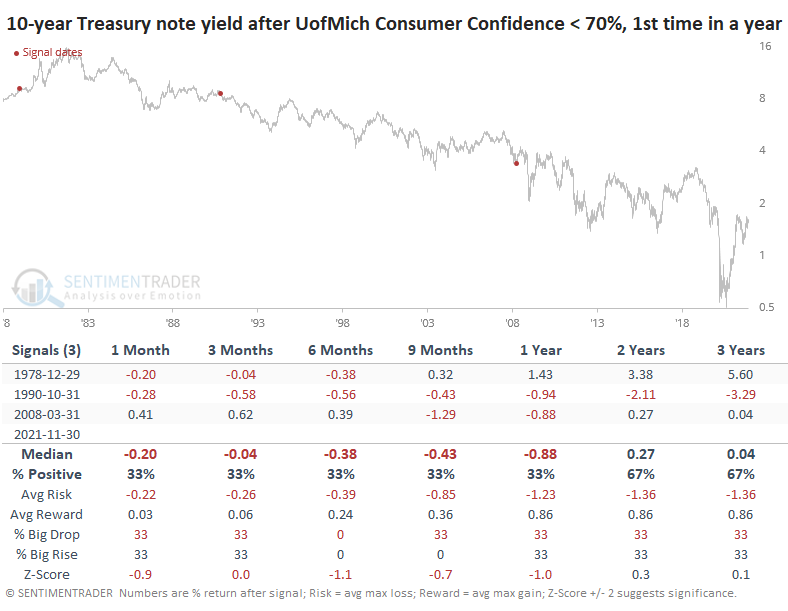
For Treasury yields, these drops in sentiment were also mixed but at least we could note that yields were negative sometime between 6-12 months later each time, so some consistency there. The returns in the table below are in basis points.

Among sectors and factors, the bear market of 2008 knocked everything for a loop. The strongest returns (darkest green shading) favored Small-Cap and Value stocks across most time frames.

What the research tells us...

There is sometimes a big difference between investors and consumers. We're seeing that now, with extreme optimism among the former and apathy or even pessimism among the latter. Much of this is based on politics and inflationary pressures and less on direct economic prospects. The tiny sample size and inconsistent results make this a tough one to rely on, but it's perhaps a modest point favoring Small-Cap and Value shares.

Sorry, you don't have access to this report

Upgrade your subscription plan to get access
Go to Dasboard
DATA &
TECHnologies
IndicatorEdge
‍
BackTestEdge
‍
Other Tools
‍
DataEdge API
RESEARCH
reports
Research Solution
‍
Reports Library
‍
actionable
Strategies
Trading Strategies
‍
Smart Stock Scanner
‍
FREE
RESOUrCES
Simple Backtest
Calculator
Simple Seasonality
Calculator
The Kelly Criterion
Calculator
Sentiment Geo Map
‍
Public Research Reports
‍
Free Webinar
COMPANY
‍
About
‍
Meet our Team
‍
In the News
‍
Testimonials
‍
Client Success Stories
Pricing
Bundle pricing
‍
Announcements
‍
FAQ
© 2024 Sundial Capital Research Inc. All rights reserved.
Setsail Marketing
TermsPrivacyAffiliate Program
Risk Disclosure: Futures and forex trading contains substantial risk and is not for every investor. An investor could potentially lose all or more than the initial investment. Risk capital is money that can be lost without jeopardizing ones’ financial security or life style. Only risk capital should be used for trading and only those with sufficient risk capital should consider trading. Past performance is not necessarily indicative of future results.

Hypothetical Performance Disclosure: Hypothetical performance results have many inherent limitations, some of which are described below. No representation is being made that any account will or is likely to achieve profits or losses similar to those shown; in fact, there are frequently sharp differences between hypothetical performance results and the actual results subsequently achieved by any particular trading program. One of the limitations of hypothetical performance results is that they are generally prepared with the benefit of hindsight. In addition, hypothetical trading does not involve financial risk, and no hypothetical trading record can completely account for the impact of financial risk of actual trading. for example, the ability to withstand losses or to adhere to a particular trading program in spite of trading losses are material points which can also adversely affect actual trading results. There are numerous other factors related to the markets in general or to the implementation of any specific trading program which cannot be fully accounted for in the preparation of hypothetical performance results and all which can adversely affect trading results.

Testimonial Disclosure: Testimonials appearing on this website may not be representative of other clients or customers and is not a guarantee of future performance or success.