Data &
Technology
Research
Reports
Report Solutions
Reports Library
Actionable
Strategies
Free
Resources
Simple Backtest Calculator
Simple Seasonality Calculator
The Kelly Criterion Calculator
Sentiment Geo Map
Public Research Reports
Free Webinar
Pricing
Company
About
Meet Our Team
In the News
Testimonials
Client Success Stories
Contact
Log inLoginSign up
< BACK TO ALL REPORTS

Consumer Discretionary vs. Consumer Staples Relative Ratio

Dean Christians
2021-06-10
Let's review the relative ratio indicator between the consumer discretionary and consumer staples sectors to assess if the relationship can identify a risk-off environment.

Market participants often reference the consumer discretionary versus consumer staples relative ratio indicator as a relationship that one should monitor to assess the current market outlook. The premise is that when the things that we want are outperforming the things that we need, the market and the economy are in good shape, and when the things that we need are outperforming, the opposite is true. 

Unfortunately, when market participants mention the relative ratio indicator in a chart or note, one rarely sees a systematic approach to determine whether the method is valid for assessing the broad market outlook.

Given the deterioration in the relative ratio indicator on an equal and cap-weighted basis of late, let's assess if we can create a valid risk-off signal for the broad market.

The following optimization process was conducted as a short signal on the S&P 500 Index.

COMPONENTS

  • S&P 500 equal-weight consumer discretionary sector
  • S&P 500 equal-weight consumer staples sector

The equal-weight sectors are utilized in the analysis to avoid any cap-weighted bias and assess a more true relationship between the two groups.

RELATIVE RATIO METHODOLOGY

A range rank calculation was applied to the relative ratio indicator to assess how the current ratio level compared all other values over the previous N days. The range rank methodology allows us to test threshold levels between 0 and 100% for signals in an optimization process.

OPTIMIZATION PROCESS

  1. Optimized range rank between 63 and 105 days using an increment increase of 21 days. i.e., I assessed a lookback range of 3 to 5 months
  2. Optimized when the range rank indicator crossed below a threshold level between 20% and 60% using a 1% increment
  3. Optimized days-in-trade exit

STATIC OPTIMIZATION PARAMETERS

  1. A reset condition of 90% and 5% were applied to optimization to identify the first cross below the optimized threshold level. i.e., I wanted the relative ratio range indicator to be falling from a high level. The 5% reset condition seeks to avoid signals whereby the range had dropped to a low level and subsequently rose and then had a cross below the threshold level. 
  2. S&P 500 Index must be within 3% of 252-Day High

THE OPTIMIZATION PROCESS RETURNED THE FOLLOWING PARAMETERS

  1. Range Rank = 105 Days
  2. Risk-off Threshold Level = 20%
  3. Days-In-Trade Exit = 30
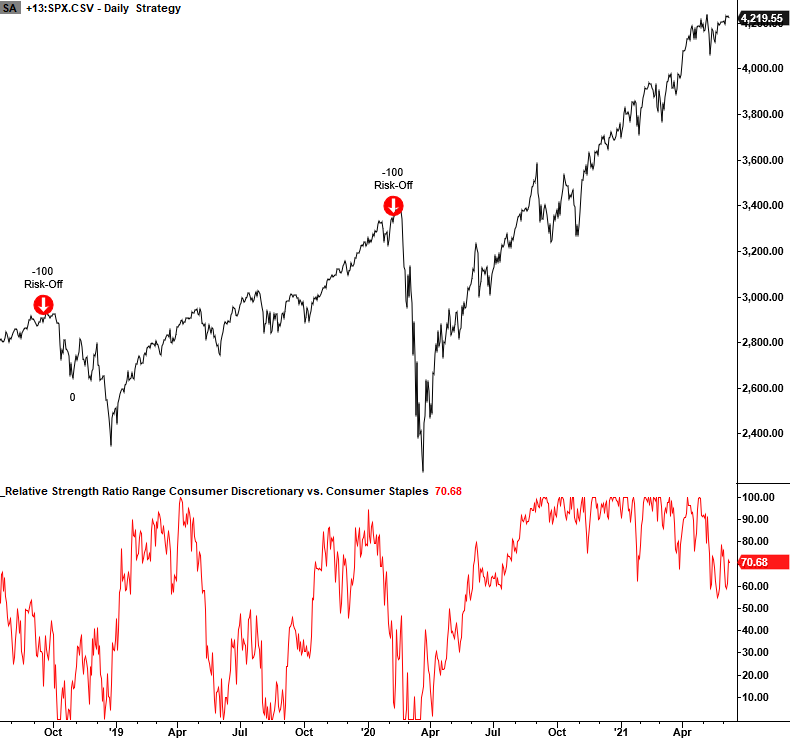
CURRENT DAY CHART 

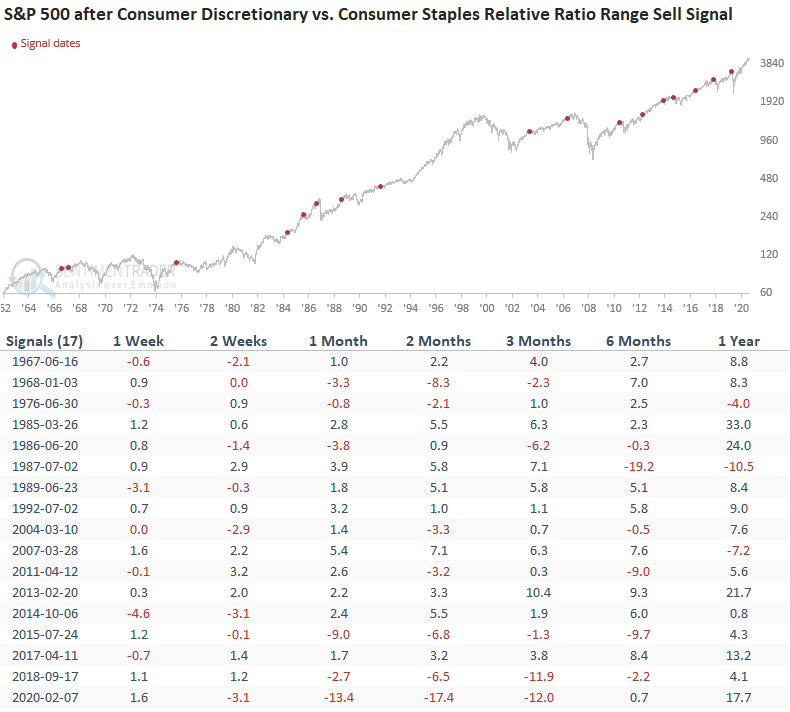
The signals on the current day chart would suggest a valid methodology. Let's review performance for all instances.

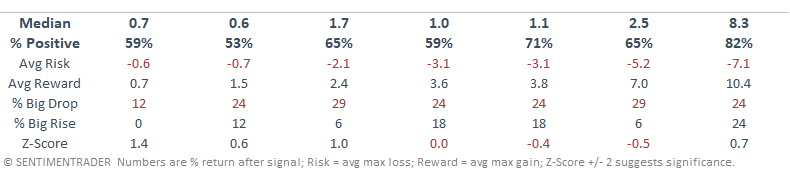
HOW THE SIGNALS PERFORMED 

The signal performance suggests that the relative ratio relationship is not a robust methodology for identifying broad market risk-off signals. 

Conventional wisdom isn't always what it seems.

Note Edit: The optimization process is based on a short signal, whereas the table below indicates a purchase of the S&P 500.

Sorry, you don't have access to this report

Upgrade your subscription plan to get access
Go to Dasboard
DATA &
TECHnologies
IndicatorEdge
‍
BackTestEdge
‍
Other Tools
‍
DataEdge API
RESEARCH
reports
Research Solution
‍
Reports Library
‍
actionable
Strategies
Trading Strategies
‍
Smart Stock Scanner
‍
FREE
RESOUrCES
Simple Backtest
Calculator
Simple Seasonality
Calculator
The Kelly Criterion
Calculator
Sentiment Geo Map
‍
Public Research Reports
‍
Free Webinar
COMPANY
‍
About
‍
Meet our Team
‍
In the News
‍
Testimonials
‍
Client Success Stories
Pricing
Bundle pricing
‍
Announcements
‍
FAQ
© 2024 Sundial Capital Research Inc. All rights reserved.
Setsail Marketing
TermsPrivacyAffiliate Program
Risk Disclosure: Futures and forex trading contains substantial risk and is not for every investor. An investor could potentially lose all or more than the initial investment. Risk capital is money that can be lost without jeopardizing ones’ financial security or life style. Only risk capital should be used for trading and only those with sufficient risk capital should consider trading. Past performance is not necessarily indicative of future results.

Hypothetical Performance Disclosure: Hypothetical performance results have many inherent limitations, some of which are described below. No representation is being made that any account will or is likely to achieve profits or losses similar to those shown; in fact, there are frequently sharp differences between hypothetical performance results and the actual results subsequently achieved by any particular trading program. One of the limitations of hypothetical performance results is that they are generally prepared with the benefit of hindsight. In addition, hypothetical trading does not involve financial risk, and no hypothetical trading record can completely account for the impact of financial risk of actual trading. for example, the ability to withstand losses or to adhere to a particular trading program in spite of trading losses are material points which can also adversely affect actual trading results. There are numerous other factors related to the markets in general or to the implementation of any specific trading program which cannot be fully accounted for in the preparation of hypothetical performance results and all which can adversely affect trading results.

Testimonial Disclosure: Testimonials appearing on this website may not be representative of other clients or customers and is not a guarantee of future performance or success.