Data &
Technology
Research
Reports
Report Solutions
Reports Library
Actionable
Strategies
Free
Resources
Simple Backtest Calculator
Simple Seasonality Calculator
The Kelly Criterion Calculator
Sentiment Geo Map
Public Research Reports
Free Webinar
Pricing
Company
About
Meet Our Team
In the News
Testimonials
Client Success Stories
Contact
Log inLoginSign up
< BACK TO ALL REPORTS

Confidence returns to pre-crisis levels

Jason Goepfert
2020-06-16
From a record low reading in March, Dumb Money Confidence has returned to extreme optimism. When Confidence cycles like this, it has typically preceded sketchy shorter-term returns, and other warning signs triggered when Confidence went from one extreme to the other in very short periods of time.

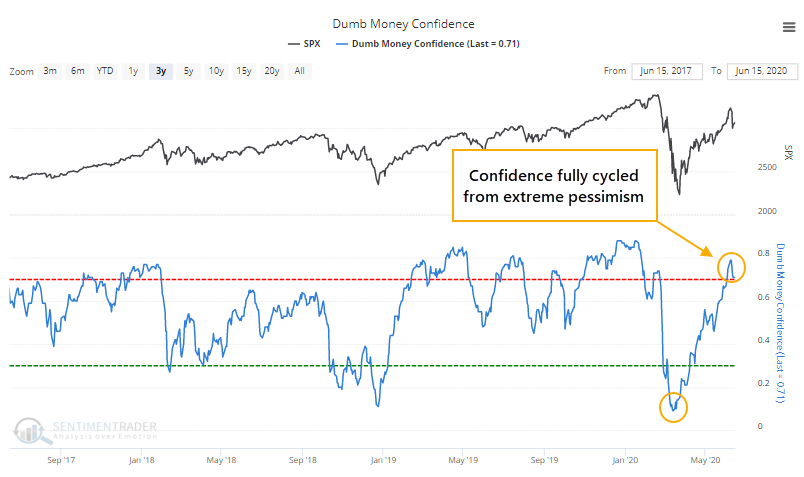
Along with prices, confidence has stormed back from the depths of pessimism, especially among those who have a tendency to be most bearish near price lows and most bullish near price highs. From a record low reading in March, sentiment has cycled well into extreme optimism, where it has since settled a bit.

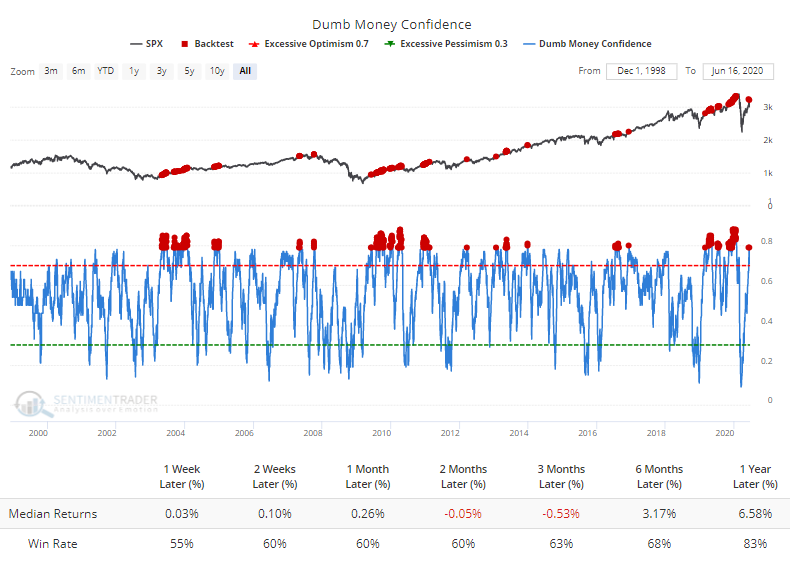
When Dumb Money Confidence has been 79% or above since 1999, the S&P 500's returns in the months ahead have tended to be subdued. Even though median returns were negative over the next 2-3 months, the S&P was still positive most of the time, thanks mostly to the initial readings following the 2002 and 2008 bear markets.

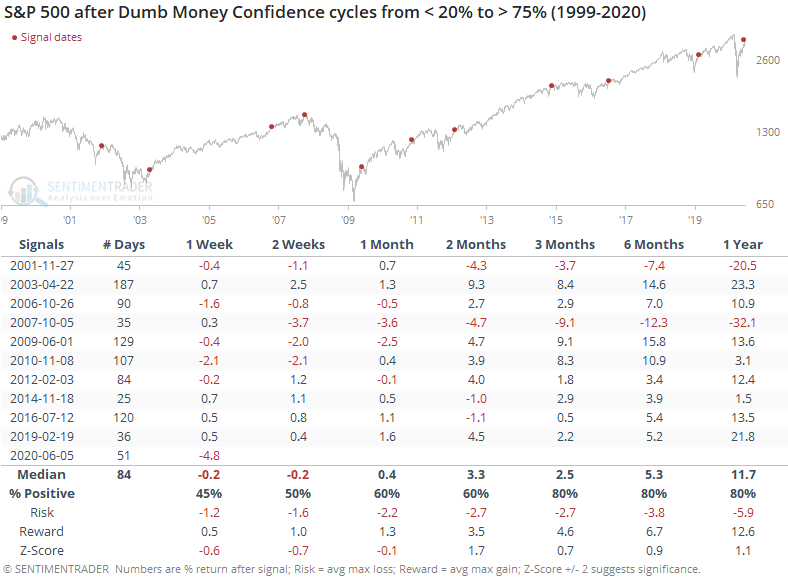
When Confidence goes from deep pessimism to high optimism, negative returns had a stronger tendency to be focused on the shorter-term. On average, it took 84 trading days for Confidence to go from below 20% to above 75%. This time, it took only 51 sessions.

That was evident this time, with a 6% drawdown in the week after Dumb Money Confidence first surged above 75%. That's larger than every other signal's drawdown even up to a month later.

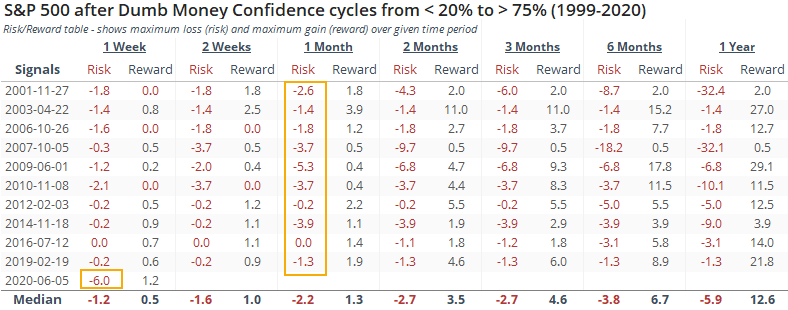
It's hard to know whether this is a good thing (the selling pressure has already been alleviated) or a bad thing (this signal is different from all the others). In a very general sense, when we see behavior like this, it's usually the former as opposed to the latter.

One concern is just how fast Confidence returned. There have been only a handful of times when it made a round trip from pessimism to optimism within three months.

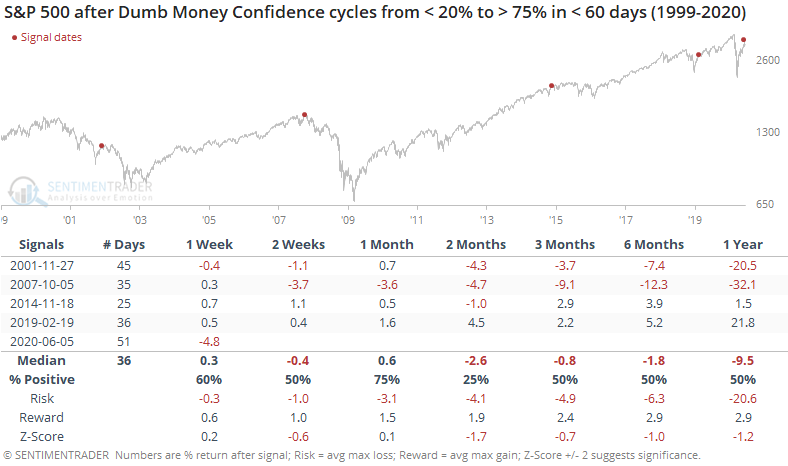
After these, prices ultimately gave back any further gains. It happened immediately after signals in 2001 and 2007, but took a long while after the ones in 2014 and 2019.

The most compelling aspects about stocks since late March, and which have continued recently, are the breadth thrusts and recoveries have an almost unblemished record at preceding higher prices over a 6-12 month time frame. Shorter-term, there have been an increasing number of warning signs, and we'd rate the return of Dumb Money Confidence among them.

Sorry, you don't have access to this report

Upgrade your subscription plan to get access
Go to Dasboard
DATA &
TECHnologies
IndicatorEdge
‍
BackTestEdge
‍
Other Tools
‍
DataEdge API
RESEARCH
reports
Research Solution
‍
Reports Library
‍
actionable
Strategies
Trading Strategies
‍
Smart Stock Scanner
‍
FREE
RESOUrCES
Simple Backtest
Calculator
Simple Seasonality
Calculator
The Kelly Criterion
Calculator
Sentiment Geo Map
‍
Public Research Reports
‍
Free Webinar
COMPANY
‍
About
‍
Meet our Team
‍
In the News
‍
Testimonials
‍
Client Success Stories
Pricing
Bundle pricing
‍
Announcements
‍
FAQ
© 2024 Sundial Capital Research Inc. All rights reserved.
Setsail Marketing
TermsPrivacyAffiliate Program
Risk Disclosure: Futures and forex trading contains substantial risk and is not for every investor. An investor could potentially lose all or more than the initial investment. Risk capital is money that can be lost without jeopardizing ones’ financial security or life style. Only risk capital should be used for trading and only those with sufficient risk capital should consider trading. Past performance is not necessarily indicative of future results.

Hypothetical Performance Disclosure: Hypothetical performance results have many inherent limitations, some of which are described below. No representation is being made that any account will or is likely to achieve profits or losses similar to those shown; in fact, there are frequently sharp differences between hypothetical performance results and the actual results subsequently achieved by any particular trading program. One of the limitations of hypothetical performance results is that they are generally prepared with the benefit of hindsight. In addition, hypothetical trading does not involve financial risk, and no hypothetical trading record can completely account for the impact of financial risk of actual trading. for example, the ability to withstand losses or to adhere to a particular trading program in spite of trading losses are material points which can also adversely affect actual trading results. There are numerous other factors related to the markets in general or to the implementation of any specific trading program which cannot be fully accounted for in the preparation of hypothetical performance results and all which can adversely affect trading results.

Testimonial Disclosure: Testimonials appearing on this website may not be representative of other clients or customers and is not a guarantee of future performance or success.