
Composite Trend Model Concept

In my Monday morning updates, I share an absolute and relative trend score for domestic and foreign ETFs based on a composite model that uses several classic trend-following indicators. The model contains ten algorithms, which means the scoring system will range from 10 (best) to -10 (worst).
I like composite models because they provide a weight-of-the-evidence approach that one cannot find in a single indicator. Diversification is a term that is often associated with portfolio construction. However, it's also an essential aspect in the creation of composite models. By varying the input length of our indicators, we can create a more diverse model that avoids short-term whipsaw signals and is more timely than other long-duration methodologies.
Today's note aims to share how I use the absolute composite trend model to identify a bearish to a bullish reversal in trend for the S&P 500 index. The trend reversal signal is a component in the TCTM Composite Confirmation Model.
COMPOSITE TREND MODEL COUNT PARAMETERS
The Composite Trend Model component for the TCTM Composite Confirmation Model uses monthly data even though the CCM is a daily calculation. I prefer to use monthly data for the trend model to avoid the noise associated with daily data.
- if close > 3-month moving average = +1
- if close > 6-month moving average = +1
- if close > 12-month moving average = +1
- if 3-month moving average > 3-month moving average 1-month prior = +1 i.e., is the average increasing on a m/m basis.
- if 6-month moving average > 6-month moving average 1-month prior = +1
- if 12-month moving average > 12-month moving average 1-month prior = +1
- if 3-month moving average > 12-month moving average = +1
- if 6-month moving average > 12-month moving average = +1
- if 3-month Fastk stochastic > 70 = +1
- If close > highest 6-month close = +1 i.e., a 6-month breakout that remains in effect until the index registers a 6-month low.
- if close < 3-month moving average = -1
- if close < 6-month moving average = -1
- if close < 12-month moving average = -1
- if 3-month moving average < 3-month moving average 1-month prior = -1 i.e., is the average decreasing on a m/m basis.
- if 6-month moving average < 6-month moving average 1-month prior = -1
- if 12-month moving average < 12-month moving average 1-month prior = -1
- if 3-month moving average < 12-month moving average = -1
- if 6-month moving average < 12-month moving average = -1
- if 3-month Fastk stochastic < 30 = -1
- If close < Lowest 6-month close = -1 i.e., a 6-month breakdown that remains in effect until the index registers a 6-month high.
COMPOSITE TREND MODEL SIGNAL
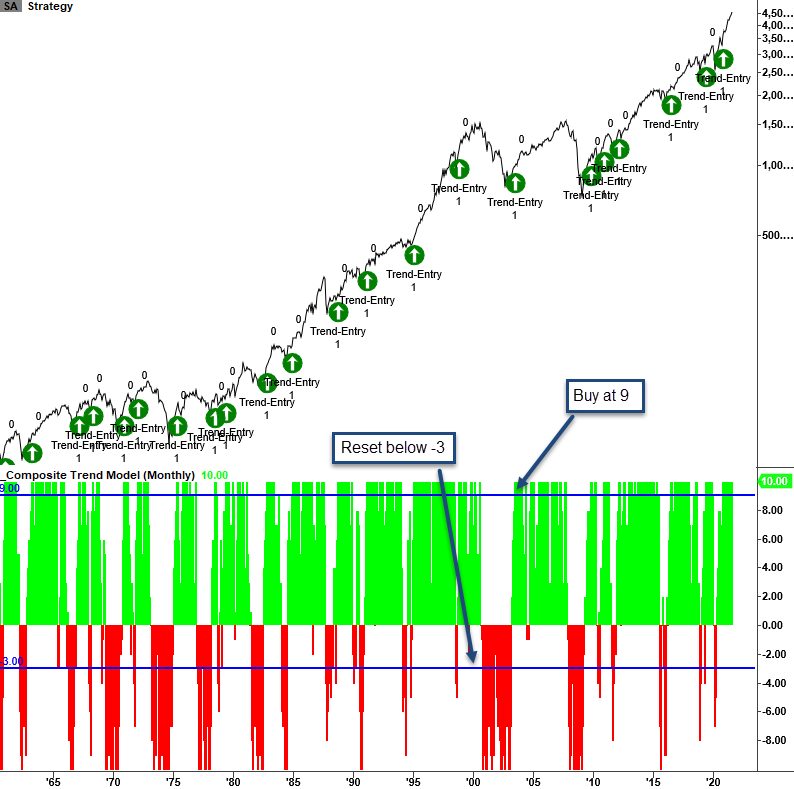
The composite signal is simple. When the composite score crosses below -3, an oversold reset condition turns active. Once the oversold reset condition is confirmed, the system will issue a bullish alert for the S&P 500 index when the composite score reaches a level of 9 or higher.
CURRENT DAY CHART
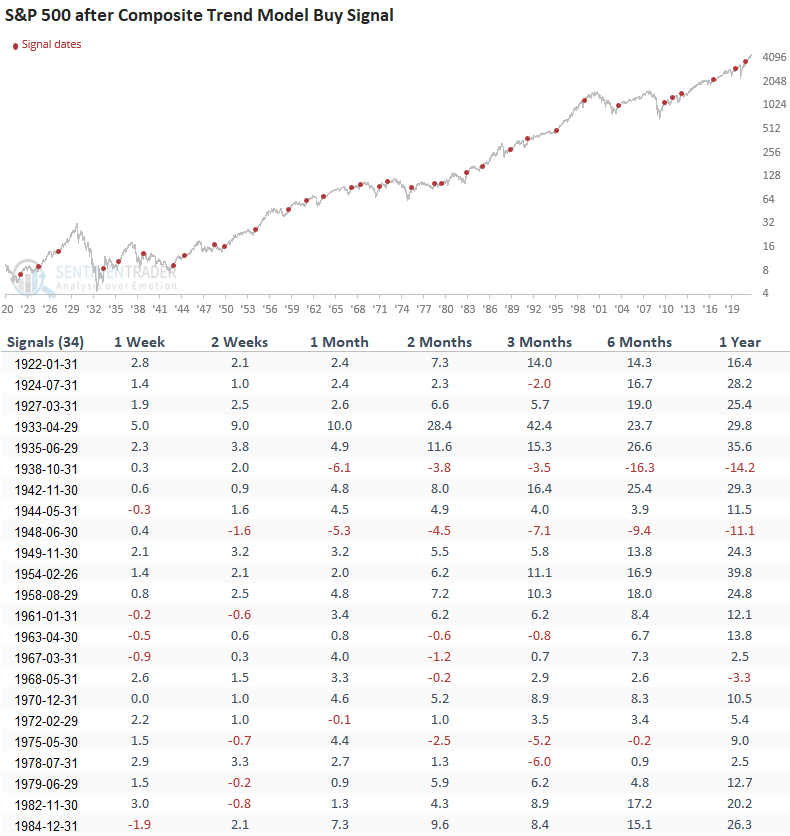
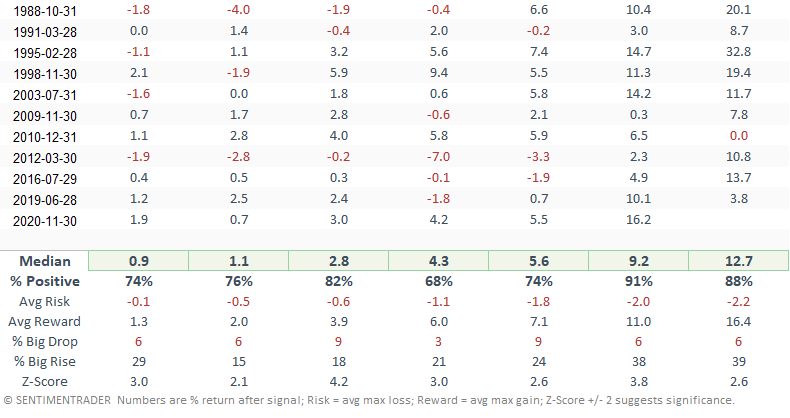
HOW THE SIGNALS PERFORMED
Results look excellent, with several notable z-scores. Even though the signal uses monthly data, I assess performance with daily data. I also extended the daily S&P 500 index by using the daily returns from the Dow Jones Industrial Average.
Please see below if you were wondering about the duration input lengths that I use for the daily absolute and relative trend score composites found in my Monday updates.
COMPOSITE TREND MODEL COUNT - DAILY DATA
- if close > 50-day moving average = +1
- if close > 100-day moving average = +1
- if close > 200-day moving average = +1
- if 50-day moving average > 50-day moving average 1-day prior = +1
- if 100-day moving average > 100-day moving average 1-day prior = +1
- if 200-day moving average > 200-day moving average 1-day prior = +1
- if 50-day moving average > 200-day moving average = +1
- if 100-day moving average > 200-day moving average = +1
- if 49-day Fastk stochastic > 70 = +1
- If close > highest 126-day close = +1
- if close < 50-day moving average = -1
- if close < 100-day moving average = -1
- if close < 200-day moving average = -1
- if 50-day moving average < 50-day moving average 1-day prior = -1
- if 100-day moving average < 100-day moving average 1-day prior = -1
- if 200-day moving average < 200-day moving average 1-day prior = -1
- if 50-day moving average < 200-day moving average = -1
- if 100-day moving average < 200-day moving average = -1
- if 49-day Fastk stochastic < 30 = -1
- If close < Lowest 126-day close = -1