Composite Breadth Indicator Buy Signal Concept

I've shared my composite breadth indicator in several Market Breadth Composite Rank Update notes this year. The composite assesses the market's internal condition across a diverse set of indicator duration measurements to see if the troops are participating or if a handful of generals are driving index performance.
Today's note aims to share a concept that identifies when the composite breadth indicator undergoes a bearish to a bullish reversal in participation.
COMPOSITE BREADTH INDICATOR COMPONENTS
- Percentage of issues above the 10-day moving average
- Percentage of issues above the 50-day moving average
- Percentage of issues above the 200-day moving average
- Percentage Spread Between 21-Day Highs and Lows
- Percentage Spread Between 63-Day Highs and Lows
- Percentage Spread Between 252-Day Highs and Lows
THE CONCEPT
The composite breadth signal identifies when the N-day net change in the composite breadth indicator surges above a user-defined threshold level. The model will issue an alert based upon the following conditions.
SIGNAL CRITERIA FOR THE S&P 500
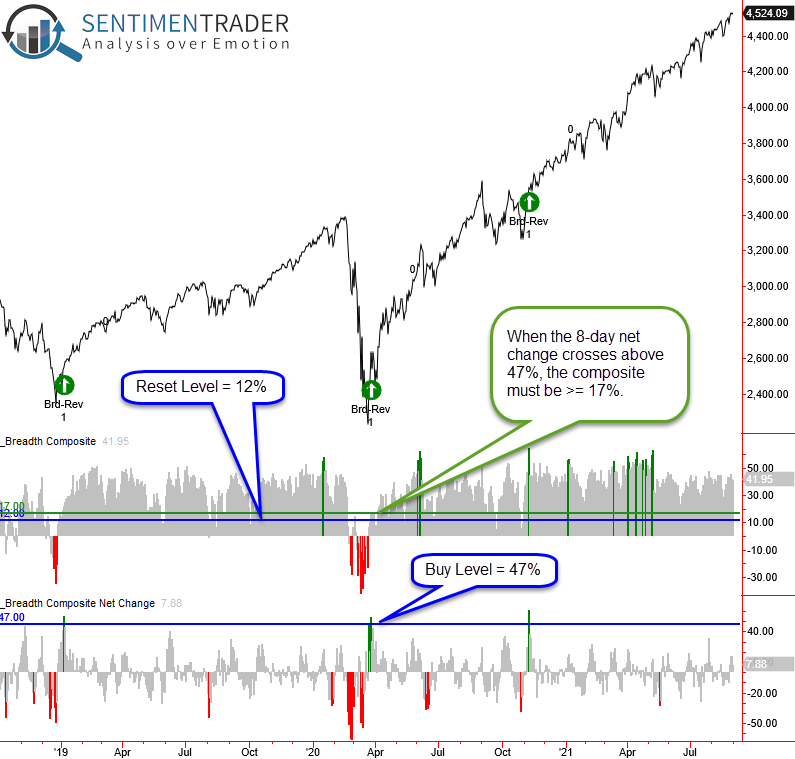
- If the composite breadth indicator crosses below 12%, then the reset condition is active.
- If the reset condition is confirmed and the 8-day net change in the composite breadth indicator crosses above 47%, and the composite breadth indicator is greater than 17%, then buy.
CURRENT DAY CHART
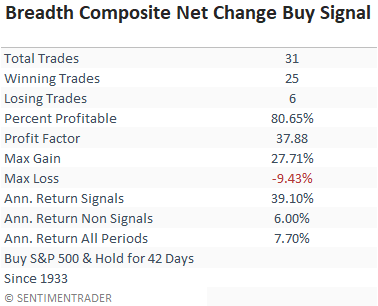
TRADING STATISTICS
The trading statistics in the table below reflect the optimal days-in-trade holding period of 42 days. When I run optimizations for trading signals, I cap the max number of days at 42.
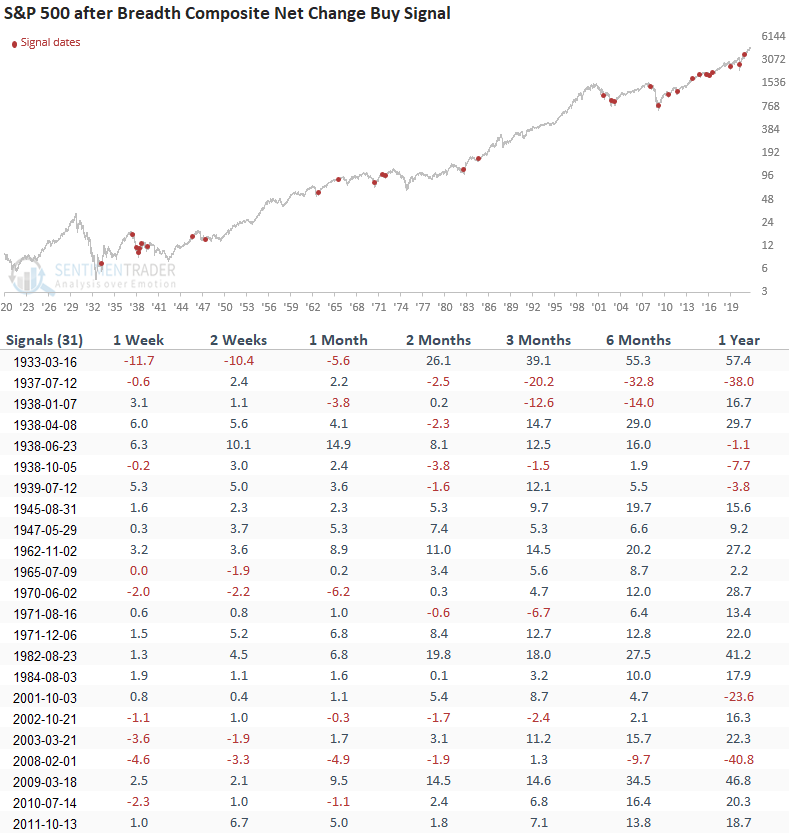
HOW THE SIGNALS PERFORMED
Results look excellent with a solid risk/reward profile in 6/7 timeframes.
The sample size is small because the signal requirements have a high hurdle rate. Therefore, I use the model in conjunction with other signals in a weight-of-the-evidence approach.