Data &
Technology
Research
Reports
Report Solutions
Reports Library
Actionable
Strategies
Free
Resources
Simple Backtest Calculator
Simple Seasonality Calculator
The Kelly Criterion Calculator
Sentiment Geo Map
Public Research Reports
Free Webinar
Pricing
Company
About
Meet Our Team
In the News
Testimonials
Client Success Stories
Contact
Log inLoginSign up
< BACK TO ALL REPORTS

Companies pull back on buybacks while issuing more shares

Jason Goepfert
2020-08-04
In recent months, companies have pulled back drastically on buying back their own shares. At the same time, they've been adding to supply by issuing new shares either through IPOs or secondary and add-on offerings. This is one of the most drastic changes in supply in 20 years.

The rally in stocks during the spring combined with a thirst for liquidity drove many companies to issue new shares to the public, where they had a ready audience. At the same time, they pulled back on some unnecessary expenses, like buying back their own shares.

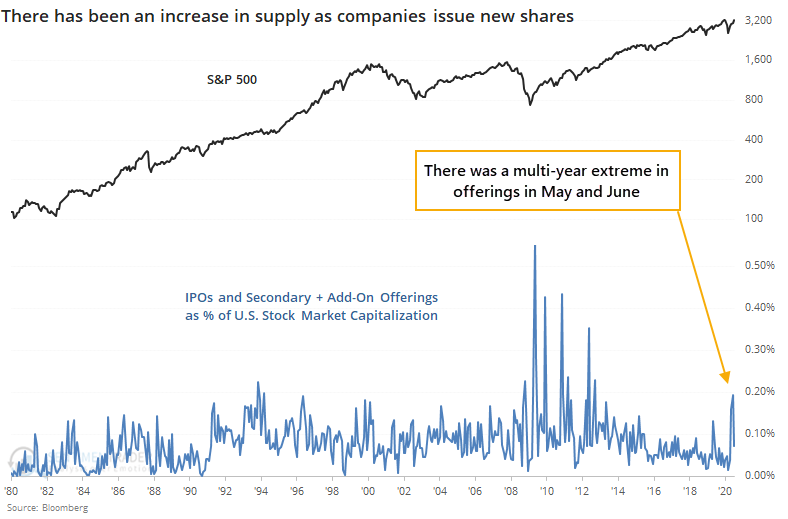
As Marketwatch notes, this has created a situation where the market is forced to choke down a lot of supply. New shares are being created through IPOs and secondary or add-on offerings, and fewer shares are being retired through buybacks.

While Bloomberg data differs somewhat from other sources, we can clearly see the jump in offerings. From May through July, there was $140 billion in IPOs and other offerings. As a percentage of the U.S. stock market, it was the most in 8 years.

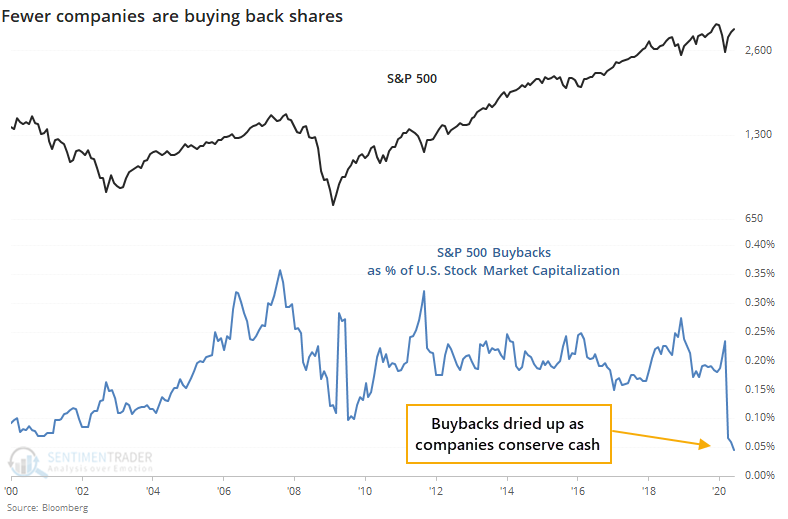
At the same time, buybacks have dried up as companies try to conserve cash without firing employees, cutting their dividends, or hamstringing their research and development budgets.

Theoretically, a combination of heavy buybacks and low offerings should be positive for stocks, since it would reduce supply. And few buybacks combined with heavy offerings should be negative.

But theory doesn't often play out in auction markets, and this is no different. Companies often increase their buybacks at precisely the wrong times, after shares have already rallied, and they pull back during times of crisis when their shares are cheap.

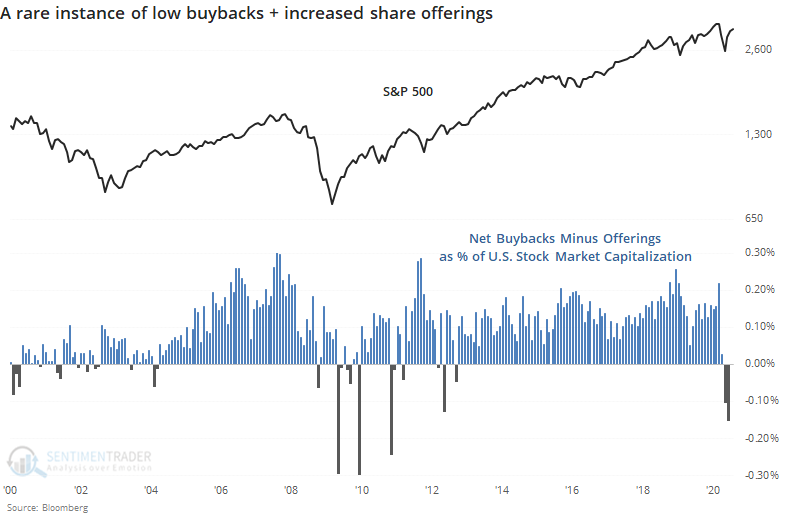
The chart above takes the total amount of buybacks as a percentage of market value and subtracts the total amount of share offerings via IPOs and add-ons. The higher the number, the more positive it should be for stocks. That wasn't the case - we saw high numbers right before market declines in 2007, 2012, and earlier this year.

The opposite scenario, where we are now, wasn't as clear-cut. Generally, these occurred after declines and before rallies, but it was not consistent.

The biggest takeaway is just a caveat about reading too much into the buyback vs offering theory of share supply. It sounds like this should be negative for stocks here, but the evidence doesn't give that a lot of support. If anything, we might say that companies got too pessimistic with their buybacks and that might actually be a positive. We already saw in May that a surge in offerings has not been an effective negative for stocks. Overall, it doesn't appear to be much of a reason for worry.

Sorry, you don't have access to this report

Upgrade your subscription plan to get access
Go to Dasboard
DATA &
TECHnologies
IndicatorEdge
‍
BackTestEdge
‍
Other Tools
‍
DataEdge API
RESEARCH
reports
Research Solution
‍
Reports Library
‍
actionable
Strategies
Trading Strategies
‍
Smart Stock Scanner
‍
FREE
RESOUrCES
Simple Backtest
Calculator
Simple Seasonality
Calculator
The Kelly Criterion
Calculator
Sentiment Geo Map
‍
Public Research Reports
‍
Free Webinar
COMPANY
‍
About
‍
Meet our Team
‍
In the News
‍
Testimonials
‍
Client Success Stories
Pricing
Bundle pricing
‍
Announcements
‍
FAQ
© 2024 Sundial Capital Research Inc. All rights reserved.
Setsail Marketing
TermsPrivacyAffiliate Program
Risk Disclosure: Futures and forex trading contains substantial risk and is not for every investor. An investor could potentially lose all or more than the initial investment. Risk capital is money that can be lost without jeopardizing ones’ financial security or life style. Only risk capital should be used for trading and only those with sufficient risk capital should consider trading. Past performance is not necessarily indicative of future results.

Hypothetical Performance Disclosure: Hypothetical performance results have many inherent limitations, some of which are described below. No representation is being made that any account will or is likely to achieve profits or losses similar to those shown; in fact, there are frequently sharp differences between hypothetical performance results and the actual results subsequently achieved by any particular trading program. One of the limitations of hypothetical performance results is that they are generally prepared with the benefit of hindsight. In addition, hypothetical trading does not involve financial risk, and no hypothetical trading record can completely account for the impact of financial risk of actual trading. for example, the ability to withstand losses or to adhere to a particular trading program in spite of trading losses are material points which can also adversely affect actual trading results. There are numerous other factors related to the markets in general or to the implementation of any specific trading program which cannot be fully accounted for in the preparation of hypothetical performance results and all which can adversely affect trading results.

Testimonial Disclosure: Testimonials appearing on this website may not be representative of other clients or customers and is not a guarantee of future performance or success.