
Commodity Momentum

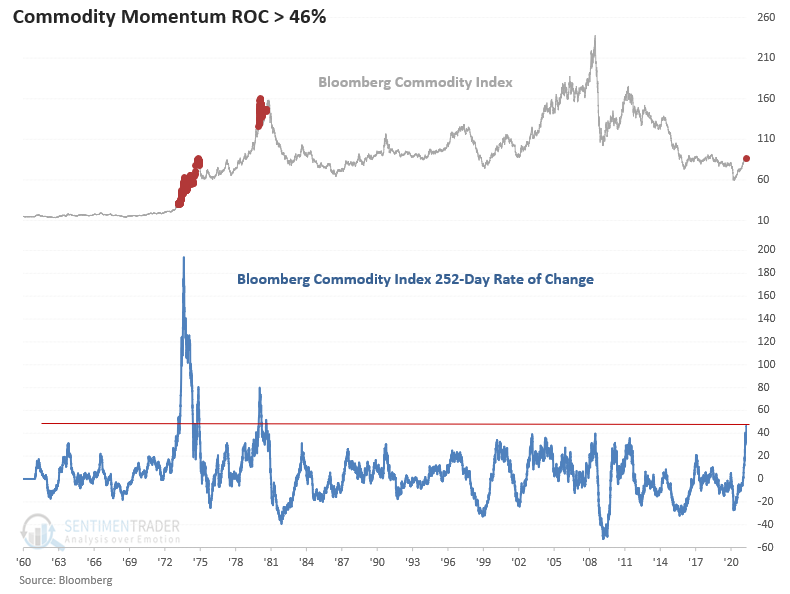
Commodities continue to be in the news, and rightfully so with some of the most significant year-over-year gains since the commodity bull market cycle in the 1970s. While lumber is getting all the headlines, I would note that commodity participation is broad. This week the 252-day rate of change for the Bloomberg Commodity Index crossed above 46%, a level last reached in 1980.
Let's look at the commodity momentum to see if we can gain an information edge for commodities, stocks, and bonds.
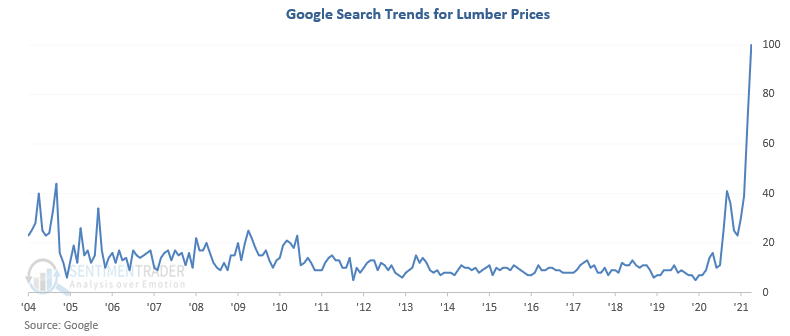
LUMBER IN THE NEWS
Google search trends for lumber prices are nothing short of staggering.
A 40-YEAR HIGH IN COMMODITY MOMENTUM
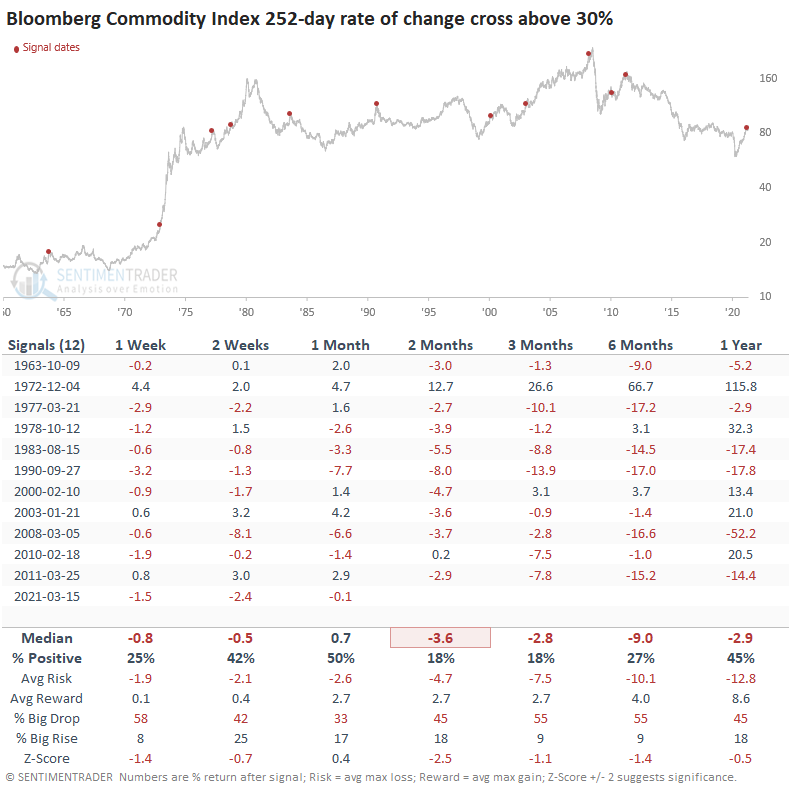
As shown in the chart below, the 252-day rate of change for the Bloomberg Commodity Index has now reached the highest level in 40 years. The question we should be asking is the following. Does the current surge represent the initial stages of a new commodity bull market like the early 1970s, or does it represent the typical post-recession recovery roadmap?
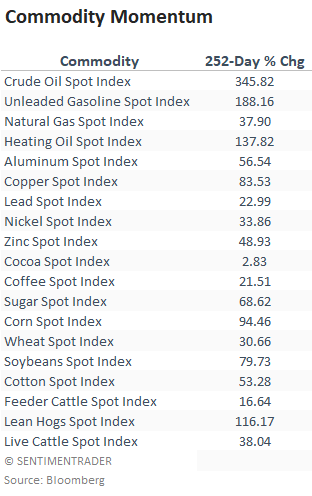
The following table highlights how the surge is broad-based as several individual commodities are up more than 50% on a year-over-year basis.
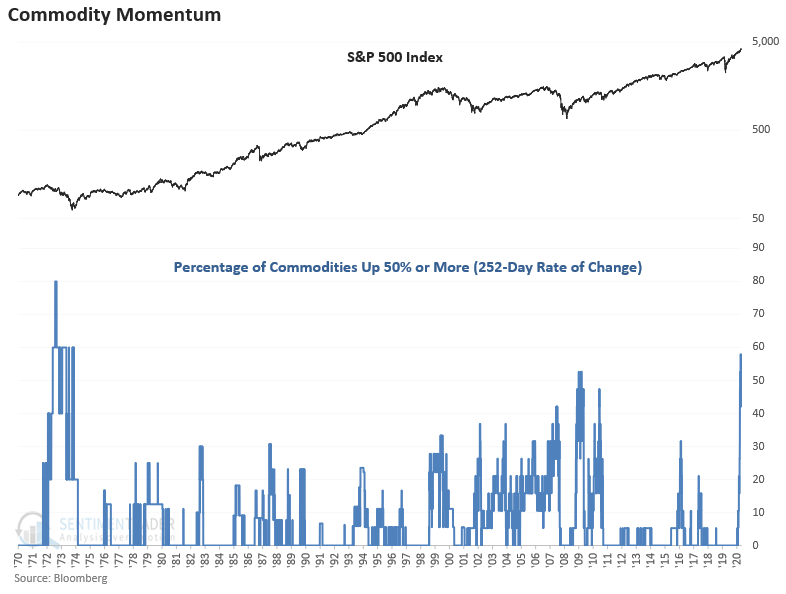
A MAJORITY OF CONTRACTS ARE UP 50% OR MORE
When I utilize the components in the above table and measure the percentage of commodities with a 252-day rate of change of 50% or more, one can see that the percentage has reached the highest level since the 1970s.
To get a larger sample size, we have to relax the parameters. The tables below show each instance when the 252-day rate of change crossed above 30%.
Commodities show consistent weakness across all timeframes with some notable numbers in the 2-6 month window. This is further confirmation of what Jason noted a month ago.
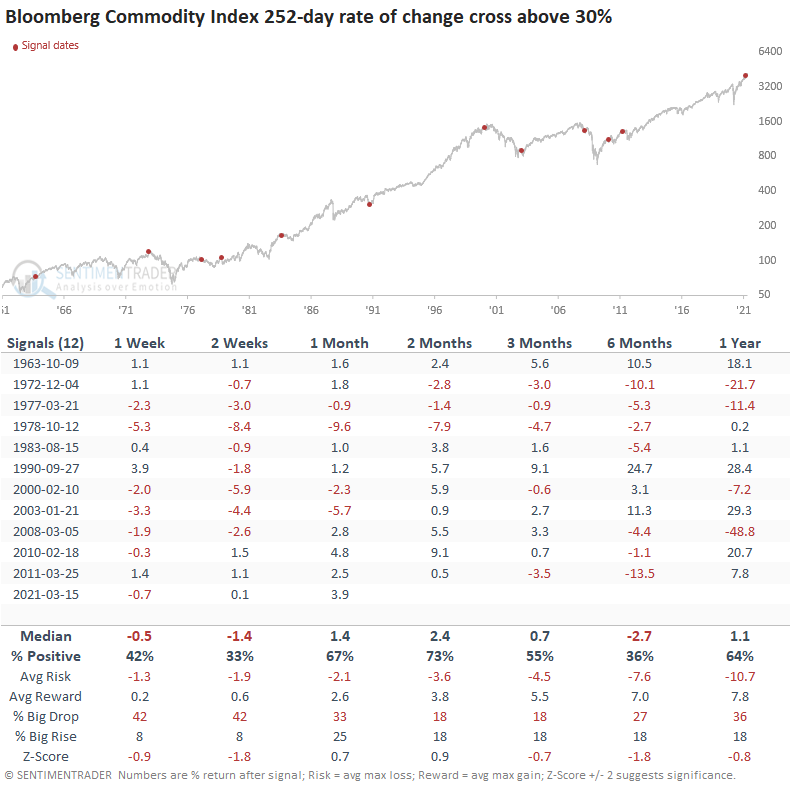
IMPACT ON OTHER MARKETS
After the initial weakness in the first couple of weeks, it looks like the impact of higher commodity prices starts to creep back in and impact stocks in the 3-12 month timeframe. If you're in the camp that commodities follow the typical post-recession roadmap, I would note the corrections in 1976, 1983, 2010, and 2011 as potential analogs.
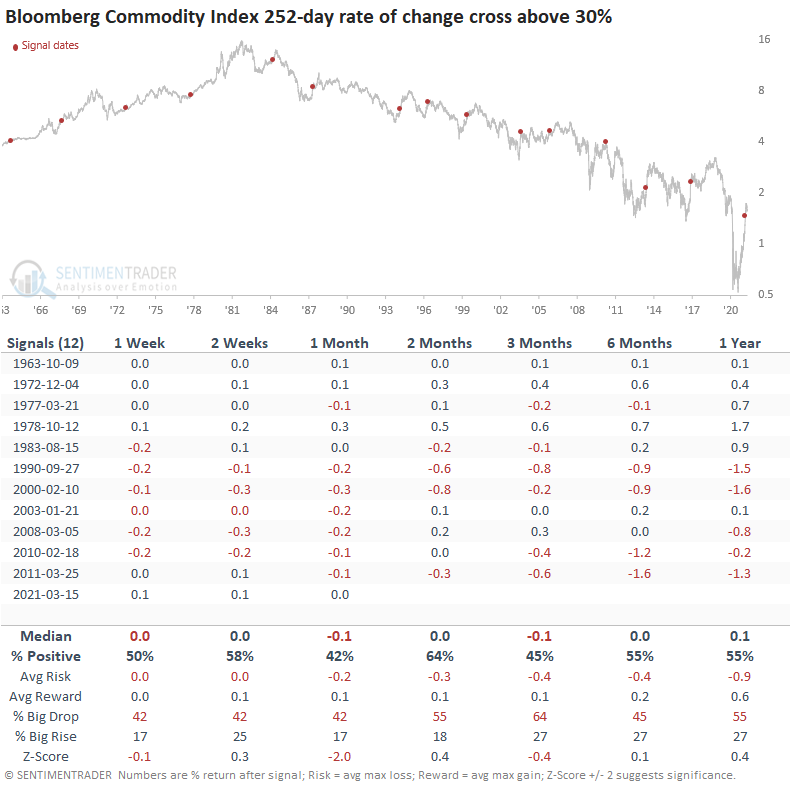
For 10-year yields, the 1-month time frame is the only period to show a meaningful trend with a decline. It's difficult to gather much information out of the bond table as it appears that the direction in yields is more often than not impacted by the secular trend. Yields tended to rise before 1990 and fall afterward.
 The commodity results provide us with the best information edge. If you think commodities are following the normal post-recession recovery roadmap and have not begun a new supercycle, I suspect a nice opportunity on the short side will present itself later this year. At some point, the surge in commodity prices will start to impact stocks in certain groups as margins get squeezed.
For a note on the surge in corn prices from Jay Kaeppel, please click here.