Data &
Technology
Research
Reports
Report Solutions
Reports Library
Actionable
Strategies
Free
Resources
Simple Backtest Calculator
Simple Seasonality Calculator
The Kelly Criterion Calculator
Sentiment Geo Map
Public Research Reports
Free Webinar
Pricing
Company
About
Meet Our Team
In the News
Testimonials
Client Success Stories
Contact
Log inLoginSign up
< BACK TO ALL REPORTS

Commodity Bulls Hope for a 1973 Repeat

Jason Goepfert
2021-05-06
So far in 2021, commodities have been on a tear. Going back to 1933, there have been 9 other years that had a high 4-month correlation to the start of the year. Most of them saw a multi-month pause, with one major exception.

On Tuesday, we saw that the 4-month start to stocks this year has had some impressive precedents. While most of the similar years witnessed some consolidation during the summer months, the long-term implications were positive.

Commodities have arguably had an even more impressive start. The long-term trend in stocks is well-documented to be higher as companies innovate and produce profits, but commodities are much more cyclical. As prices rise, farmers plant more crops, or miners dig more stuff out of the ground, and prices go down. It's hard to sustain uptrends except when there is a massive supply/demand imbalance.

MOST SIMILAR 4-MONTH STARTS FOR COMMODITIES

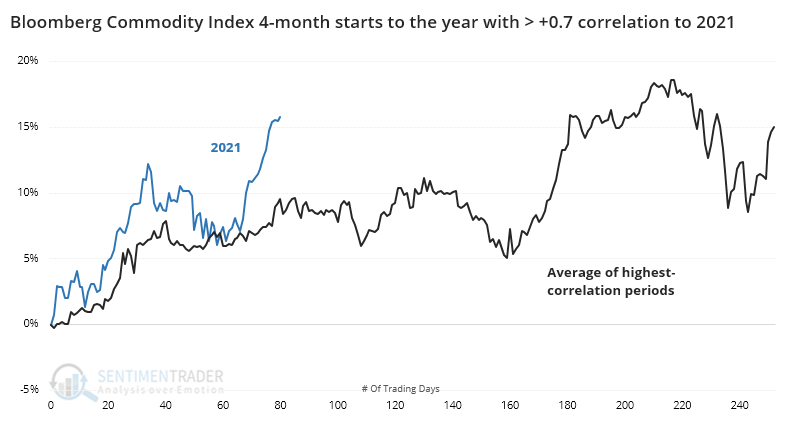
Through late April, the Bloomberg Commodity Index showed a gain well into the double-digits, and it has only added to them since then. Using the same methodology we used for stocks, we see that 9 other years had a correlation greater than +0.7 (on a scale of -1.0 to +1.0) through the first 4 months of the year.

The years all showed gains through April and enjoyed a roughly similar path to get there, but the only year with a better 4-month beginning was 1973. Commodity bulls would love to see a repeat, as it preceded massive additional gains.

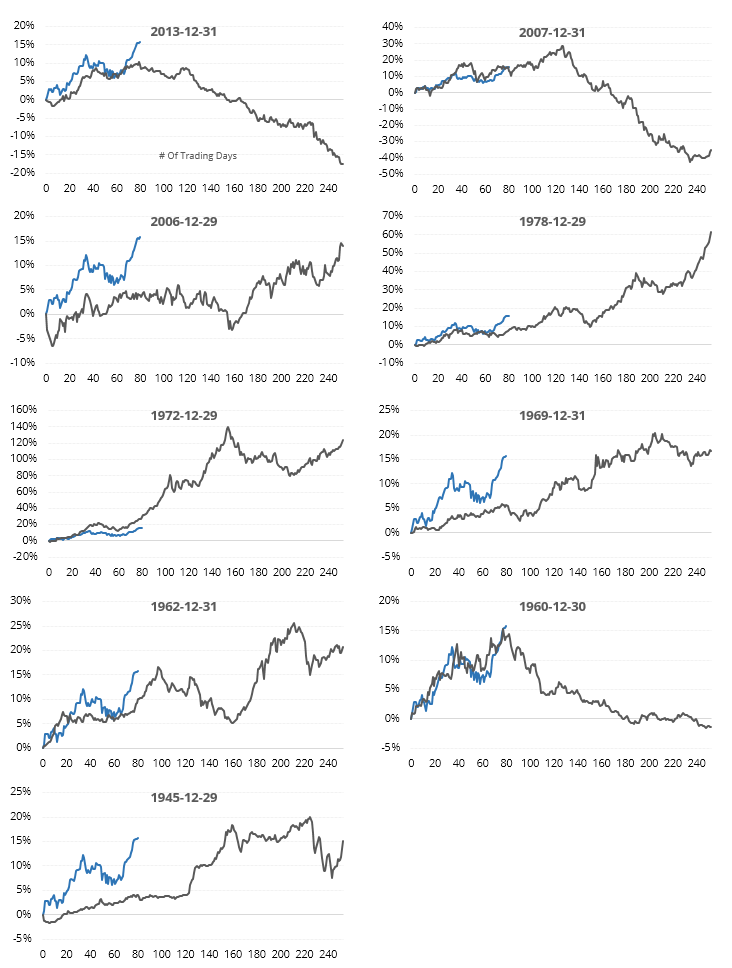
Even though their correlations to 2021 were all highly positive, there was still quite a bit of variability among the samples, especially in terms of magnitude. There was a general tendency to see commodities peak at about this point in the year, though.

WHAT GOOD STARTS MEAN FOR THE REST OF THE YEAR

The table below shows future returns in the index from the end of April for those years with the highest correlation to 2021.

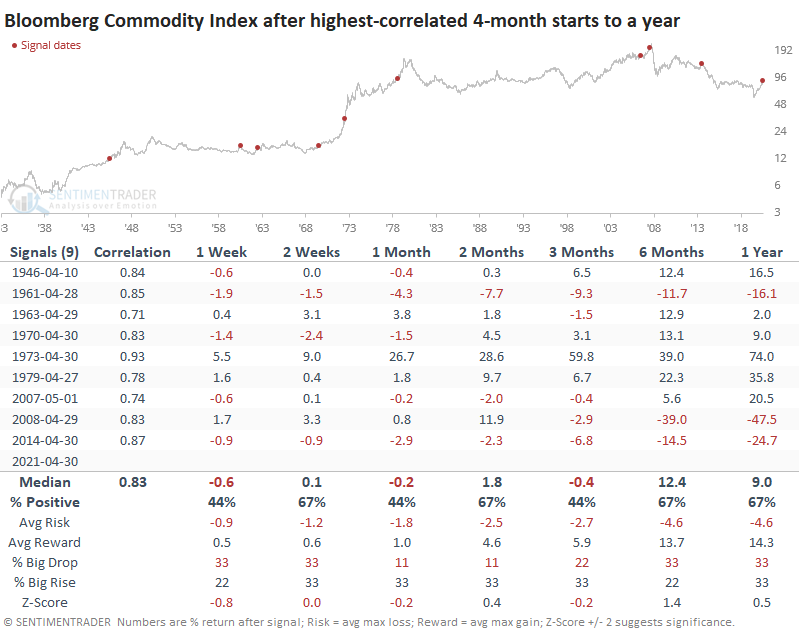
The year with the highest correlation was 1973, and there was virtually no letup as it preceded massive and sustained gains in the index. Among the others, only 1979 saw no negative returns across all time frames.

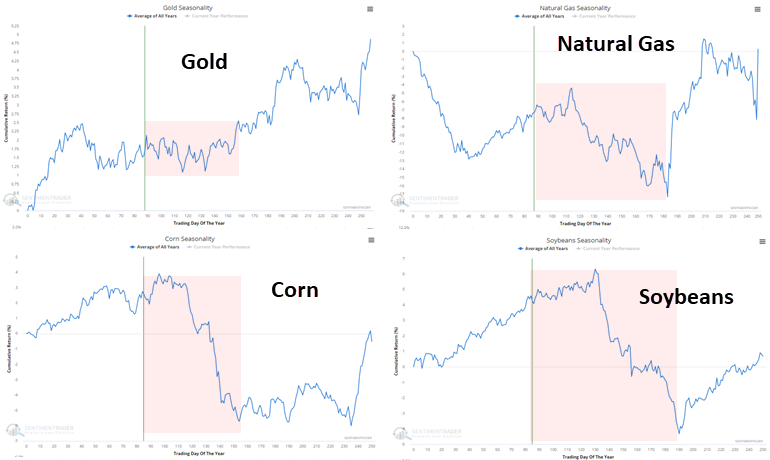
There are some shorter-term challenges to those precedents. The chart above clearly shows that the summer months preceded some choppy trading for commodities. Among some of the largest influences on the Bloomberg Commodity Index, the seasonal windows for gold, natural gas, corn, and soybeans are questionable.

Likewise, when we looked at the rates of change in commodities in March and April, we saw just how tough it has been for this market to sustain massive gains over the medium-term.

So, commodities should pause over the next few months and digest their recent gains. As always, a market that doesn't do what it should gives us a strong hint that something structural has changed, and this market has already done that to some degree. If commodities follow the 1973 playbook, then we won't see much, if any, weakness in the weeks and months to come. But it will have to fight historical analogs, seasonality, momentum, and sentiment, all pointing to a pause.

Sorry, you don't have access to this report

Upgrade your subscription plan to get access
Go to Dasboard
DATA &
TECHnologies
IndicatorEdge
‍
BackTestEdge
‍
Other Tools
‍
DataEdge API
RESEARCH
reports
Research Solution
‍
Reports Library
‍
actionable
Strategies
Trading Strategies
‍
Smart Stock Scanner
‍
FREE
RESOUrCES
Simple Backtest
Calculator
Simple Seasonality
Calculator
The Kelly Criterion
Calculator
Sentiment Geo Map
‍
Public Research Reports
‍
Free Webinar
COMPANY
‍
About
‍
Meet our Team
‍
In the News
‍
Testimonials
‍
Client Success Stories
Pricing
Bundle pricing
‍
Announcements
‍
FAQ
© 2024 Sundial Capital Research Inc. All rights reserved.
Setsail Marketing
TermsPrivacyAffiliate Program
Risk Disclosure: Futures and forex trading contains substantial risk and is not for every investor. An investor could potentially lose all or more than the initial investment. Risk capital is money that can be lost without jeopardizing ones’ financial security or life style. Only risk capital should be used for trading and only those with sufficient risk capital should consider trading. Past performance is not necessarily indicative of future results.

Hypothetical Performance Disclosure: Hypothetical performance results have many inherent limitations, some of which are described below. No representation is being made that any account will or is likely to achieve profits or losses similar to those shown; in fact, there are frequently sharp differences between hypothetical performance results and the actual results subsequently achieved by any particular trading program. One of the limitations of hypothetical performance results is that they are generally prepared with the benefit of hindsight. In addition, hypothetical trading does not involve financial risk, and no hypothetical trading record can completely account for the impact of financial risk of actual trading. for example, the ability to withstand losses or to adhere to a particular trading program in spite of trading losses are material points which can also adversely affect actual trading results. There are numerous other factors related to the markets in general or to the implementation of any specific trading program which cannot be fully accounted for in the preparation of hypothetical performance results and all which can adversely affect trading results.

Testimonial Disclosure: Testimonials appearing on this website may not be representative of other clients or customers and is not a guarantee of future performance or success.