
Commodities Rising?

In the most recent decade, stocks bonds and gold all enjoyed significant advances. Nothing got left behind like commodities. In retrospect this should not be surprising. In a relatively low inflation environment – and with the Fed pumping money in a big way time and again – there isn’t much impetus for hard assets to rally. And boy did they ever – NOT.
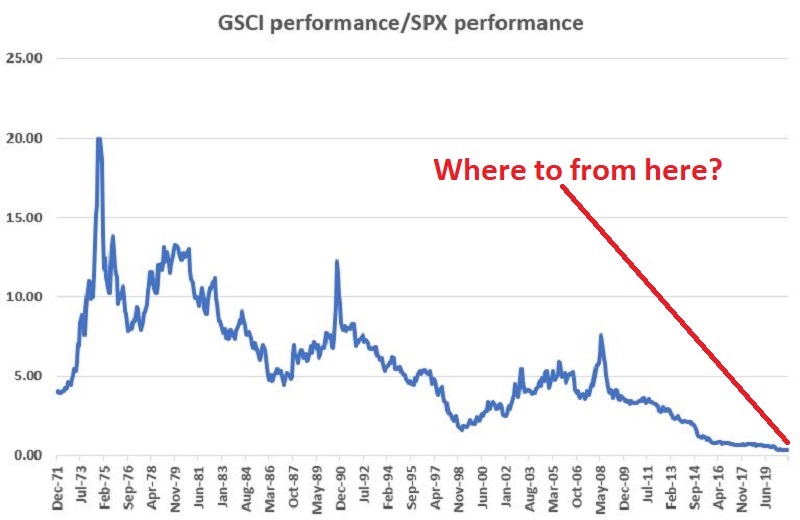
The first chart below displays the ratio of the cumulative growth of the Goldman Sachs Commodity Index (GSCI) divided by the growth of the S&P 500 Index (SPX) since January 1st, 1971. Along the way there have been some huge swings. To be clear, when the line is rising it means commodities are outperforming stocks and vice versa. As you can see at the lower right-hand corner of the chart, commodities have plummeted relative to stocks since peaking in 2008.
GSCI performance relative to SPX performance
Here is what you need to remember: This current state of affairs WILL NOT last forever. As sure as markets fluctuate, commodities will one day once again and outperform stocks. Many analysts (this one included) have made the argument that we are looking at a generational opportunity to buy commodities. Of course, while that sounds all bold and dramatic the reality is that there is no way to know when the turn might actually take place. In fact, a person could easily have made the exact same argument as long ago as late 2014 when the GSCI/SPX ratio fell below the low registered in 1999. Being early can be painful. Nevertheless, we are now 6+ years down the road and that much closer to the eventual “turn.” Interestingly, that turn may already be starting to unfold.
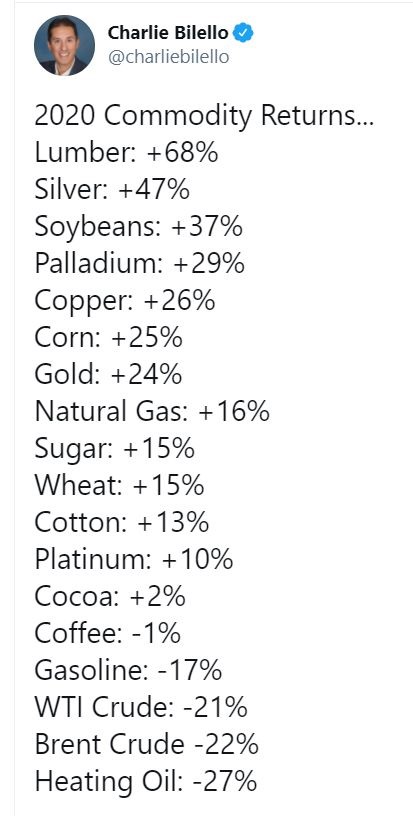
The table below published by Charlie Bilello displays 2020 returns for an array of commodities. The results overall are not too shabby. In fact, the ratio was actually slightly higher at the end of December 2020 than it was at the end of April, i.e., under the cover of “Wow, I can’t believe how much the stock market has rallied – and tech stocks are fabulous”, commodities as an asset class actually slightly outperformed.
2020 returns for a variety of commodities
So, is this “the moment” to be piling into commodities? It beats me. But conventional wisdom argues that to get a “quick and dirty” idea regarding the trend of commodities one should “look to the dollar”. In other words, conventional wisdom says that if the U.S. dollar is falling that is good for commodities and if it is rising that is bad for commodities. Is there anything to this? As it turns out, “yes” and “no”. Yes, there is an inverse relationship between the U.S. dollar and commodities, but for more useful information it appears they are looking at the wrong dollar.
For our initial test we will consider the performance of the Goldman Sachs Commodity Index (GSCI) depending on whether the U.S. dollar is trading below its 24-month moving average (considered bullish for commodities) or above its 24-month moving average (considered bearish for commodities). As you can see below there does appear to be some value to this.
GSCI performance based on U.S. dollar trend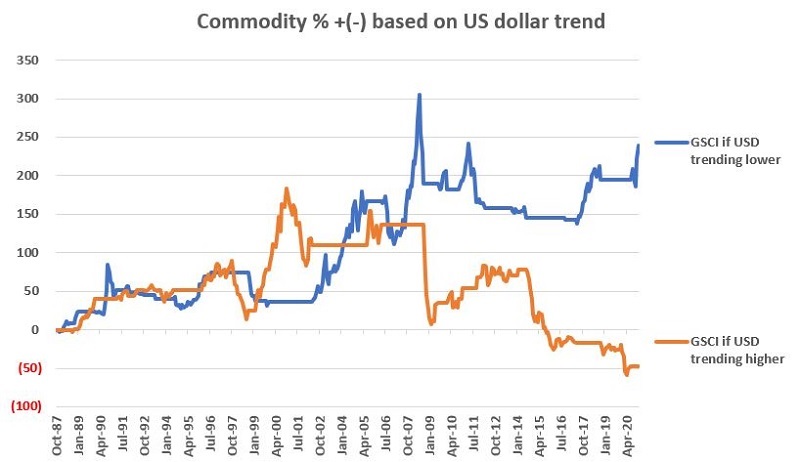
Now let’s replace the U.S. dollar with the Australian dollar. The Aussie dollar of course trades inversely to the U.S. dollar (and in the same direction as commodities). So, for this test we will consider it:
*Bullish for commodities if the Aussie dollar is above its 24-month moving average
*Bearish for commodities if the Aussies dollar is below its 24-month moving average.
GSCI performance based on Australian dollar trend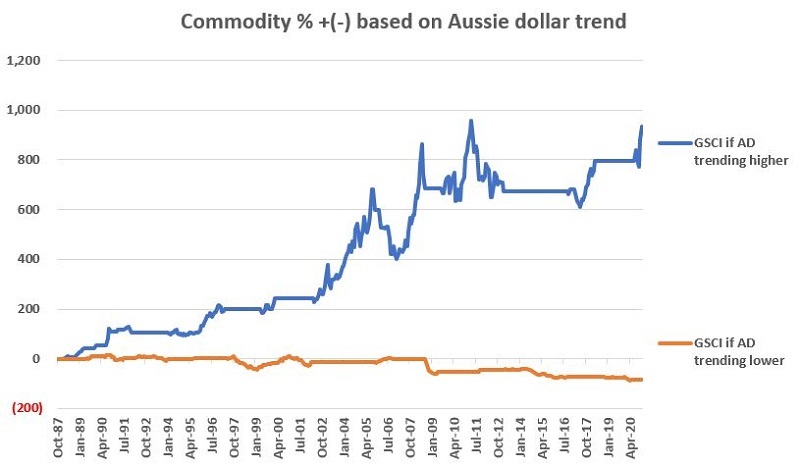
For the record, from 1987 through 2020:
*GSCI gained +934% while the Aussie Dollar was trending higher
*GSCI lost -83% while the Aussie Dollar was trending lower
To put a finer point on it, historically not a lot of “good” happens to commodities when the Aussie dollar is in a downtrend.
GSCI when Aussie dollar trending lower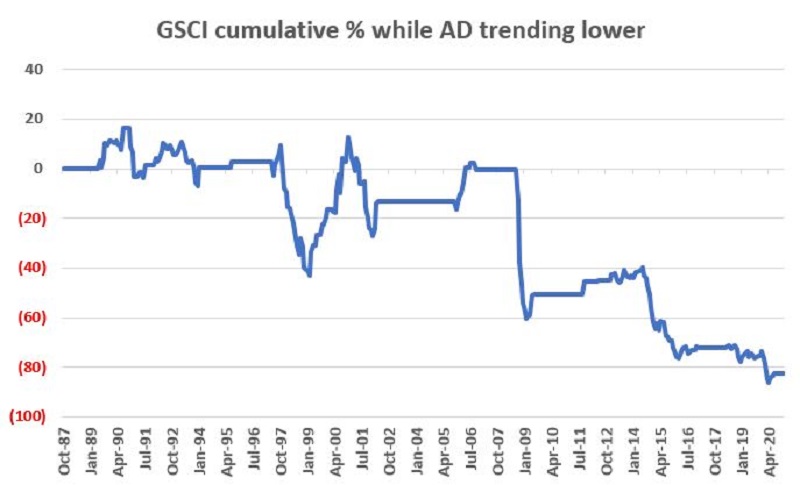
Since this is simply a “quick and dirty” approach the simplest method for most investors is to track tickers FXA (Invesco CurrencyShares Australian Dollar Trust ETF) for the Aussie Dollar and ticker GSG (iShares S&P GSCI Commodity-Indexed Trust ETF) for commodities. These ETFs – including a 24-month moving average for FXA appear below. For the record, FXA closed above its 24-month moving average at the end of July 2020.
Tickers FXA and GSG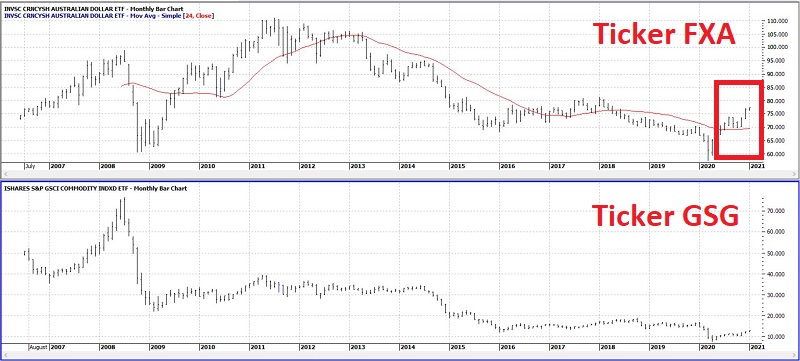 (Chart Courtesy of ProfitSource by HUBB)
So, is this the “Be all, end all” to investing in commodities as an asset class? Hardly. Please note the use of the words “Quick” and “Dirty” and the lack of the words “Sure” and “Thing.” Still, something that takes roughly 10 seconds a month to analyze – and that might keep you from losing -83% might be worth paying attention to.