Products
SentimenTrader Trading Tools
‍
Backtest Engine
My Trading Toolkit
Correlation Analysis
Seasonality
Indicators & Data API
‍
Proprietary Indicators & Charts
Market Data API
Strategies & Scanner
‍
50+ Trading Strategies
Smart Stock Scanner
Research Reports
‍
Research Solutions
Reports Library
Free Resources
Simple Backtest Calculator
Simple Seasonality Calculator
The Kelly Criterion Calculator
Sentiment Geo Map
Public Research Reports
Pricing
Company
About
In the News
Testimonials
Client Success Stories
Contact
Log inLoginSign up
< BACK TO ALL REPORTS

Commodities have lost their long-term uptrends

Dean Christians
2022-09-19
Last week, the number of commodities trading above their 200-day average fell below 20%. The trend deterioration occurred after more than 80% of commodities closed above their average as recently as May. After similar signals, commodities showed negative returns across all time frames.

Key points:

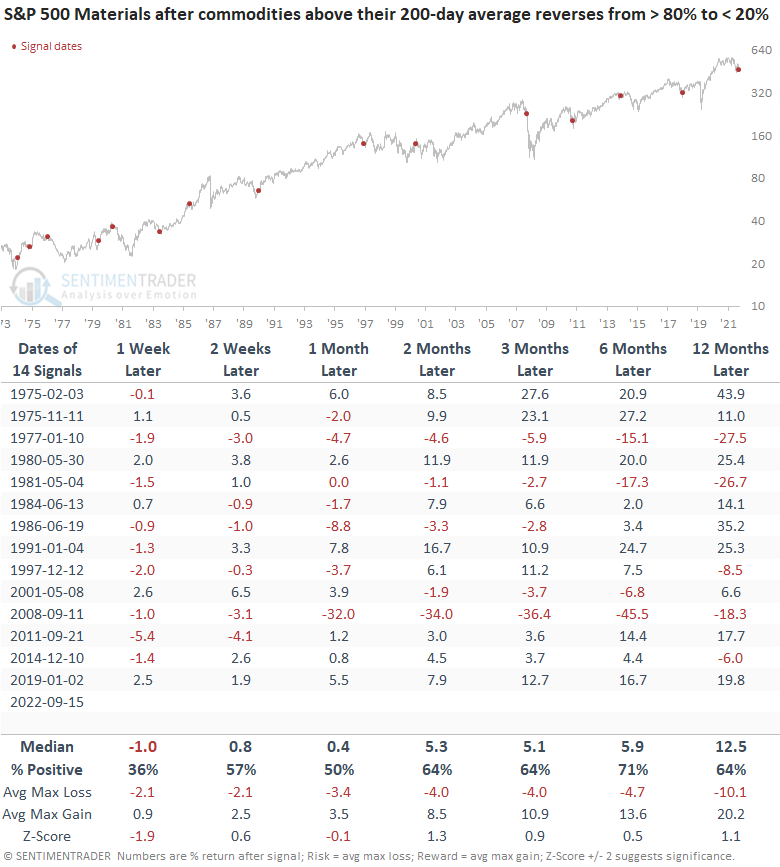
  • Commodities above their 200-day average reversed from > 80% to < 20%
  • After similar reversals, general commodity prices showed negative returns across all time frames
  • Commodity-based sectors showed somewhat weak returns in the near term

A bullish to a bearish reversal in long-term commodity uptrends

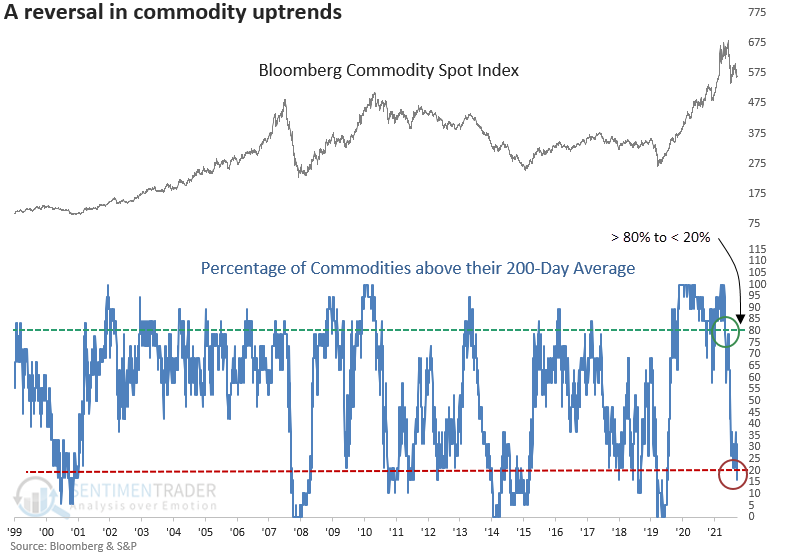
After a multi-year bull market with solid participation, most commodities have given up their long-term uptrends.

Last week, a significant reversal in uptrends occurred when fewer than 20% of commodities closed above their 200-day average. The shift happened after more than 80% of commodities traded above their 200-day average as recently as May.

Similar reversals preceded negative returns for commodities

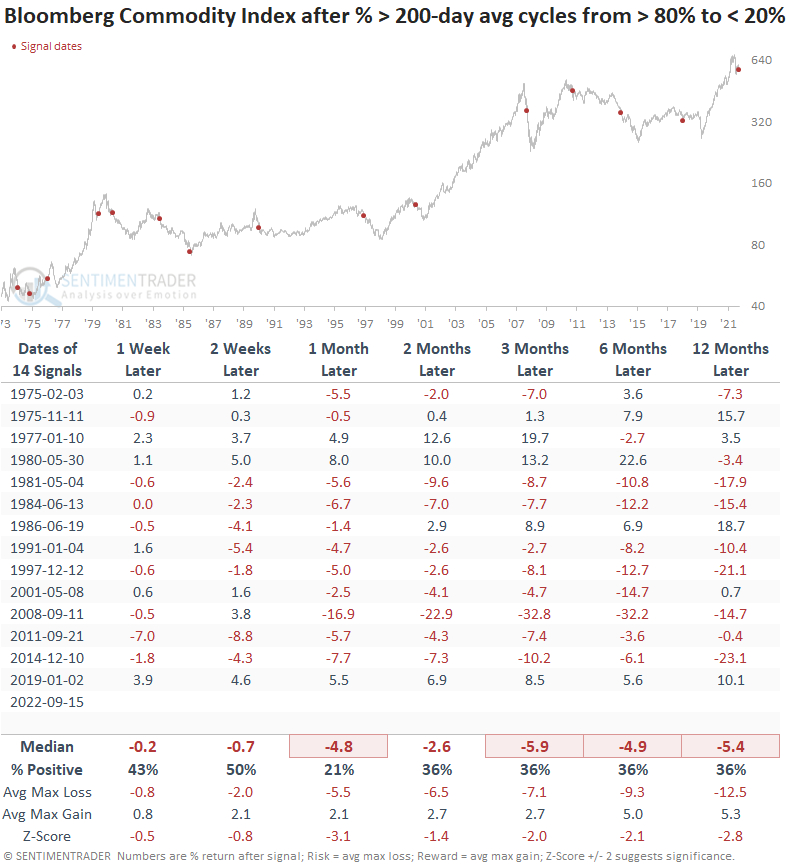
The u-turn in long-term uptrends for commodities does not bode well for the Bloomberg Commodity Spot Index. After similar signals, returns, win rates, and z-scores were unfavorable across all time frames. The index was lower a month after 9 out of the last 10 signals.

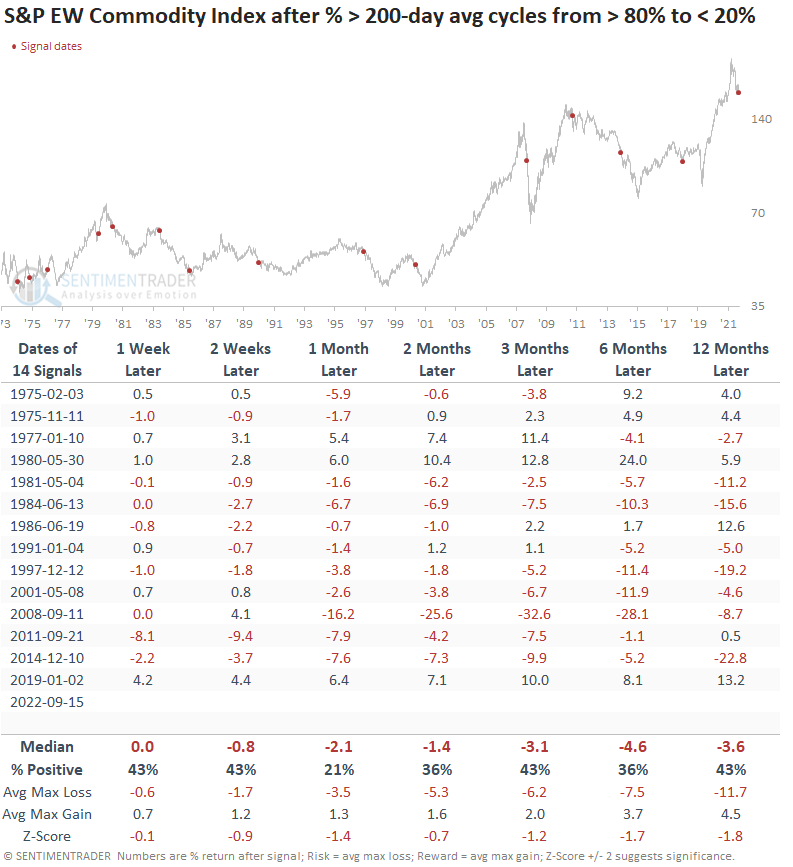
The S&P GSCI Equal Weight Commodity Index shows negative returns and unfavorable win rates across all time frames. So, the equal weight index confirms the adverse environment from the Bloomberg index, which is weighted more toward the underlying commodities' economic significance.

Commodity-based stocks tended to suffer as well

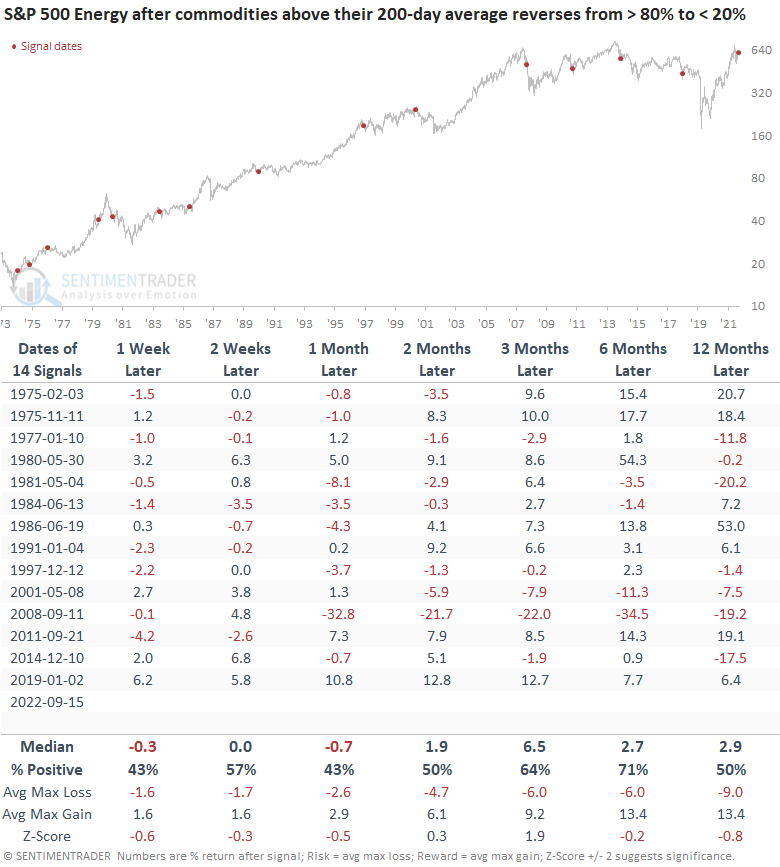
If we look at sectors that may be heavily influenced by commodity prices, two stand out.

Energy stocks look weak in the near term, with a more favorable outlook 3-months later. After that, returns start to fade with a coin toss win rate a year later. The 1981 and 2008 signals are interesting analogs as they occurred after significant energy-driven bull markets.

The materials sector looks better than the energy group, with positive returns across almost all time frames. Like energy, materials showed meaningful drawdowns after the commodity bull markets rolled over in 1981 and 2008.

What the research tells us...

Like most risk assets, commodities have finally succumbed to a softening economic environment brought on by the relentless rise in interest rates. The reversal in long-term uptrends looks unfavorable for a broad-based allocation to commodities. While energy and basic material stocks perform better over longer time horizons, one should be mindful of adverse conditions in the near term.

Sorry, you don't have access to this report

Upgrade your subscription plan to get access
Go to Dasboard
PRODUCTS
SentimenTrader
Trading Tools
Indicators & Data API
‍
Strategies & Scanner
‍
Research Reports
FREE
RESOUrCES
Simple Backtest
Calculator
Simple Seasonality
Calculator
The Kelly Criterion
Calculator
Sentiment Geo Map
‍
Public Research Reports
‍
Pricing
Bundle pricing
‍
Announcements
‍
FAQ
COMPANY
‍
About
‍
In the News
‍
Testimonials
‍
Client Success Stories
CONTACT
‍
General Inquiries
‍
Media Inquiries
‍
Financial Professionals Inquiries
‍
© 2025 Sundial Capital Research Inc. All rights reserved.
Setsail Marketing
TermsPrivacyAffiliate Program
Risk Disclosure: Futures and forex trading contains substantial risk and is not for every investor. An investor could potentially lose all or more than the initial investment. Risk capital is money that can be lost without jeopardizing ones’ financial security or life style. Only risk capital should be used for trading and only those with sufficient risk capital should consider trading. Past performance is not necessarily indicative of future results.

Hypothetical Performance Disclosure: Hypothetical performance results have many inherent limitations, some of which are described below. No representation is being made that any account will or is likely to achieve profits or losses similar to those shown; in fact, there are frequently sharp differences between hypothetical performance results and the actual results subsequently achieved by any particular trading program. One of the limitations of hypothetical performance results is that they are generally prepared with the benefit of hindsight. In addition, hypothetical trading does not involve financial risk, and no hypothetical trading record can completely account for the impact of financial risk of actual trading. for example, the ability to withstand losses or to adhere to a particular trading program in spite of trading losses are material points which can also adversely affect actual trading results. There are numerous other factors related to the markets in general or to the implementation of any specific trading program which cannot be fully accounted for in the preparation of hypothetical performance results and all which can adversely affect trading results.

Testimonial Disclosure: Testimonials appearing on this website may not be representative of other clients or customers and is not a guarantee of future performance or success.