Commodities are surging relative to stocks
Key points:
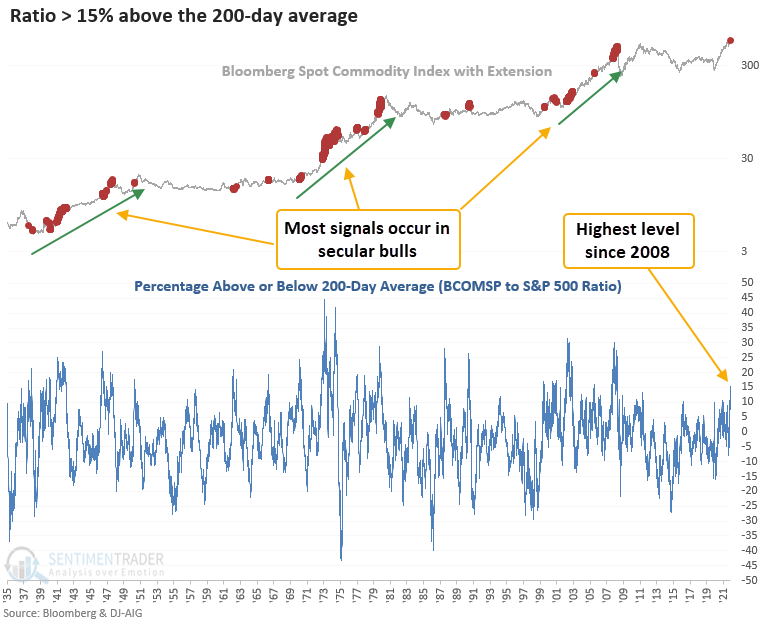
- A ratio between commodities and stocks surged 15% above its 200-day moving average
- Similar thrusts show positive returns for commodities on a medium to long-term basis
- Let's review some commodity charts and signals from previous notes
Commodities are surging relative to stocks
In a note titled, Did we just start a new secular commodity bull market, I shared a study suggesting commodities could be entering a new secular bull market similar to the 1940s, 1970s, or 2003-08. In subsequent notes titled, A reversal in commodity trends suggest higher prices and Commodities haven't done this since November 2007, I shared additional bullish signals for commodities.
This week a ratio between the Bloomberg spot commodity index and the S&P 500 surged 15% above its 200-day average. Let's conduct a study to assess the outlook for commodities after similar surges. I used a reset that required the percentage spread to cross below zero before a new signal could trigger again to screen out repeats.

Similar signals show higher prices on a medium to long-term basis
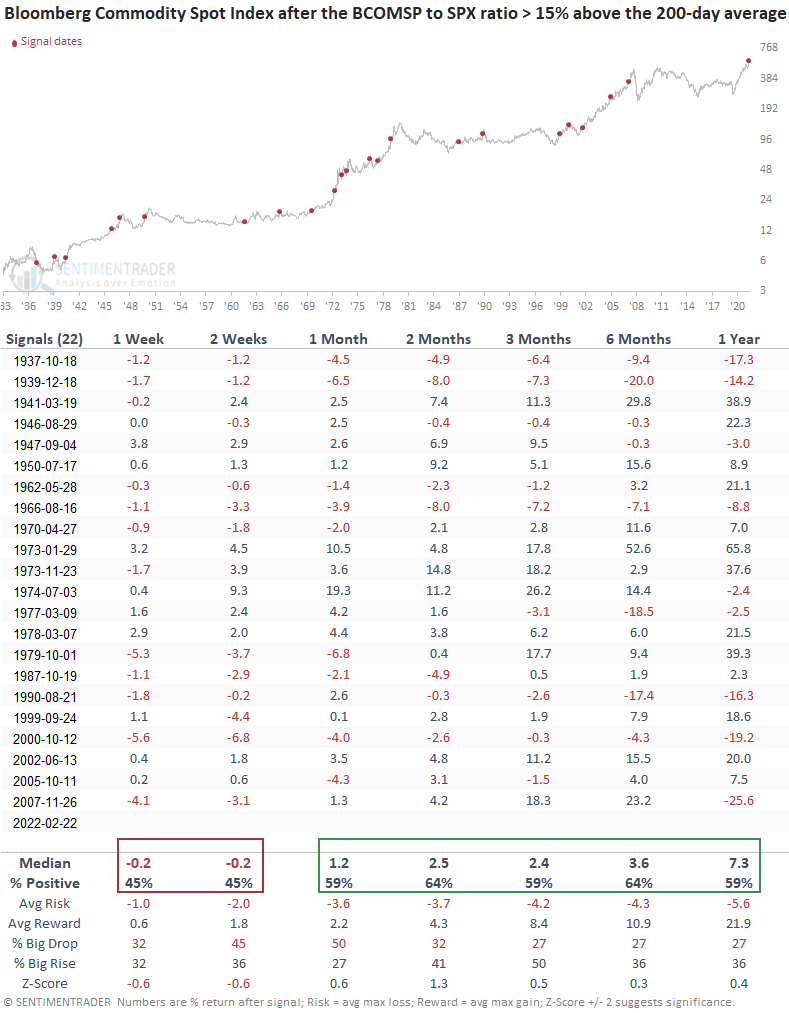
This signal triggered 22 other times over the past 85 years. After the others, commodity index returns and win rates were above historical averages on a medium and long-term basis. The 1 & 2-week time frames suggest commodities could consolidate the recent gains. However, the Russian invasion is a wildcard. 1937, 1939, and 1966 were the only signals that coincided with a significant peak in the commodity index.
Did we just start a new secular commodity bull market
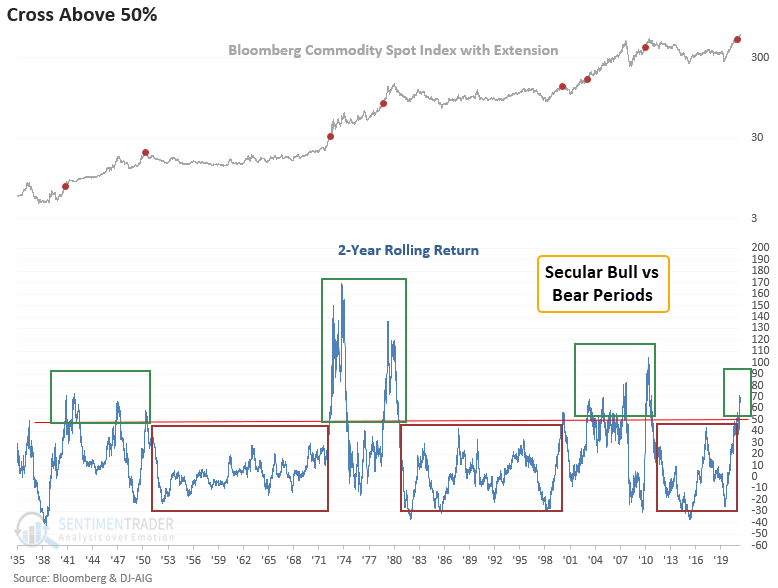
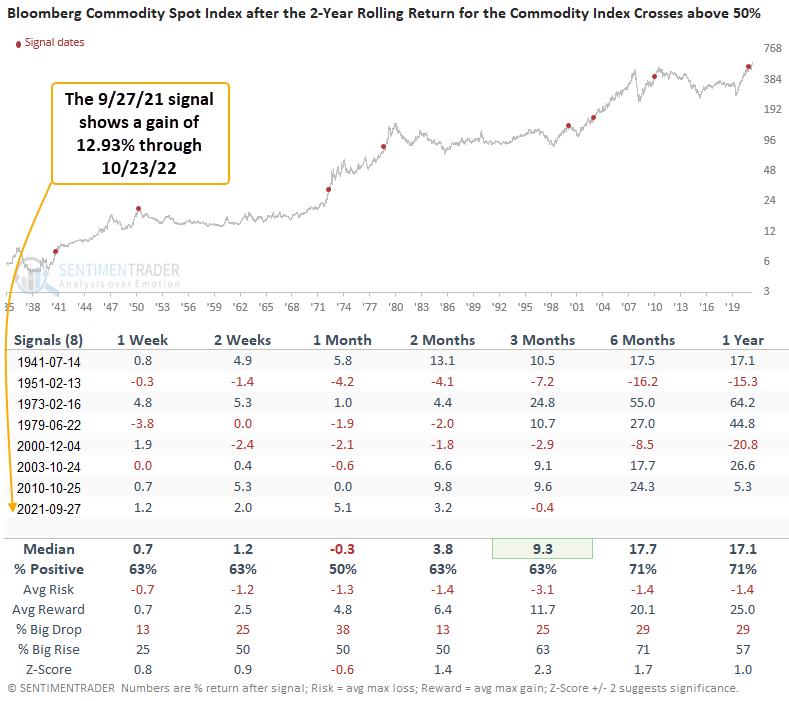
In a note published on 10/8/21, I assessed the outlook for commodities when the 2-year rolling return for the Bloomberg Commodity Spot Index exceeds 50% for the first time. The 2-year rolling return continues to climb, which suggests the secular case for commodities remains constructive.
The signal performance suggests further gains
With the Bloomberg commodity spot index up 12% since the signal date, the odds of a 1951 or 2000 peak look less likely.
A reversal in commodity trends suggest higher prices
In a note published on 1/12/22, I assessed the outlook for the Bloomberg commodity spot price index when a basket of spot commodities trading above their respective 50-day average reverses from less than 40% to greater than 83%. The number of commodities trading above their respective 50-day continues to remain firm, with a reading of 95%. Sugar is the only commodity below its 50-day average.
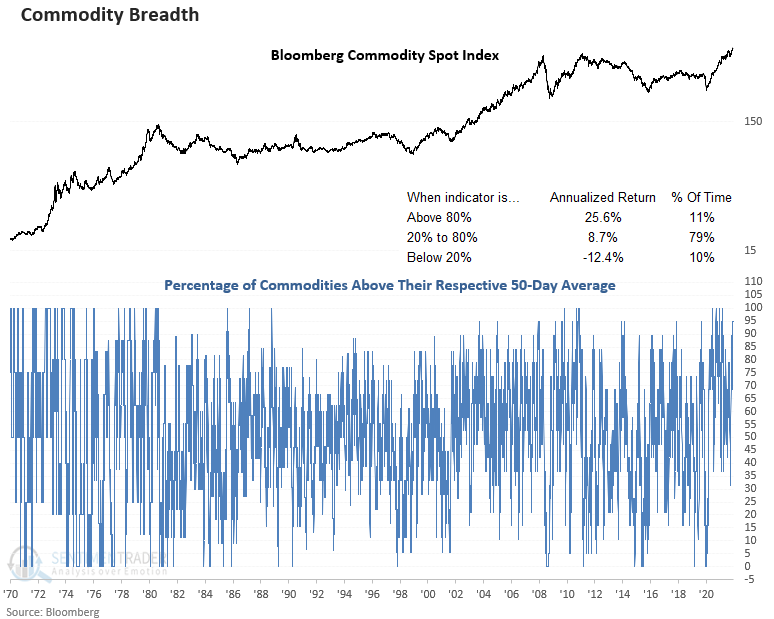
The signal performance looks robust
The 6.5% gain in the first month is the best performance in that time frame since a signal in February 2008.

Commodities haven't done this since November 2007
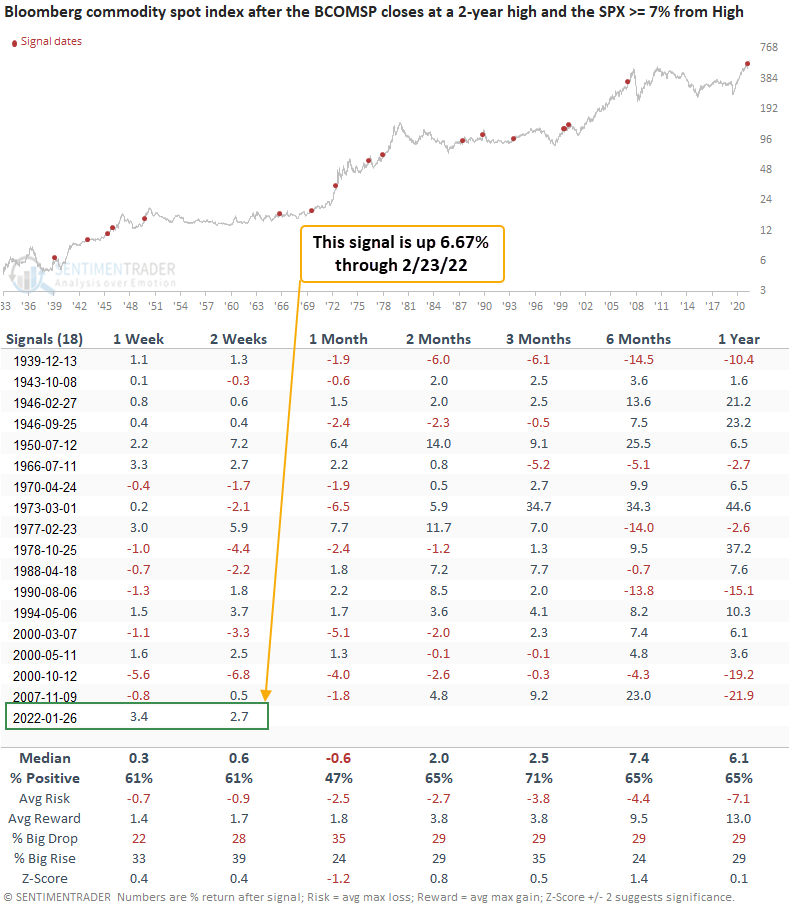
In a note published on 1/31/22, I assessed the outlook for commodities when the Bloomberg commodity spot index (BCOMSP) closes at a 2-year high. At the same time, the S&P 500 index is down 7% or more from its 2-year high. The S&P 500 has fallen further below its 2-year high, with commodities continuing to register new 2-year highs. Most signals occur in secular bull market periods for commodities.

The signal performance looks solid in a brief period
This signal got off to a fast start, with the best 1-week return in history.
What the research tells us...
A ratio between a commodity index and the S&P 500 surged 15% above its 200-day moving average, indicating strong commodity performance relative to stocks. Similar setups to what we're seeing now have preceded positive returns and favorable win rates on a medium and long-term basis. An assessment of previous signals suggests that the secular bull market in commodities remains constructive. With a significant gap higher on the Russian invasion this morning, I wouldn't be surprised if commodities took a hiatus to digest the gains.

