Data &
Technology
Research
Reports
Report Solutions
Reports Library
Actionable
Strategies
Free
Resources
Simple Backtest Calculator
Simple Seasonality Calculator
The Kelly Criterion Calculator
Sentiment Geo Map
Public Research Reports
Free Webinar
Pricing
Company
About
Meet Our Team
In the News
Testimonials
Client Success Stories
Contact
Log inLoginSign up
< BACK TO ALL REPORTS

Chinese tech stocks are doing exactly what they should

Jason Goepfert
2021-11-15
Over the past 6 months, Chinese technology stocks have become one of the most hated sectors among all equities. Selling pressure reached washout levels and is now stabilizing, which has led to large gains.

Key points:

  • The slump in Chinese technology stocks equates with other major panics
  • Their price path in recent weeks has roughly followed the 2008 and 2011 bottoms
  • Similar behavior led to the sector doubling over the next 1-2 years

The most hated sector is doing what it's supposed to

Chinese technology stocks have gone nowhere. And that's precisely what they should be doing.

In September, we looked at the selling cascade in these shares. There was perhaps no corner of the equity market that was more hated or washed-out.

So far, they've done exactly what they're supposed to do by doing nothing at all. Many of them are trading right around the same prices they were a couple of months ago...just like most other significant bottoms.

In September, we took a shorter-term view of several breadth metrics that showed the disaster within stocks in the CSI Overseas China Internet Index, upon which the popular KWEB fund is based. Now we can see that over the past 6 months, the selling pressure has been on par with one of the largest financial disasters of all time.

Over the past 6 months, selling pressure has been historically bad

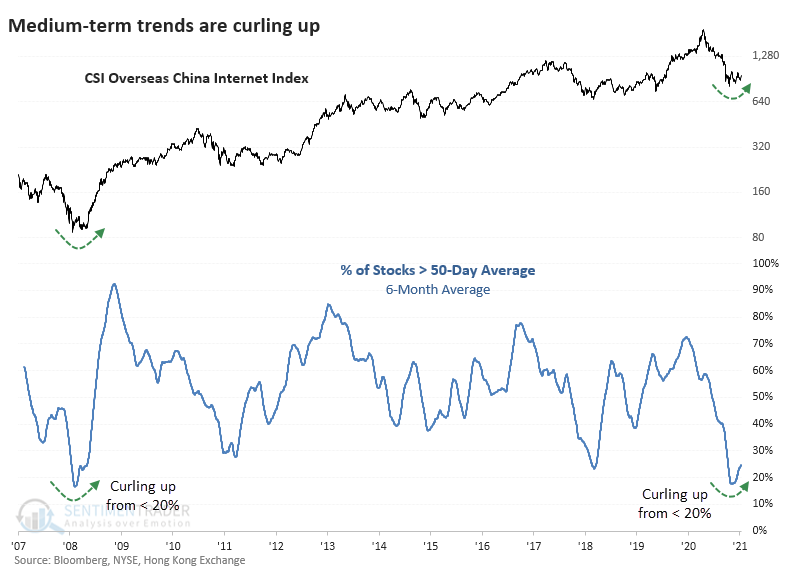
On an average day over the past six months, fewer than 20% of stocks in that China internet index were trading above their 50-day moving averages. That has now started to curl higher as some of them have recovered. This same thing happened as the world emerged from the Global Financial Crisis.

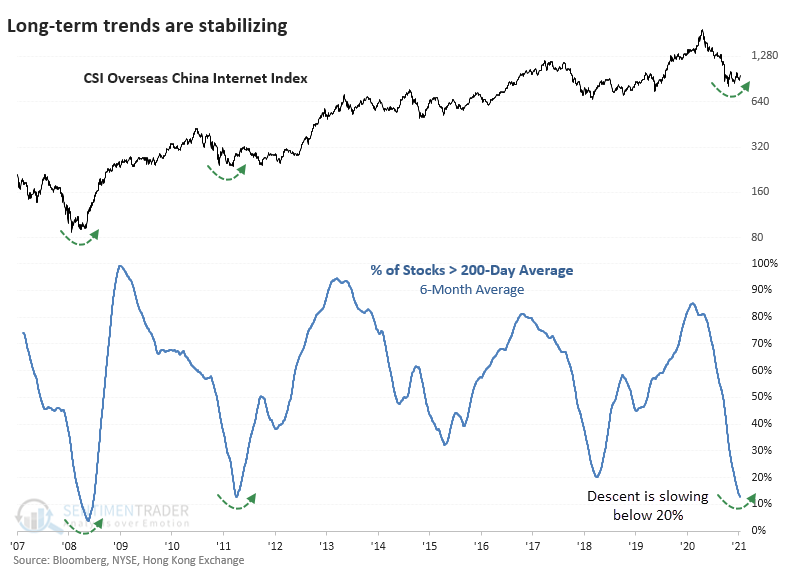
On a longer-term basis, fewer than 15% of the stocks have held above their 200-day moving averages. This average is just now halting its decline and starting to trough, as happened in 2008 and 2011.

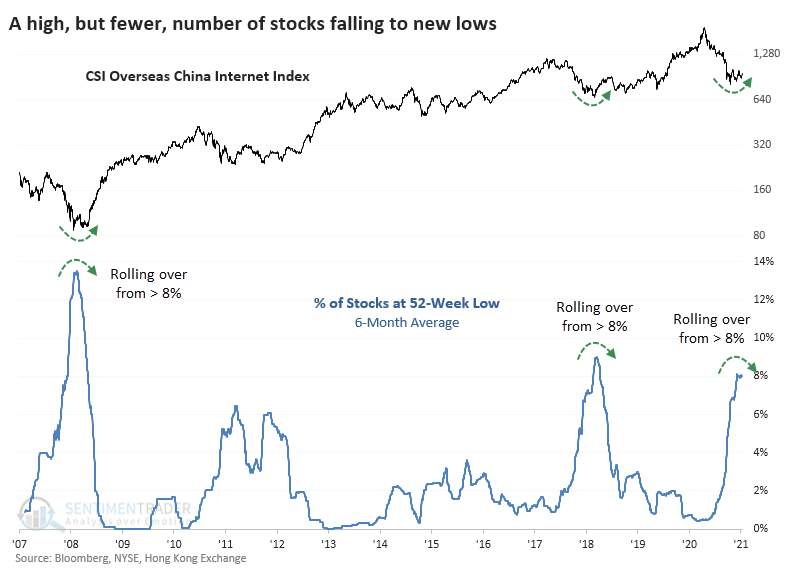
The percentage of stocks falling to a 52-week low never quite matched the extreme in 2008, or even 2018 for that matter. But now it's starting to peak, as it did at those other long-term bottoms.

Chinese tech doubled after other reversals

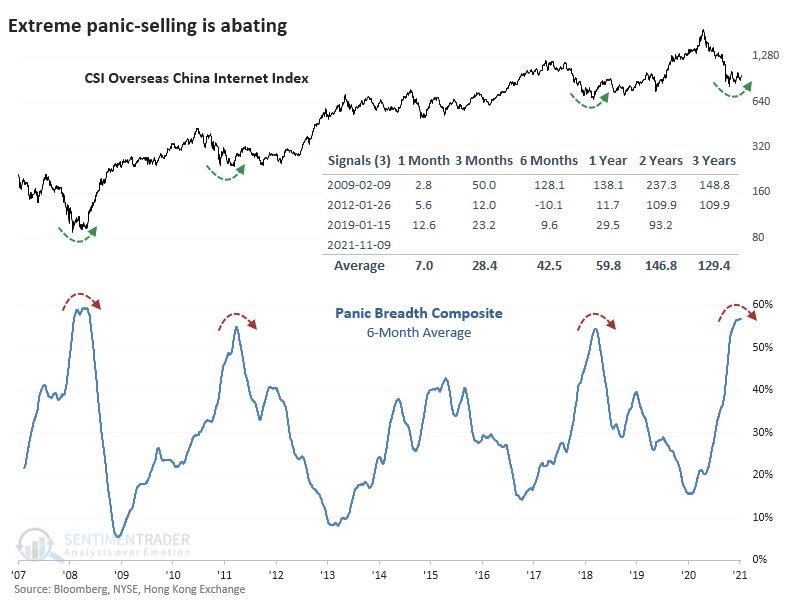
When we combined a number of these metrics into a single Composite, it's now rolling over from the 2nd-highest reading in 15 years. After each of the other reversals from similar extremes, the internet index doubled (or nearly so) within 2 years.

In September, we looked at the path the index took after the only times when more than half of the stocks fell to a 52-week low at the same time. If it followed a similar path this time, then we could have reasonably expected the index to chop around for another 1-3 months, which it has done. The important part was that it shouldn't make an appreciably lower low, which it hasn't.

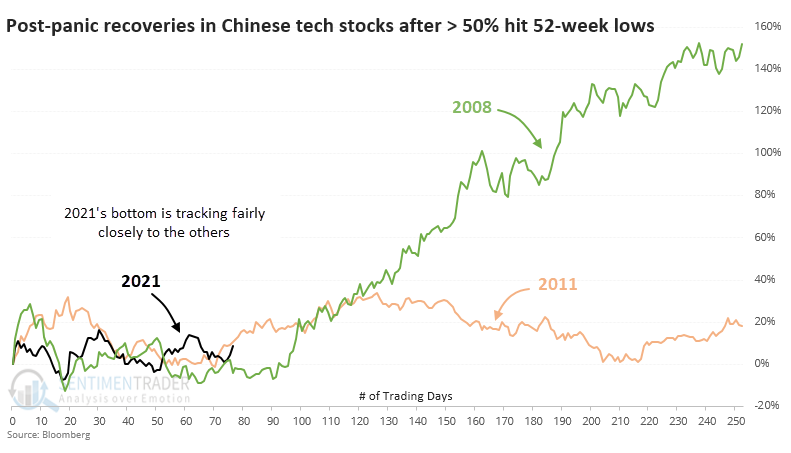
After the 2008 plunge, the index formed its ultimate bottom within the next couple of weeks. After the 2011 crisis, it had already bottomed and was on a sustained track higher.

What the research tells us...

The selling pressure in Chinese technology stocks in July and August reached historic proportions. Since then, the sector has chopped around, with long-term breadth metrics on par with several major lows over the past 15 years. They have roughly followed the path after other major panic bottoms, suggesting rising prices over the next 1-2 years.

Sorry, you don't have access to this report

Upgrade your subscription plan to get access
Go to Dasboard
DATA &
TECHnologies
IndicatorEdge
‍
BackTestEdge
‍
Other Tools
‍
DataEdge API
RESEARCH
reports
Research Solution
‍
Reports Library
‍
actionable
Strategies
Trading Strategies
‍
Smart Stock Scanner
‍
FREE
RESOUrCES
Simple Backtest
Calculator
Simple Seasonality
Calculator
The Kelly Criterion
Calculator
Sentiment Geo Map
‍
Public Research Reports
‍
Free Webinar
COMPANY
‍
About
‍
Meet our Team
‍
In the News
‍
Testimonials
‍
Client Success Stories
Pricing
Bundle pricing
‍
Announcements
‍
FAQ
© 2024 Sundial Capital Research Inc. All rights reserved.
Setsail Marketing
TermsPrivacyAffiliate Program
Risk Disclosure: Futures and forex trading contains substantial risk and is not for every investor. An investor could potentially lose all or more than the initial investment. Risk capital is money that can be lost without jeopardizing ones’ financial security or life style. Only risk capital should be used for trading and only those with sufficient risk capital should consider trading. Past performance is not necessarily indicative of future results.

Hypothetical Performance Disclosure: Hypothetical performance results have many inherent limitations, some of which are described below. No representation is being made that any account will or is likely to achieve profits or losses similar to those shown; in fact, there are frequently sharp differences between hypothetical performance results and the actual results subsequently achieved by any particular trading program. One of the limitations of hypothetical performance results is that they are generally prepared with the benefit of hindsight. In addition, hypothetical trading does not involve financial risk, and no hypothetical trading record can completely account for the impact of financial risk of actual trading. for example, the ability to withstand losses or to adhere to a particular trading program in spite of trading losses are material points which can also adversely affect actual trading results. There are numerous other factors related to the markets in general or to the implementation of any specific trading program which cannot be fully accounted for in the preparation of hypothetical performance results and all which can adversely affect trading results.

Testimonial Disclosure: Testimonials appearing on this website may not be representative of other clients or customers and is not a guarantee of future performance or success.