Catching Up

I'm taking some time for spring break with our kids, but here are some things that are piquing my interest right now.
Nothing has really changed the past few days. We're still seeing mostly mixed equities with the rebound so far today, and a relatively poor risk/reward profile over the medium-term. The bout of extreme momentum continues to argue for better prices in the long-term, though.
Breadth
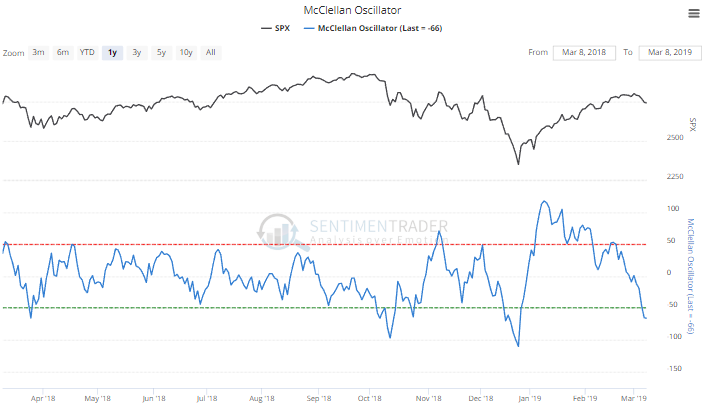
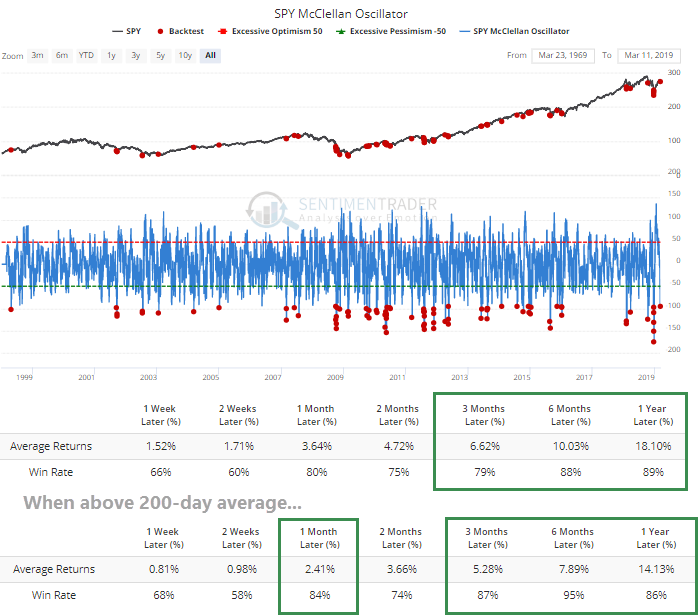
The most notable aspect of the past two months has been the remarkable momentum in market breadth. That has started to ebb, and the McClellan Oscillator is showing an initial hint of being oversold for the first time this year.
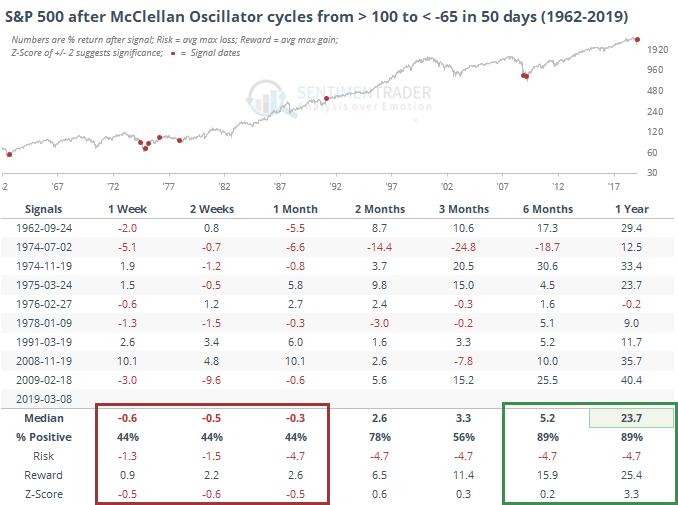
The first reading this low after a bout of extreme positive momentum has led to modest short-term weakness, but long-term strength.
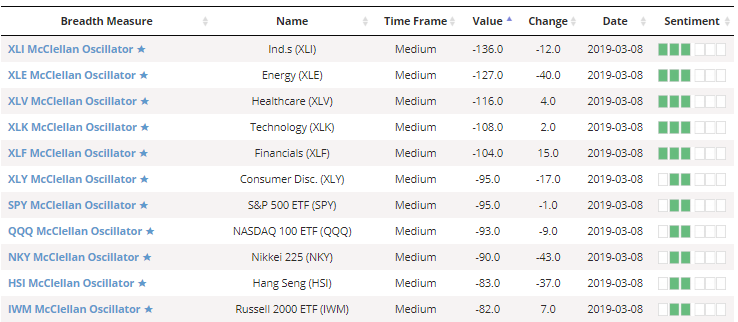
Quite a few sectors are also showing extreme readings, with a handful of them below -75 or even -100.
For the S&P 500, a reading this low has been a long-term positive, especially when it was trading above its 200-day average at the time.
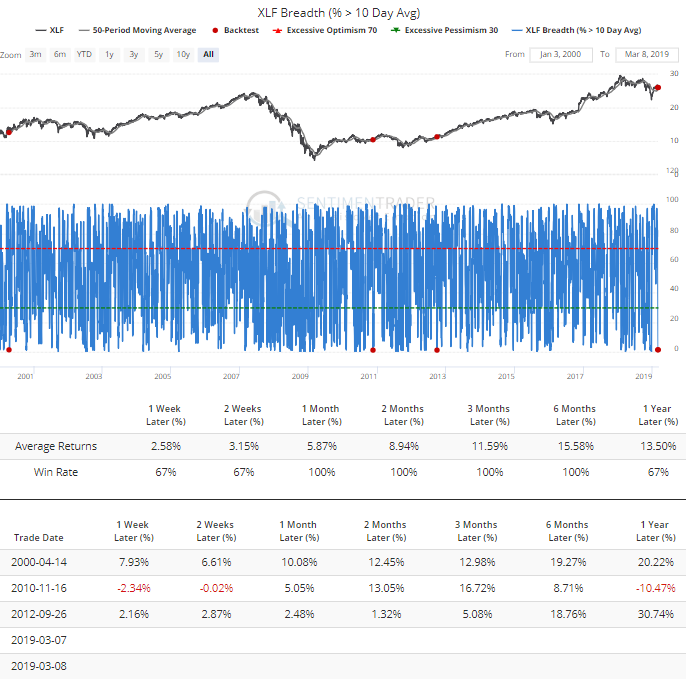
Interestingly, fewer than 2% of financials managed to hold above their 10-day averages. A reading that low while XLF was still trading above its 50-day average has only been seen three other times since 2000.
Reversals
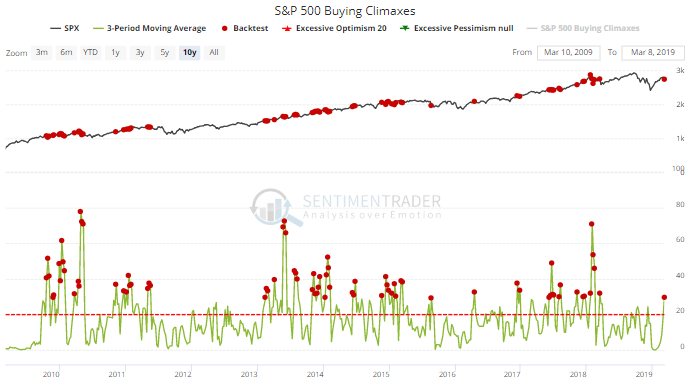
The weakness comes as more than 40 stocks in the S&P 500 suffered buying climaxes last week (a 52-week high, then close below the prior week's close). Over the past three weeks, an average of 30 stocks have had buying climaxes. That has been far surpassed at other times, but a reading this high has still led to a negative average return over the next two weeks.
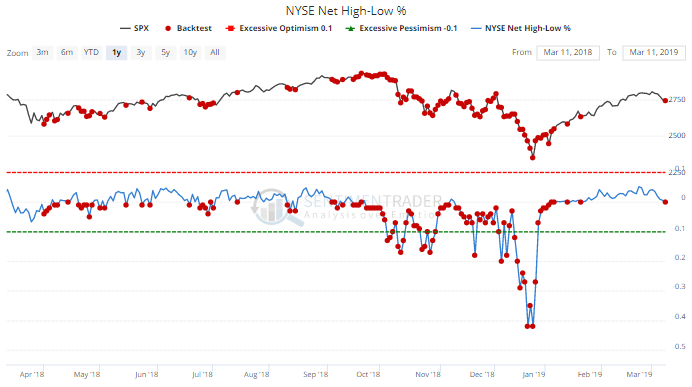
The reversals have pushed more NYSE securities to new 52-week lows than 52-week highs, the first time in weeks that has been the case. When the Net New High / New Low Ratio is below 0, that's a negative sign.
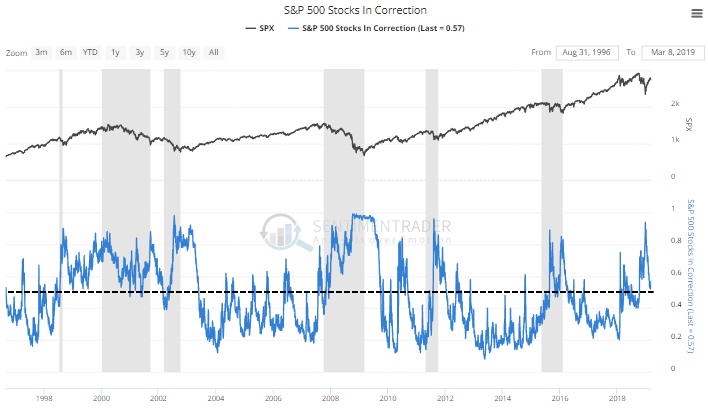
It's also worth noting that over half of S&P 500 stocks are still in correction territory (at least 10% below their 52-week highs).
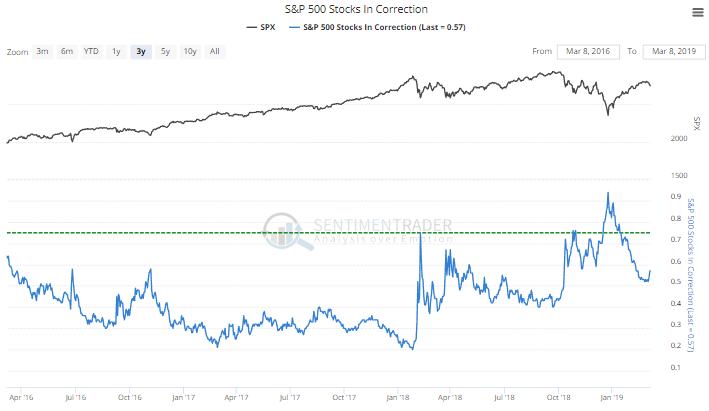
Long-term healthy bull markets usually see this figure hold below 50%.
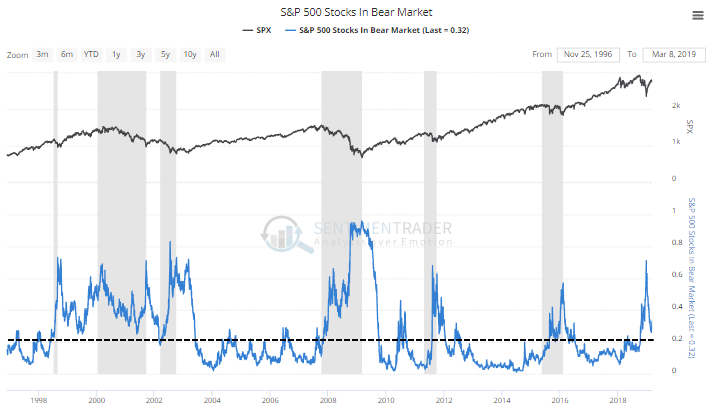
And we usually see fewer than 20% of stocks in bear markets (more than 20% below their highs) during healthy markets. We're still above 30% now.
Options
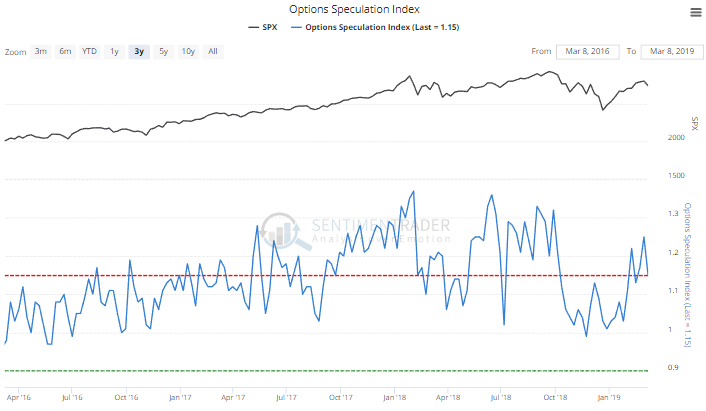
In recent reports, we'd seen that there has been a spike in small-trader leveraged bets on a further market rally, which has preceded poor returns. Now that we got a bout of weakness, traders have pulled back on their bullish strategies. The Options Speculation Index is still high, but not quite to "imminent danger" levels.
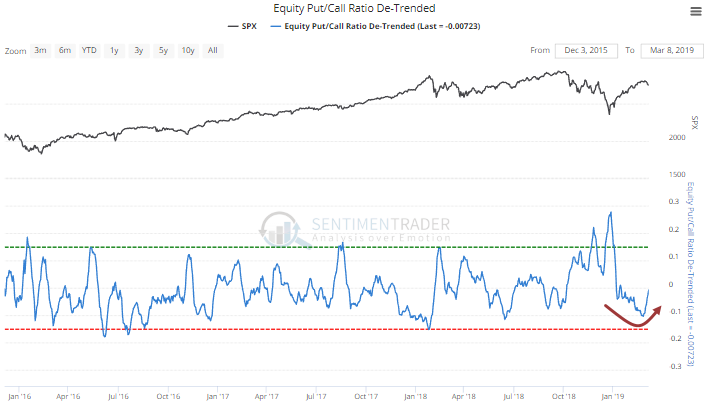
This type of behavior is also causing the De-Trended Put/Call Ratio to curl higher. This has usually meant limited upside.
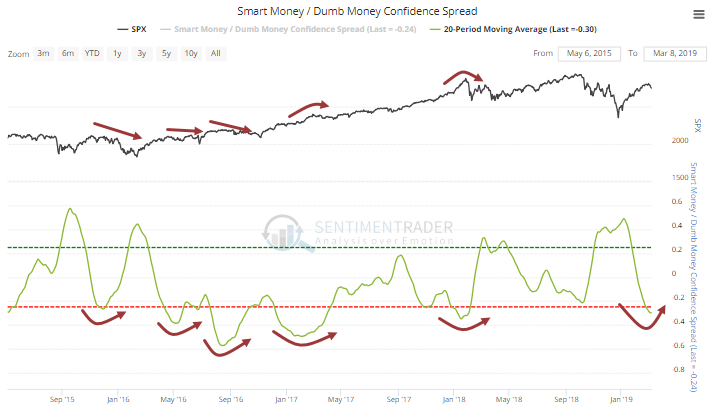
In a general sense, we're starting to see signs that risk appetite is waning after hitting an extreme. The 20-day average of the spread between Smart and Dumb Money Confidence is also now curling higher.
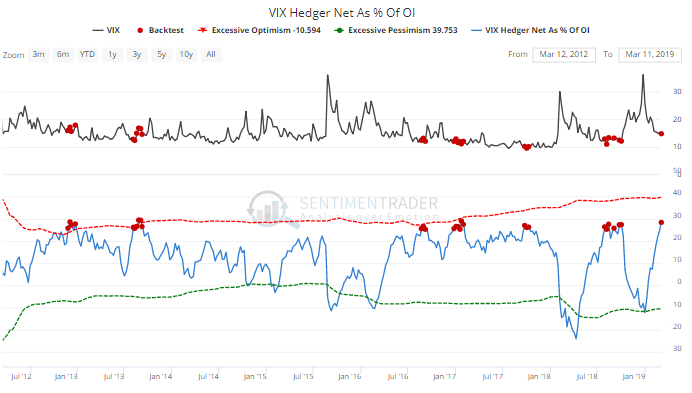
This is occurring as "smart money" traders have built up a net long position totaling more than 25% of the open interest in VIX futures.
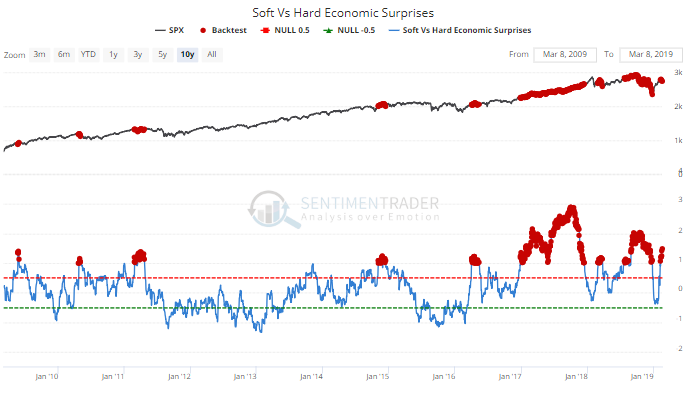
This is coming just as surveys of consumers are showing more optimism than economists expected while hard data isn't keeping up. That made absolutely no difference in 2017, but other than that exceptional period, it suggested that things were running a little too hot, without justification.
Dollar and Gold
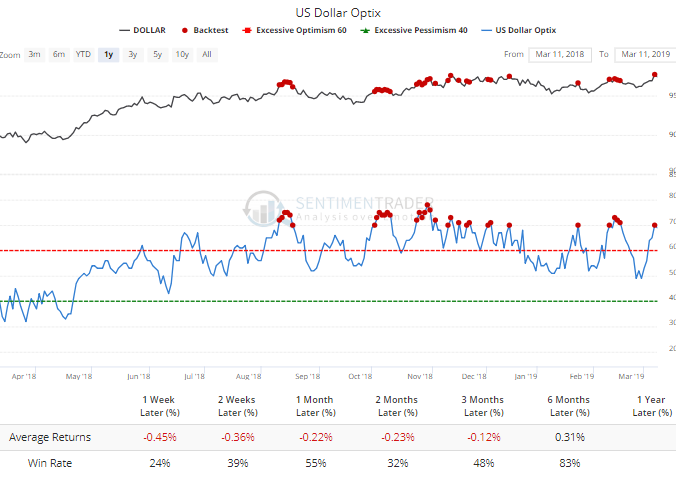
The Optimism Index for the U.S. dollar jumped to 70% late last week, a level that has preceded some tough weeks for the buck during the past year.
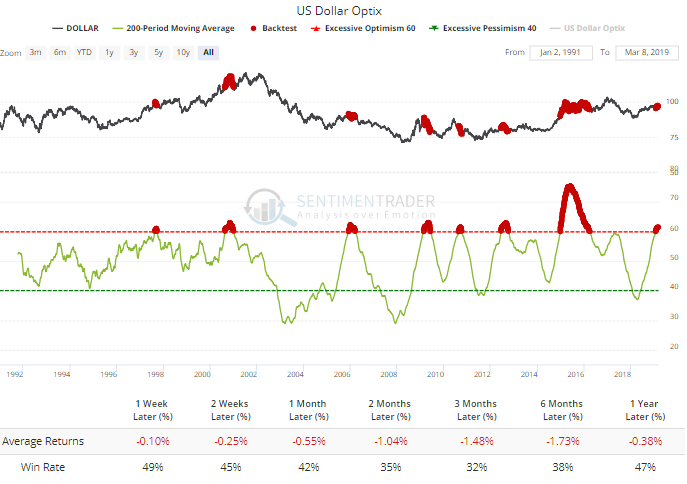
That's on a shorter-term basis. On a very long-term basis, the 200-day average of the dollar's Optimism Index has moved above 60%, a rarely-achieved level that has led to some longer-term trouble.
Optimism in gold has taken a corresponding hit, and at 35% is at a low-but-not-quite-extreme level. Since gold peaked in 2011, this has preceded just slightly positive returns.
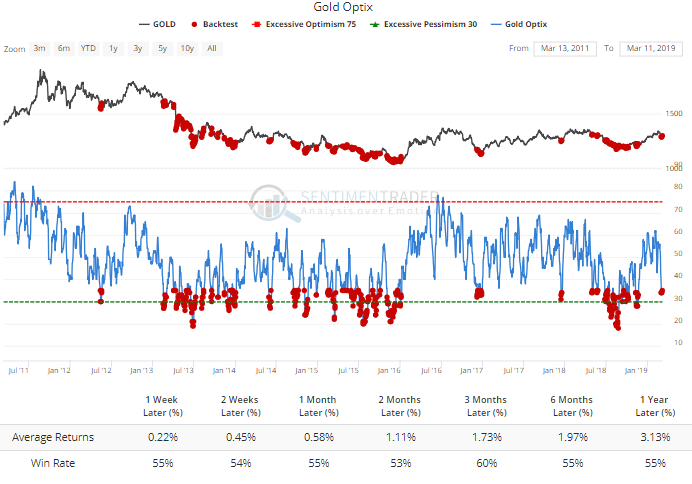
Returns have improved significantly when the Optimism Index dropped below 30%, so that's something to watch for in the coming week(s) if gold continues to struggle.
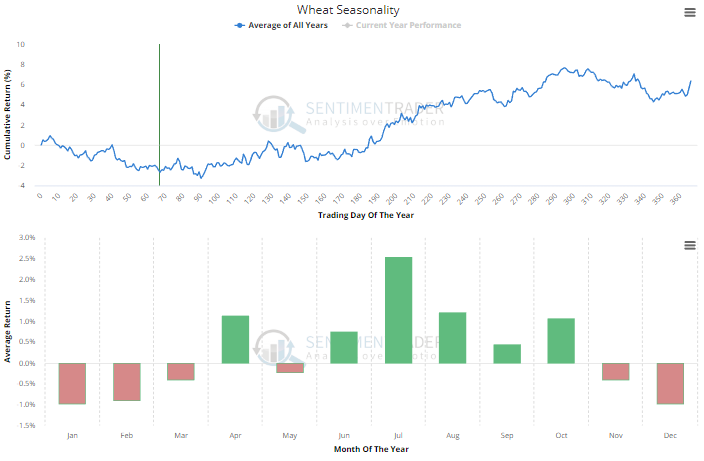
The rise in the dollar has hurt other commodities, and grains have been horrid. The Risk Level for agriculture has averaged just above 2 for two weeks now, and over the past couple of years, anyway, that has led to bounces in funds like DBA.
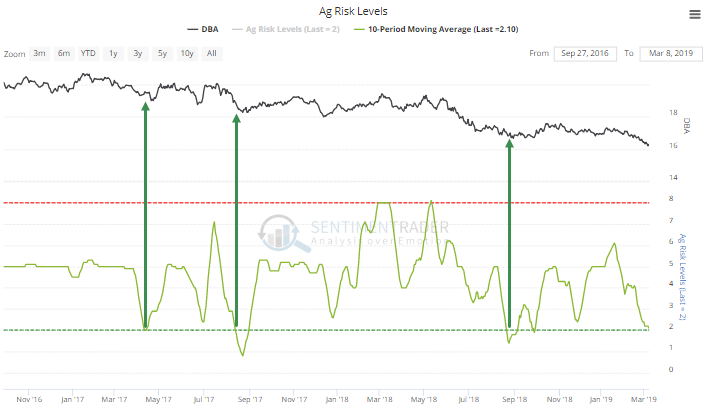
It may be a *little* bit easier for those contracts to rally as they ease from the worst part of their seasonal cycles.