
Can this rally last another 18 months?

Key points
- The middle of the decade has been very good for stock market investors
- However, there is no real explanation as to why, and there is no guarantee that this phenomenon will continue
- Still,the history suggests ignoring "fear porn" and giving the bullish case the benefit of the doubt - with one important caveat
The Middle 18 months
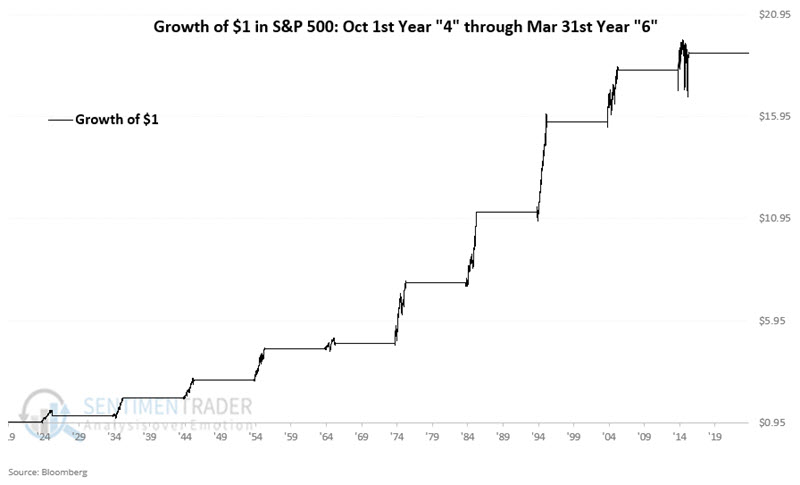
We identify a decade's "Middle 18 months" as October of Year 4 through March of Year 6, i.e., October 1st, 1924, through March 31st, 1926, October 1st, 1934, through March 31st, 1936, and so on.
The chart below displays the growth of $1 invested in the S&P 500 Index only during the Middle 18 months of every decade starting in the 1920's.
The table below displays:
- The dates of each mid-decade period
- The percentage change for the S&P 500 Index from the beginning to the end of that period
- The maximum drawdown from the entry price
- The maximum drawdown within those 18 months from any peak within that period
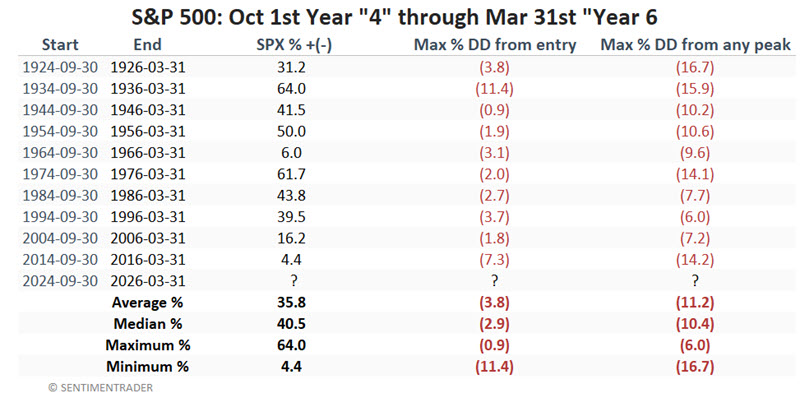
The 18-month mid-decade return ranges from a meager +4.4% (2014 to 2016) up to +64.0% in the 1930s. Of particular interest is the "Max % DD from entry" column. This shows how much of a decline an investor would have had to sit through had they bought on September 30th of Year "4" before returning to profitability. The worst was a drawdown of -11.4% in the 1930s. Eight of the decades witnessed a drawdown of no more than -3.8%.
For what it is worth, using data for the Dow Jones Industrial Average prior to the 1920s, we find the following:
- Feb 1885 (1st month of data available) through March 1886 = +17.2%
- Sep 1894 through Mar 1896 = +6.7%
- Sep 1904 through Mar 1906 = +68.3%
- Sep 1914 through Mar 1916 = +78.2%
The information above strongly suggests continuing to give the bullish case the benefit of the doubt. But as always, nothing is guaranteed in the markets, and one caveat in particular should be noted.
The caveat? High valuation
Market history has taught us that new all-time highs by themselves are not something to fear. That is good because, as the chart below shows, the stock market has been going gangbusters.
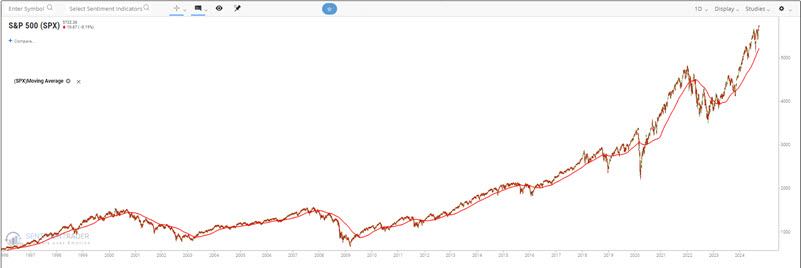
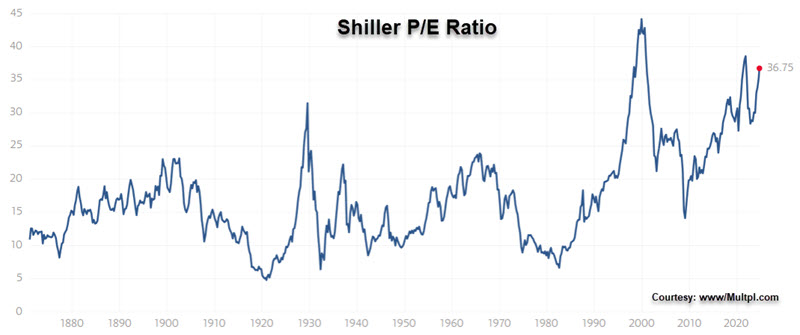
It almost requires a leap of faith to believe it could continue to soar over the next year and a half. Another reason not to put one's head in the sand and assume the market will continue to soar is the current high level of market valuation. The chart below (courtesy of Multpl) displays the history of the Shiller P/E Ratio, which is historically at an extremely high level between 36 and 37.
The table below displays the Shiller P/E Ratio at the beginning and end of the mid-decade periods highlighted above.
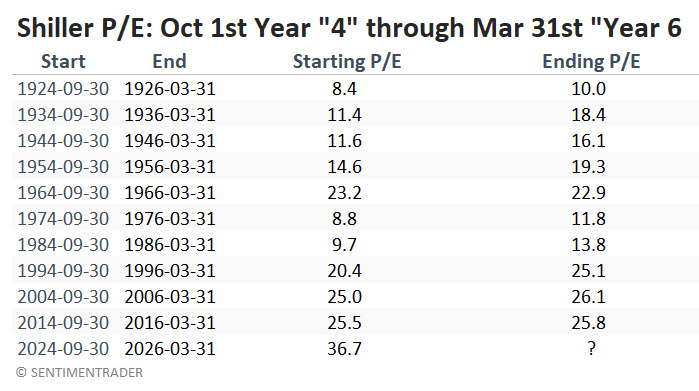
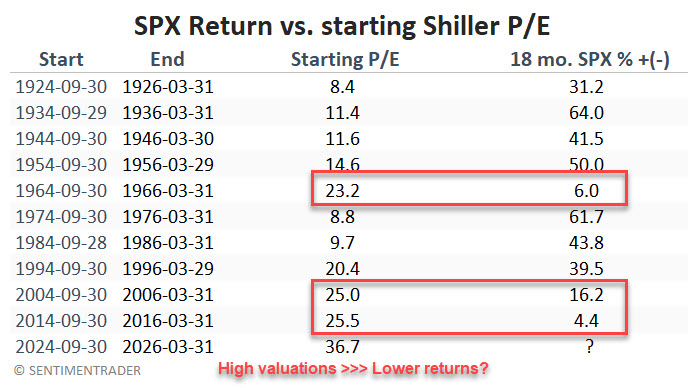
Note that the three lowest performing mid-decade periods (1964 to 1966 = +6.0%, 2004 to 2006 = +16.2%, and 2014 to 2016 = +4.4% - see table below) were accompanied by the three highest "Starting P/E" ratio levels in the table above (1964 = 23.2, 2004 = 25.0, 2014 = 25.5). This may not be coincidental, as high P/E ratios tend to suggest less overall upside potential. With the Shiller P/E now much higher - at 36.7 as this is written - this is a viable concern regarding how much upside truly remains.
Valuation (P/E ratios, price-to-sales ratios, price-to-book value ratios, etc.) are NOT useful as market timing indicators. They do not tell you when to buy or sell. They merely suggest the amount of upside or downside potential in the years ahead. That said, note that the "Year 4 to Year 6" period has never started with valuations anywhere as high as the current level near 36 to 37.
What the research tells us…
If market history holds, the stock market could surprise many people by continuing to power higher over the next year and a half. However, there is no guarantee that the past will be prologue in the market. The information above is merely favorable "weight of the evidence" and not a "buy signal." The proper way to interpret this is that long-term investors should continue to give the bullish case the benefit of the doubt until the market gives them a reason not to (i.e., ignore all the gloom and doom talk of any "impending top" and ride the trend as long as the trend remains in place).
On the other hand, the information on market valuation reminds us that if the market does begin to falter (for example, if the major indexes start to drop below longer-term moving averages), we should not cling to any "But the market is supposed to rally through March of 2026" notions.