
Calendar Quirks for 2021

The good news regarding seasonality is that if used properly it can help to give you an edge in the markets. The bad news is, a) it definitely requires a leap of faith, and b) there is never any guarantee that a given seasonal trend will work this time around. So, with all of that in mind, let's consider a few seasonal quirks that might be in play in 2021.
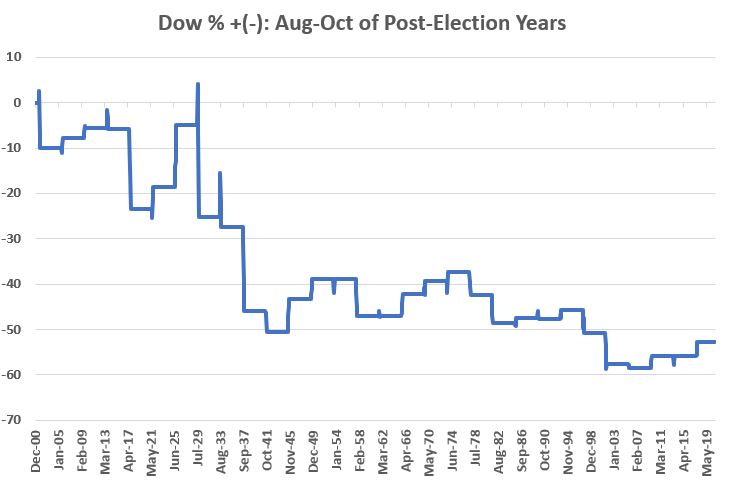
August through October
The chart below displays the cumulative price % + (-) for the Dow Jones Industrials Average ONLY during:
- August, September and October of Post-Presidential Election years
In other words, we are looking at a specific 3-month period once every 4 years (you see what I mean about a "leap of faith" now, right?). Still, the results are at the least interesting.
By the numbers, we find the results below. In a nutshell, this period has been a 50/50 proposition, but the key thing to note is that the down periods were significantly worse than the up periods. This tells us that signs of trouble during these months should probably be taken very seriously.
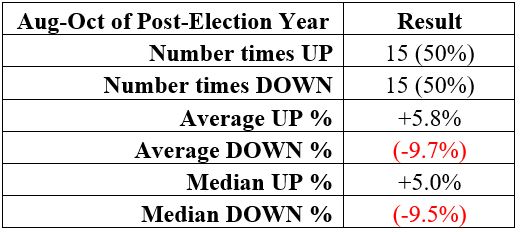
So, the bottom line is that while there is no guarantee that August through October of 2021 will witness a market decline, historically not a whole of good things have happened in the market during this period. Now let's move on to "happier times".
Post-Election "Favorable Months"
During post-election years the most favorable months have been:
- March
- April
- May
- July
- December
The chart below displays the cumulative price % +(-) for the Dow Jones Industrials Average ONLY during these 5 months.
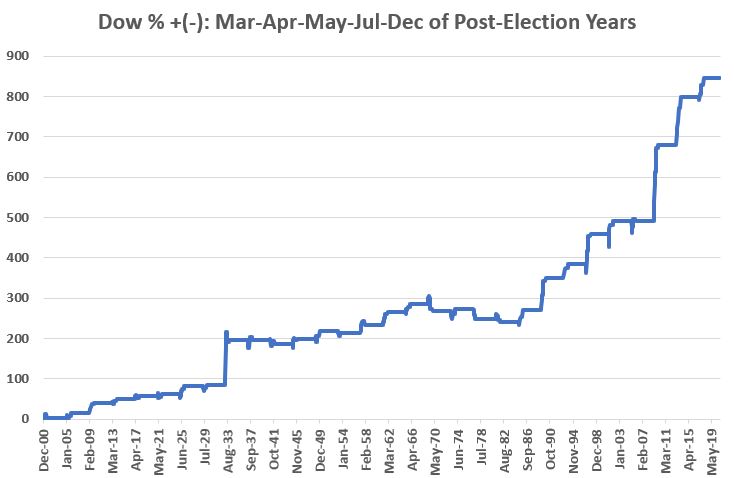
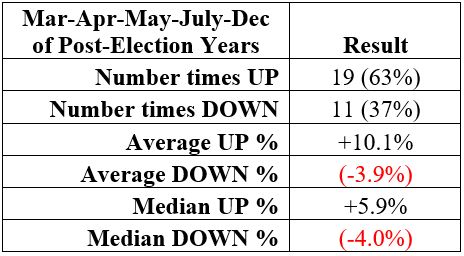
It bears repeating that there is never a guarantee that the stock market will register a gain during any of these months either individually or as a whole. Still, the picture in the chart above is a much more pleasant one than the chart further up the page.
Summary
Can this information be used systematically? Well, technically it can, but the better question is "should it be?" The history is what the history is but what happens in 2021 is anyone's guess. Still, at the very least history also suggests that giving the bullish case the benefit of the doubt during certain months, and paying close attention for signs of trouble during other months.