
Buying surge argues against a bear market rally

Key points:
- The buying surge over the past few sessions is reasonably comparable to March 2020
- Multi-day reversals like we've seen over the past week have consistently preceded further gains
- Fewer stocks are in trouble, a welcome change from recent weeks
Buying surge triggers rare comparisons
Here we go again.
In late March 2020, thrusts in buying interest were wildly impressive. But almost all technicians mocked them as "unofficial" because they didn't meet some arbitrary, cherry-picked, overly optimized rules.
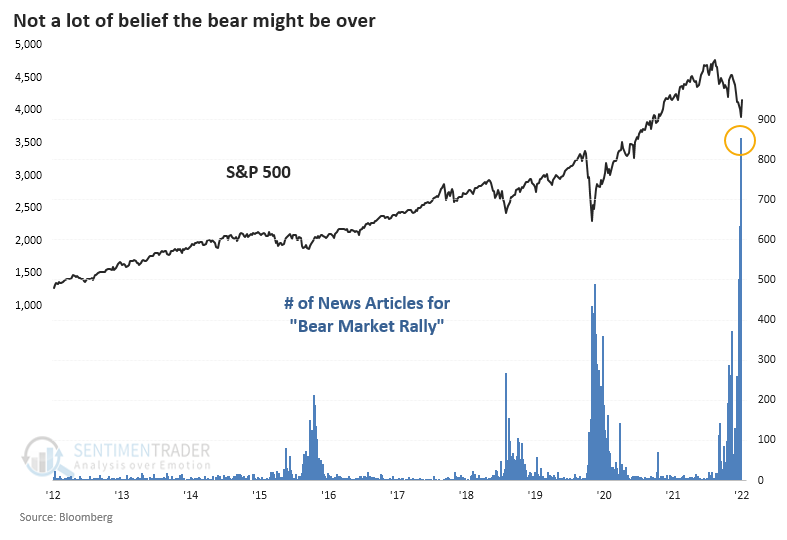
It's happening again, and there is even more skepticism that this rally is real. The number of articles dismissing the gains as just another "bear market rally" is nearly double the prior record from early April 2020.
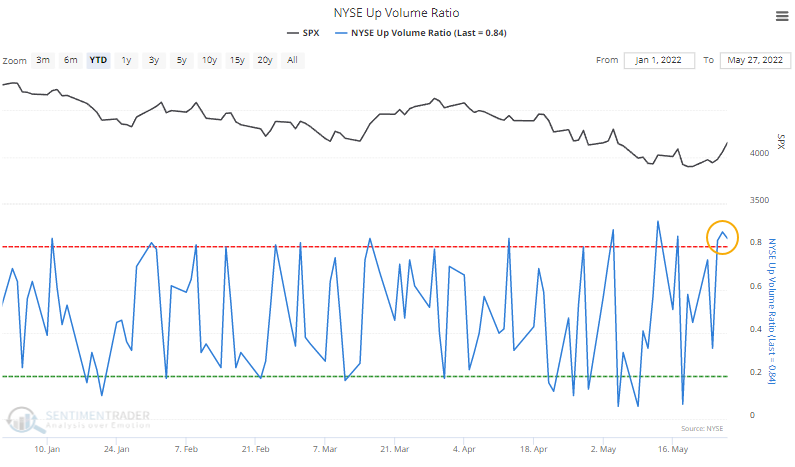
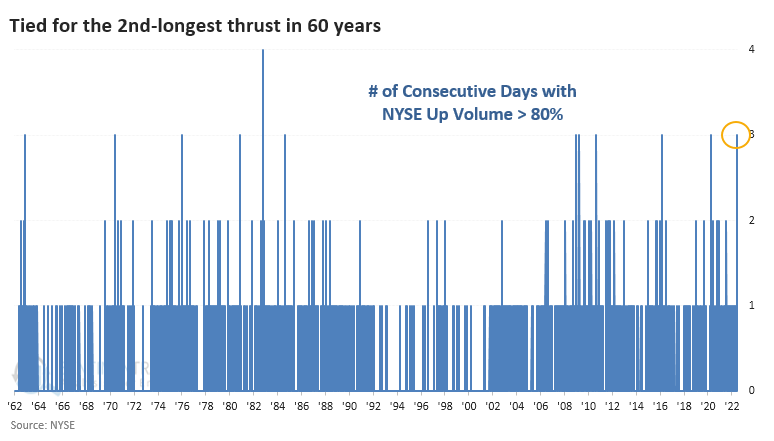
In the three days leading up to the exchange holiday, more than 80% of volume on the NYSE flowed into advancing stocks. We typically do not see this kind of behavior during bear markets, usually at the end of them.
The only time in 60 years when there was a longer streak of overwhelming buying interest was October 1982, during the 2nd phase of the kickoff to one of the greatest bull runs in history.
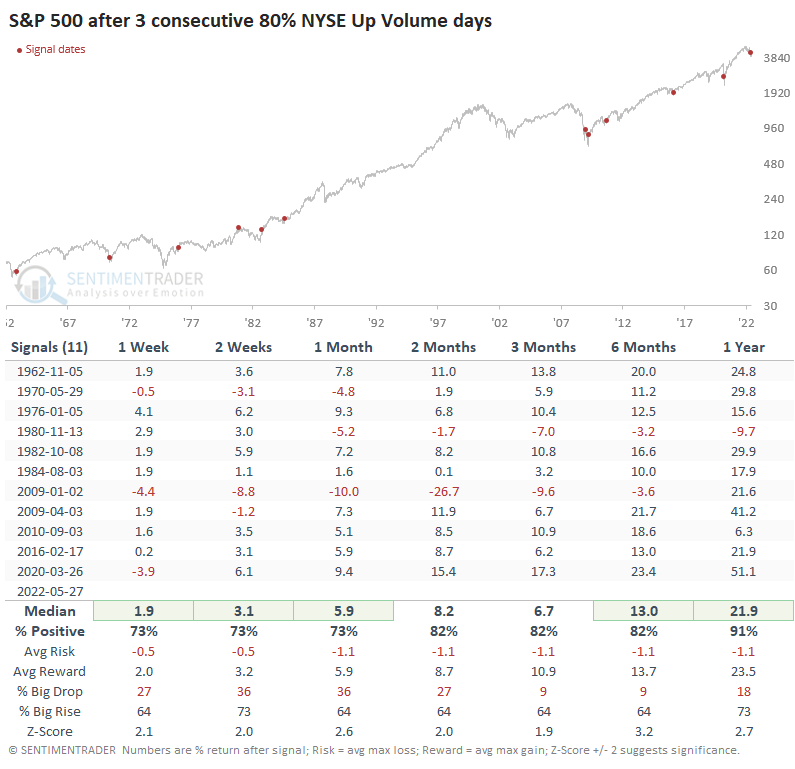
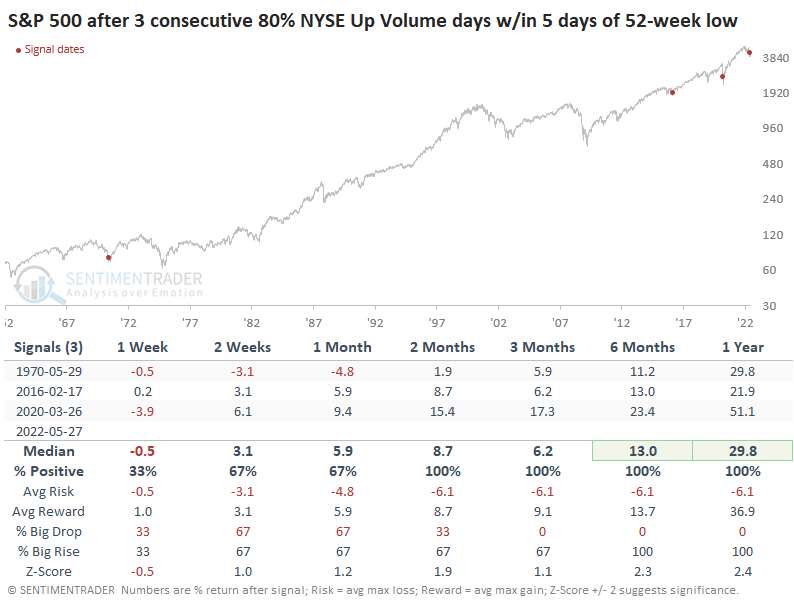
Whenever they occur, streaks of three consecutive days with more than 80% up volume have shown a strong tendency to lead to positive forward returns in the S&P 500 across all time frames. Only 2 of 11 signals showed a loss from two months and beyond, and the risk/reward ratio was exceptionally positive. This should be familiar from when we discussed it ad nauseam two years ago.
Even more significantly, this thrust is coming directly on the heels of what had been a 52-week low in the S&P 500. Similar behavior triggered only three other times, so we're dealing with a minuscule sample size, but the consistency of future returns is notable. Each of them ended bear markets.
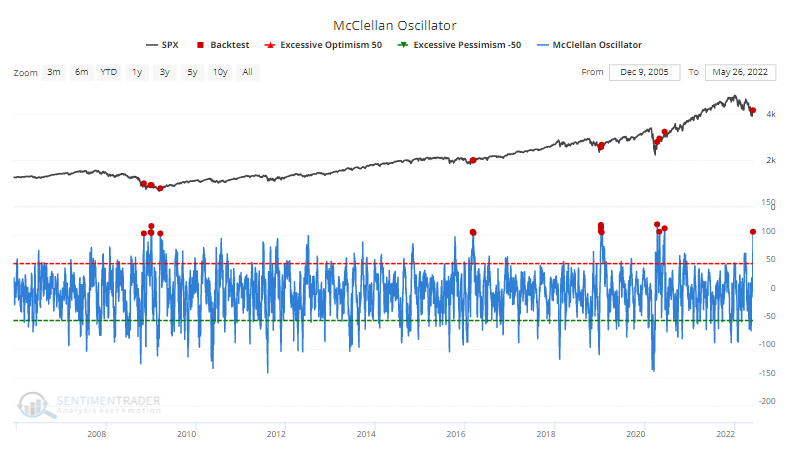
All the buying pressure pushed the McClellan Oscillator above +100. Every time this happened in the past 20 years, it marked the end of the selling pressure (or very close to it).
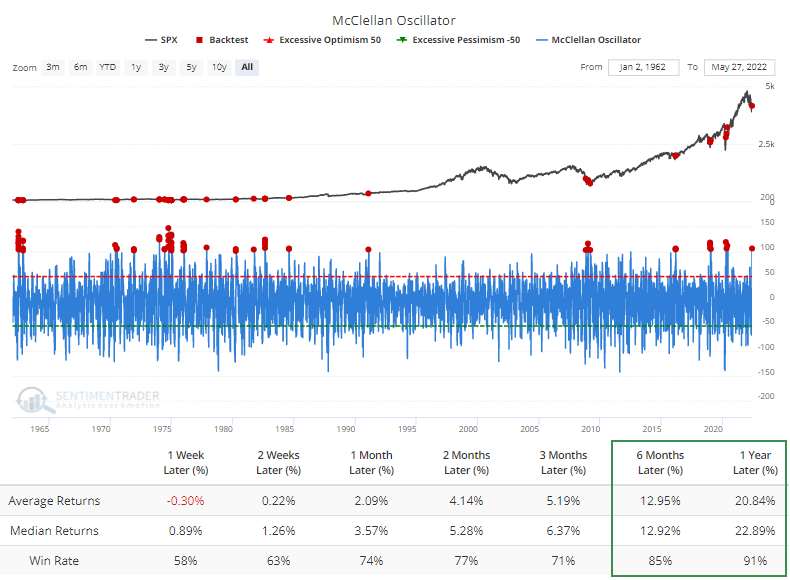
That was the case longer-term, as well. The Backtest Engine shows that 59 out of 65 dates showed a positive one-year return in the S&P 500. The only time period with more than a 2% loss was January 1974.
Fewer stocks in trouble
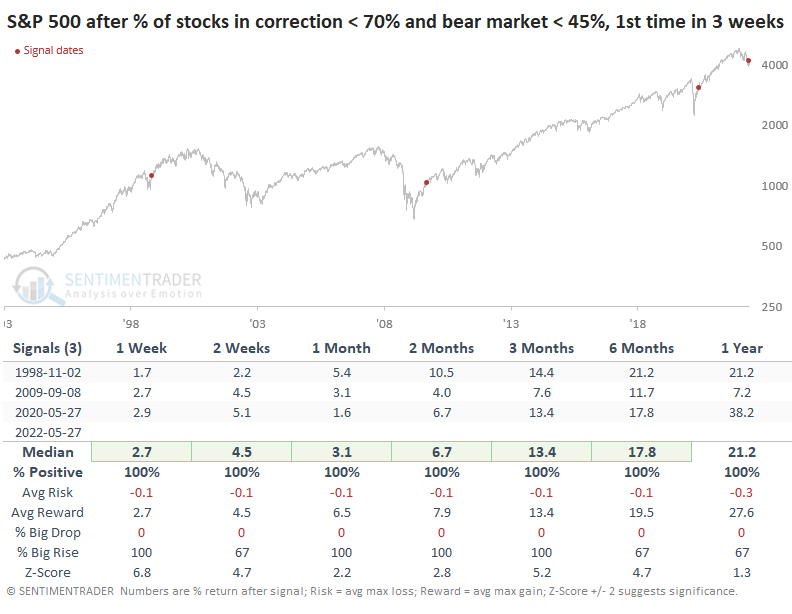
With the furious rally, suddenly, fewer stocks are in trouble. There was a quick reversal in the percentage of stocks within the S&P 500 in corrections and bear markets.
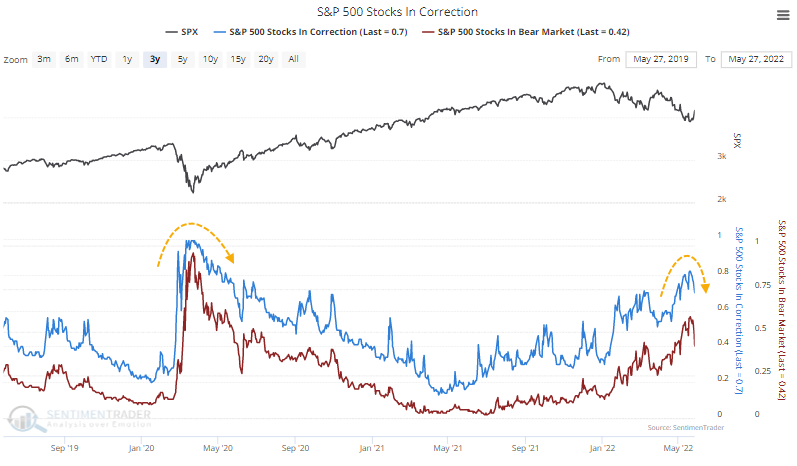
Again, we have to deal with a pathetically small sample size, but over the past 30 years, there have only been three other times when both metrics reversed from high levels at the same time. When they reverse simultaneously, it suggests a broad-based rebound and not just a dead-cat reversal of some of the hardest-hit stocks.
As a result of many stocks lifting off their lows, the net percentage of NYSE securities that rose to a 52-week high versus fell to a 52-week low finally popped into positive territory after ticking below -30%. That has been a bear killer lately, though it also generated several false positives in 2008.
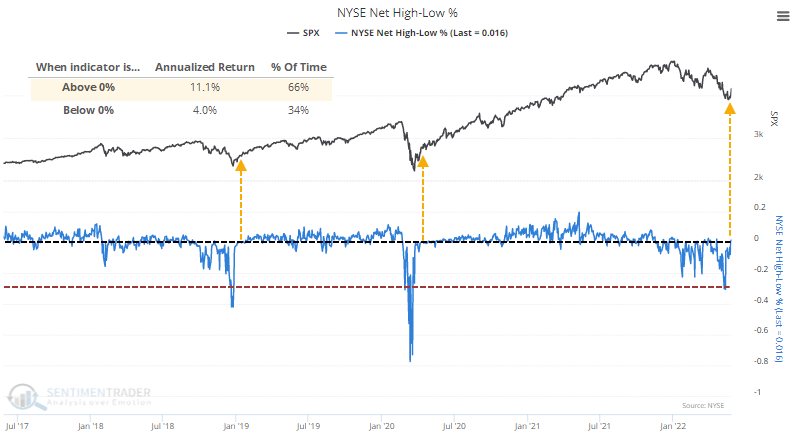
It has been much easier for stocks to rise when this figure is positive. Over the past 60 years, the S&P 500's annualized return when the net percentage is positive has been nearly triple its average return when there are more 52-week lows than highs.
What the research tells us...
Bear markets are infrequent. There aren't very many of them to compare against by their very nature, which means sample sizes invariably become small, and it gets harder to have high confidence in results. That's especially true when looking at data sources with limited history anyway. There have been only a handful of truly bad markets over the past 30 years, making it tough to generate precedents. From the data that we do have, however, it's clear that the type of decline we saw heading into May and then the rebound of buying interest over the past several sessions is that type that has consistently led to further gains in the months ahead.