Data &
Technology
Research
Reports
Report Solutions
Reports Library
Actionable
Strategies
Free
Resources
Simple Backtest Calculator
Simple Seasonality Calculator
The Kelly Criterion Calculator
Sentiment Geo Map
Public Research Reports
Free Webinar
Pricing
Company
About
Meet Our Team
In the News
Testimonials
Client Success Stories
Contact
Log inLoginSign up
< BACK TO ALL REPORTS

Buying So Eager It's Never Been Seen Before

Jason Goepfert
2020-02-06
S&P 500 futures have been gapping up every day. The McClellan Summation Index has been positive for more than a year.

Early and aggressive

Buyers keep coming into stocks before regular trading hours. Before each of the past 3 sessions, buyers pushed S&P 500 futures up at least 0.45% before the open.

S&P 500 futures gaps

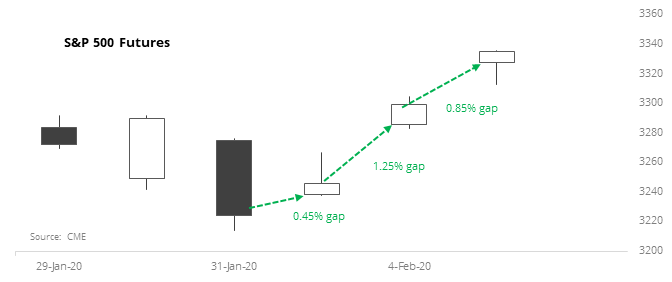
With a new all-time high by the close, this kind of buying pressure has never been seen before.

Since the inception of the futures in 1982, there have only been a few times when buyers were so eager that they pushed the futures up at least 0.25% before regular trading hours for three sessions in a row. Each of them preceded losses in the futures either 1 or 2 months later, but at this point it seems like any historical precedents are strictly “FWIW.”


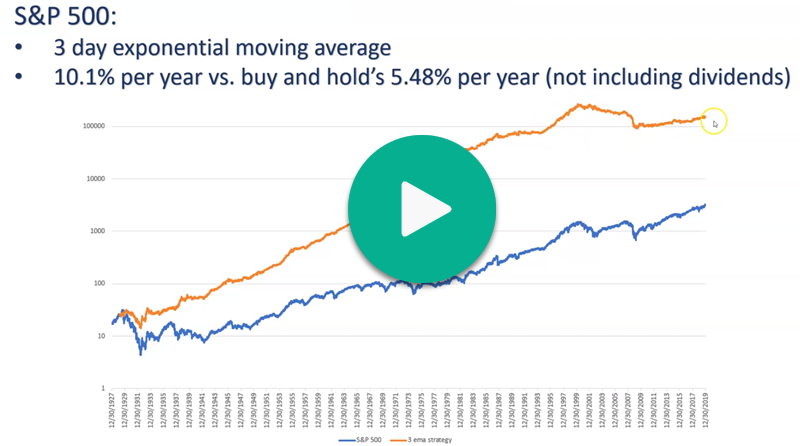
Ultimate guide to moving averages

Most technicians (and even many fundamentalists) look at moving averages on price charts. We're conditioned to use certain ones, like the 200-period, no matter the market or time frame. But is that the best one to use?

Troy goes in-depth about moving averages and the best ones to use for different markets in this overview video:

The best moving averages to use for trading


McClellan Summation

The U.S. stock market's rally since December 2018 has been very persistent, causing long term breadth indicators like the McClellan Summation Index to stay consistently positive.

McClellan Summation Index

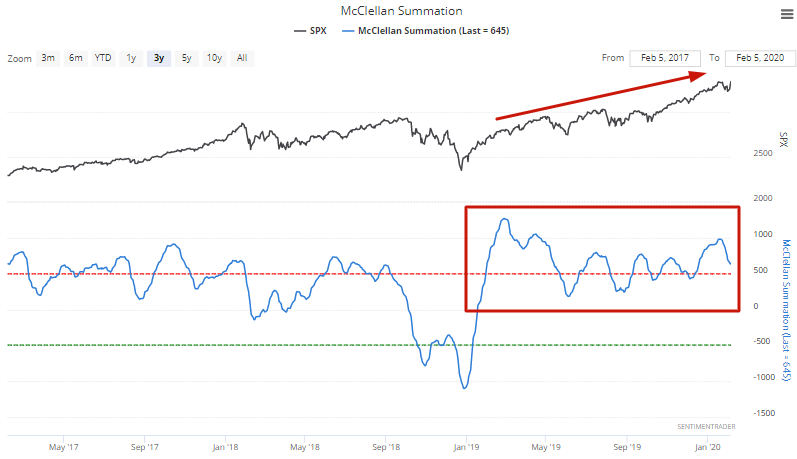
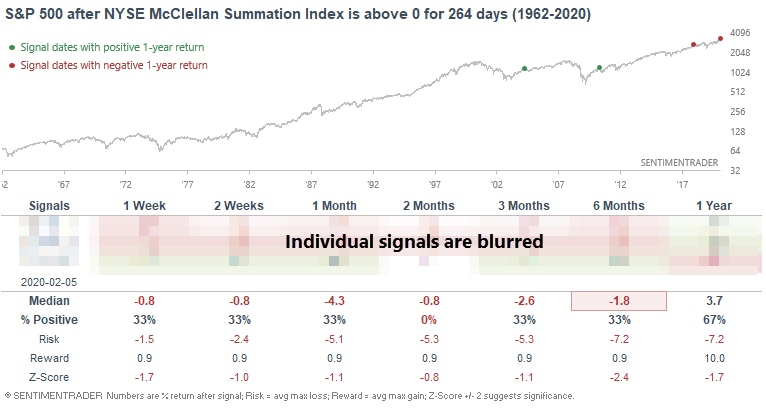
It has now been above the zero line for more than a year, marking its 4th-longest stretch since 1962.

The 3 other times the McClellan Summation Index was positive for so long, stocks either fell immediately, or melt-up and then tanked.

McClellan Summation above 0 for a year

This is an abridged version of our recent reports and notes. For immediate access with no obligation, sign up for a 30-day free trial now.

We also looked at:

  • The S&P went months without a 1% move, now its has seen a cluster of them
  • A broad swath of investors have record low allocations to cash
  • Sentiment hit an extreme, stocks dipped, then recovered - what happens next
  • The new high / new low ratio is surging again
  • Oddly, traders are pushing the QQQ Liquidity Premium higher
DATA &
TECHnologies
IndicatorEdge
‍
BackTestEdge
‍
Other Tools
‍
DataEdge API
RESEARCH
reports
Research Solution
‍
Reports Library
‍
actionable
Strategies
Trading Strategies
‍
Smart Stock Scanner
‍
FREE
RESOUrCES
Simple Backtest
Calculator
Simple Seasonality
Calculator
The Kelly Criterion
Calculator
Sentiment Geo Map
‍
Public Research Reports
‍
Free Webinar
COMPANY
‍
About
‍
Meet our Team
‍
In the News
‍
Testimonials
‍
Client Success Stories
Pricing
Bundle pricing
‍
Announcements
‍
FAQ
© 2024 Sundial Capital Research Inc. All rights reserved.
Setsail Marketing
TermsPrivacyAffiliate Program
Risk Disclosure: Futures and forex trading contains substantial risk and is not for every investor. An investor could potentially lose all or more than the initial investment. Risk capital is money that can be lost without jeopardizing ones’ financial security or life style. Only risk capital should be used for trading and only those with sufficient risk capital should consider trading. Past performance is not necessarily indicative of future results.

Hypothetical Performance Disclosure: Hypothetical performance results have many inherent limitations, some of which are described below. No representation is being made that any account will or is likely to achieve profits or losses similar to those shown; in fact, there are frequently sharp differences between hypothetical performance results and the actual results subsequently achieved by any particular trading program. One of the limitations of hypothetical performance results is that they are generally prepared with the benefit of hindsight. In addition, hypothetical trading does not involve financial risk, and no hypothetical trading record can completely account for the impact of financial risk of actual trading. for example, the ability to withstand losses or to adhere to a particular trading program in spite of trading losses are material points which can also adversely affect actual trading results. There are numerous other factors related to the markets in general or to the implementation of any specific trading program which cannot be fully accounted for in the preparation of hypothetical performance results and all which can adversely affect trading results.

Testimonial Disclosure: Testimonials appearing on this website may not be representative of other clients or customers and is not a guarantee of future performance or success.